
Abstract
Purpose
To evaluate whether the additive needle tract ablation (TA) can reduce adherent cells on the needle tract after radiofrequency ablation (RFA) in a preclinical HCC mouse model.
Methods
Hep3B-Luc cells were engrafted in the Balb/c-nude mice. Nineteen mice were randomly assigned into three groups: the needle only group (needle placement only without performing RFA), the RFA only group (needle placement with active RFA treatment), and the RFA-TA group (needle placement with active RFA treatment and additive tract ablation). The 17-gauge needle with a 10-mm active tip was used. After RFA and TA, the viability of adherent tumor cells on the RFA needle was evaluated with bioluminescence imaging (BLI) and live-cell counting.
Results
We observed that RFA-TA group had the lowest BLI values compared with other groups (needle only group, 11.2 ± 6.4 million; RFA only group, 13.6 ± 9.1 million; RFA-TA group, 1.11 ± 0.8 million, p = 0.001). Live cell counting with acridine orange/propidium iodide staining also confirmed that the counted viable cell numbers in RFA-TA group were lowest compared to the other groups (needle only group, 14.8 ± 4.5; RFA only group, 643.8 ± 131.9; RFA-TA group, 1.5 ± 0.9, p < 0.001).
Conclusions
The additive tract ablation can significantly reduce the number of viable tumor cells adherent to the RFA needle, which can prevent needle tract seeding after RFA procedure.
Introduction
Radiofrequency ablation (RFA) is one of the curative treatments for hepatocellular carcinoma (HCC). An important factor accounting for the widespread use of RFA is the excellent safety profile that includes low mortality and morbidity compared to curative surgical resection. However, RFA generally shows higher local tumor recurrence than surgical resection. Needle tract seeding, one of the main causes of tumor recurrence after RFA, can be a serious complication because it can lead to extrahepatic tumor spreading [Citation1–3], which has fewer therapeutic options than intrahepatic tumor recurrence.
Possible mechanisms for tract seeding after RFA include: (1) tumor cells that adhere to the RFA needle are carried along the needle tract as the needle is retracted; (2) tumor cells moved along the needle tract with the incidence of intra-tumoral bleeding; (3) tumor cell disseminated from the tumor by the intra-tumoral pressure during the RFA procedure and the needle retraction. [Citation1]. It is extremely difficult to investigate these mechanisms in a clinical research setting; thus, only a few studies evaluated this issue. Sophocleus et al. demonstrated that morphologically intact tumor tissue adhered to the RFA needle in patients treated with RFA and tract ablation [Citation4]. Snoeren et al. evaluated the morphology and viability of tumor cells after rinsing the retracted RFA needle, finding viable tumor cells adhered to the needle in patients treated with RFA without tract ablation [Citation3].
These results alarmingly suggest that tumor cells adhering to the needle can be the main cause of tract seeding. However, these results were based on morphology or G6PD staining of rinsed cells from patients. In addition, the effect of tract ablation (TA) has not been evaluated systematically in experimental animal studies. Thus, we aimed to evaluate whether the addition of TA can reduce the number of adherent cells on the needle tract by direct visualization of viable tumor cells using bioluminescence imaging in a preclinical HCC mouse model.
Materials and methods
Cell culture
Human hepatocellular carcinoma cells (Hep3B) were purchased from the Korean Cell Line Bank (Seoul, Korea). Hep3B cells were transduced with a lentivirus containing the firefly luciferase reporter gene. Then, highly expressing reporter clones were isolated to establish Hep3B-luc cells. Hep3B-luc cells were maintained with Dulbecco’s modified eagle’s medium (DMEM; Thermo Fisher Scientific, Waltham, MA) supplemented with 10% fetal bovine serum (FBS; Thermo Fisher Scientific) and 1% penicillin–streptomycin (Thermo Fisher Scientific). Cells were cultivated in 5% CO2 at 37 °C in an incubator.
Animal model
All animal procedures were performed according to Asan Institutional Animal Care and Use Committee approved protocol (AMC-IACUC 2017-13-227). Five-week-old male Balb/c nude mice (n = 21) were provided from OrientBio (Gyeonggi, Korea) and maintained under specific pathogen-free conditions. For the xenograft model, 1 × 10⁶ of Hep3B-luc cells were suspended in 0.1 mL DMEM and subcutaneously injected into the right flank of each mouse through a needle syringe.
A total of 19 mice were included in this study, excluding two mice in which there was no tumor development. Mice bearing liver tumors were randomly assigned using random-number generator into three groups: Needle only group (RFA needle placement in the tumor without performing tumor ablation, n = 7), RFA only group (RFA needle placement with tumor ablation, n = 5), RFA-TA group (RFA needle placement with tumor ablation and tract ablation, n = 7).
Radiofrequency ablation
Under anesthesia with isoflurane, a right flank skin incision was made to expose the tumor. A 480 kHz radiofrequency (RF) generator (RF MEDICAL Co., Seoul, Korea) was used that apply the conventional monopolar radiofrequency energy. An internally cooled, 17-gauge needle electrode with a 10-mm active tip generated for animal research purpose from RF MEDICAL Co. was placed at the center of the tumor so that a similar volume of tumor tissue could be ablated in each group.
For tumor ablation, we applied radiofrequency ablation for 1 min with the 5-watt power using pump cooling mode. For the additive tract ablation, the needle was heated without pump cooling until the temperature of the tumor reached 80–100 °C. This method of induced RFA with high temperatures to ablate the needle tract was modified from previously published research [Citation5–8].
Bioluminescence imaging
Bioluminescence imaging (BLI) was acquired using the IVIS Spectrum in vitro imaging system (PerkinElmer, Waltham, MA) for imaging of both tumor-bearing mice and extracted needles. The acquired BLI images were analyzed using Living Image® 4.2 software (PerkinElmer, Waltham, MA) to measure the peak total bioluminescent signal [Citation9].
For the animal BLI imaging, mice were anesthetized with 1% isoflurane in room air. D-Luciferin (Promega, Madison, WI) dissolved in phosphate buffer saline (PBS; Thermo Fisher Scientific) was injected intraperitoneally at a dose of 150 mg luciferin/kg. After incubation for 5 min, serial images were acquired (exposure time: 5 s, f/stop: 1). We measured the peak total tumor bioluminescent signal through standardized regions of interest (ROIs) on tumors. For calculations of relative BLI values of the tumors, BLI values of post-RFA images were divided by BLI values of pre-RFA images.
For RFA needle imaging, we cut a 2 cm tip of the needle that was inserted in the tumor. Then, we placed the needle tip in a well of a 6-well plate with D-luciferin solution (1.5 mg luciferin/100 µL PBS) for imaging. After incubation for 1-min, serial images were acquired (exposure time: auto, f/stop: 1). We measured the peak total tumor bioluminescent signals on cells adherent to the RFA needles.
Live cell counting
After BLI imaging, in order to collect tumor cells that were attached in the RFA needle, we placed each cut needle tip in a 1.5 mL tube, added 1X trypsin-EDTA solution, and incubated for 2 min. The 1.5 mL tubes containing tumor cells were centrifuged, and all the collected cells were mixed with 18 µL of PBS and 2 µL of acridine orange/propidium iodide following the methods of the previously published research (AO/PI, Logos Biosystems, Gyeonggi, Korea) [Citation10–12]. The mixed solution stains dead cells with a red color while viable cells are stained green, enabling live cell counting. Then, 20 µL of the mixed solution were loaded into chambers of the hemocytometer. We counted all viable tumor cells using a microscope (ZEISS, Oberkochen, Germany) with a magnification of 100×.
Statistical analysis
Data are expressed as the mean ± standard deviation (SD). Continuous variables, including the BLI signal of animals and RFA needles, viable cell numbers were compared among groups using the one-way analysis of variance (ANOVA) with post-hoc multiple comparison tests. A p-value <0.05 was considered to indicate a significant difference. All data were calculated using commercially available software (SPSS, version 21.0 for Windows, IBM Inc., Armonk, NY).
Results
Animal model
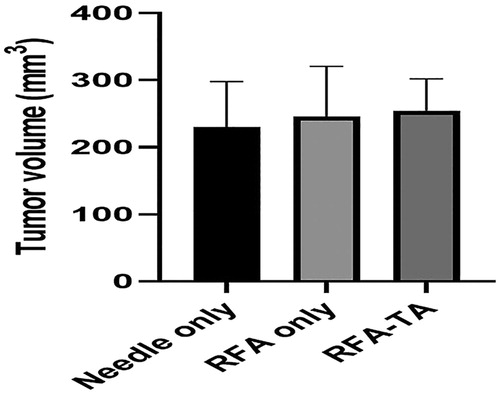
demonstrated average sizes of tumors measured in 19 mice with implanted tumors before the RFA procedure. No significant differences in tumor sizes between groups were observed (needle only group, 230.5 ± 67.6 mm3; RFA only group, 250.6 ± 90.2 mm3; RFA-TA group, 254.9 ± 47.3 mm3; p = 0.78 in one-way ANOVA).
Figure 1. Tumor volume measurement. Tumor volumes measured before the RFA procedure are not different between the three groups (p = 0.78, one-way ANOVA).
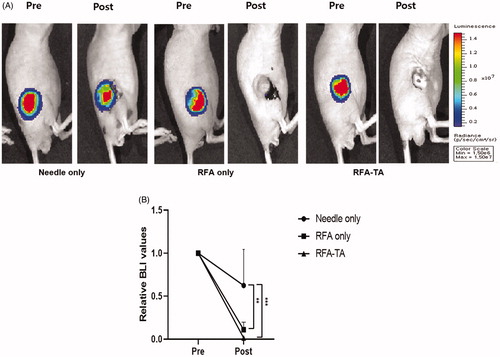
The RFA procedure was successfully performed in all mice. illustrates the effects of RFA procedure on tumor cell viability in each group, which were measured by the BLI signal values of tumors before and after RFA procedures. As presented in , the average BLI signal values measured from the three groups did not differ significantly before the RFA procedures (p = 0.85, one-way ANOVA) but differ significantly after the RFA procedures (p < 0.001, one-way ANOVA). Post-hoc analyses demonstrated that the relative BLI values of the RFA only group (0.12 ± 0.08) and RFA-TA group (0.01 ± 0.01) decreased significantly compared to the needle only group (0.62 + 0.42) after RFA procedures (p < 0.008 for RFA only vs. needle only, p < 0.001 for RFA-TA vs. needle only).
Figure 2. Bioluminescence imaging of the tumors. (A) Bioluminescence images of tumors acquired before and after the RFA procedures. (B) Relative BLI values of tumors measured before and after the RFA procedures. Relative BLI values of the RFA only group and RFA-TA group decrease significantly compared to the needle only group after the RFA procedure (**p < 0.01 for needle only vs. RFA only, ***p < 0.001 for needle only vs. RFA-TA, post-hoc analyses of one-way ANOVA).
Needle imaging
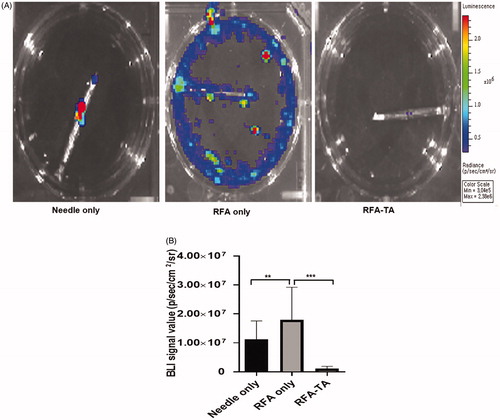
showed the BLI signals of the cells disseminated from the RFA needles and attached cells on the RFA needles. As presented in , the RFA only group had the highest average BLI signals on the RFA needles (13.6 ± 9.1 million), followed by the RFA needle (11.2 ± 6.4 million) and the RFA-TA group (1.11 ± 0.8 million). The difference between the three groups was significant by one-way ANOVA (p < 0.001). Post-hoc analyses revealed that the RFA-TA group had significantly lower BLI signal values than needle only group and RFA only (p < 0.001 for RFA-TA vs. needle only, p < 0.001 for RFA-TA vs. RFA only).
Figure 3. Bioluminescence imaging of the needles. (A) Bioluminescence images of the needle tips acquired after the RFA procedures. (B) BLI values of the needle tips are significantly different between three groups (**p < 0.01 for needle only vs. RFA only, ***p < 0.001 for RFA only vs. RFA-TA, post-hoc analyses of one-way ANOVA).
Live cell counting
demonstrated that the acridine orange/propidium iodide staining of viable live cells and non-viable dead cells, which were washed from the RFA needle tip. Each group had different cell morphological features. The needle only group showed a few live and dead cells with the intact cell morphology, while the RFA only group showed debris that contained morphologically distorted and unidentifiable membranous structures. Notably, in the RFA-TA group, almost no cells were observed, and debris was barely detected.
Figure 4. Live cell counting. (A) The acridine orange stains live cells with a green color, and the propidium iodide staining stains dead cells with a red color. The live cells are abundant in the RFA only group, but are rarely seen in the RFA-TA group (acridine orange/propididum iodine stain, ×10). (B) The average number of live cells in the RFA-TA group is significantly lower than that of RFA only group (***p < 0.001) and needle only group (***p < 0.001), respectively (Post-hoc analyses of one-way ANOVA).
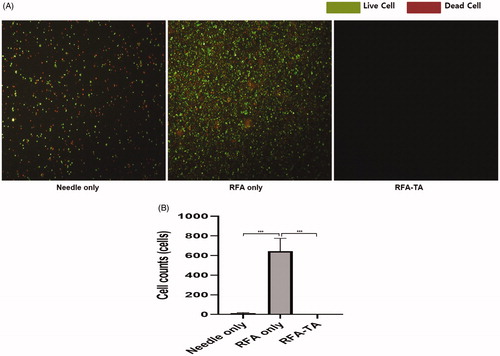
Numbers of viable live cells differed significantly between groups (needle only group, 14.8 ± 4.5; RFA only group, 643.8 ± 131.9; RFA-TA group, 1.5 ± 0.9, p < 0.001 on ANOVA). Post-hoc analysis revealed that the RFA-TA group had significantly lower cell numbers compared to the RFA only group (p < 0.001) and the needle only group (p < 0.001) ().
Discussion
In our study using BLI and live-cell counting, we were able to visualize the living cells adherent to the RFA needle tips and count the live cells. Our experiment results demonstrated that the additive tract ablation could greatly reduce the number of viable tumor cells adherent to the RFA needle, which can prevent needle tract seeding after the RFA procedure.
Viable cancer cells attached to the needle after the RFA are presumed to be associated with a higher risk of tumor recurrence or extrahepatic tumor spread. Incidence rates of needle tract seeding after the RFA procedures were studied by various clinical investigations [Citation2,Citation13–16], and a systematic review conducted by Stigliano et al. found that the mean risk for seeding after RFA alone was 1.73% (range 0–5.56%) and increased up to 2.5% (range 0–12.5%) if ablation followed diagnostic biopsy [Citation2].
So far, there have been several preclinical studies or laboratory experiments which have revealed the existence of live tumor cells adherent to the RFA needle tips [Citation3,Citation4,Citation17–19]. However, there have been only a few studies to demonstrate the effect of additive tract ablation. In a study by Snoeren et al., viable cells were found in 12.5% of patients, and morphologically intact tumor cells were found in 20.0% of patients when track ablation was not performed [Citation3]. In contrast, no viable or morphologically intact tumor cells were detected when track ablation was performed with the RFA procedure. The study used the G6PD staining for quantifying cell death. However, G6PD can be leaked by membrane breakage during the staining steps [Citation20]; thus, the result of G6PD staining has to be interpreted carefully.
The bioluminescence imaging and live cell staining/counting methods used in our study are accurate techniques to evaluate viable live cells [Citation9–12,Citation21]. Thus, our findings using BLI and cell counting can stand as a useful reference for the additive tract ablation research on HCC treatment. Interestingly, live cells and debris were barely detected in the RFA-TA group, while there were a lot of cells and debris were observed in the RFA only group. We postulate that these discrepancies might be attributed to the difference in mechanism between radiofrequency ablation and tract ablation. In the radiofrequency ablation, the RFA needle is cooled with circulating cold water, which may allow adherent cells to alive. Moreover, the radiofrequency ablation causes mechanical vibration of cell and tissue components, which may generate debris. In contrast, in the tract ablation, the RFA needle is heated to 80–100 °C, which can kill the cells and denature proteins [Citation3].
Our study has several limitations. First, the number of mice in each group might be small. Nevertheless, statistically significant differences were observed between groups with small numbers. Therefore, we were able to omit additional experimental sessions. Second, our experiment did not show the adherent cells on RFA needle can lead to tumor recurrence. Further preclinical researches might be necessary. However, such causality between adherent cells and tumor recurrence has been suggested in several prior clinical researches [Citation1–3].
In conclusion, the number of viable cancer cells adherent to the RFA needle tips was the highest in the RFA only group and the lowest in the RFA-TA group. These results indicate that additive tract ablation may be a very effective method to reduce tumor cell shedding in the needle tract. We strongly recommend tract ablation after radiofrequency ablation of liver tumors to reduce tract seeding. Further researches are necessary to develop the most efficient tract ablation method.
Acknowledgment
The authors would like to thank Mr. Myong Ki Jun for his kind support of radiofrequency ablation device and needles.
Disclosure statement
No potential conflict of interest was reported by the author(s).
Additional information
Funding
References
- Francica G. Needle track seeding after radiofrequency ablation for hepatocellular carcinoma: prevalence, impact, and management challenge. J Hepatocell Carcinoma. 2017;4:23–27.
- Stigliano R, Marelli L, Yu D, et al. Seeding following percutaneous diagnostic and therapeutic approaches for hepatocellular carcinoma. What is the risk and the outcome? Seeding risk for percutaneous approach of HCC. Cancer Treat Rev. 2007;33(5):437–447.
- Snoeren N, Jansen MC, Rijken AM, et al. Assessment of viable tumour tissue attached to needle applicators after local ablation of liver tumours. Dig Surg. 2009;26(1):56–62.
- Sofocleous CT, Klein KM, Hubbi B, et al. Histopathologic evaluation of tissue extracted on the radiofrequency probe after ablation of liver tumors: preliminary findings. AJR Am J Roentgenol. 2004;183(1):209–213.
- Ham SJ, Choi Y, Lee SI, et al. Enhanced efficacy of radiofrequency ablation for hepatocellular carcinoma using a novel vascular disrupting agent, CKD-516. Hepatol Int. 2017;11(5):446–451.
- Choe J, Kim KW, Kim YI, et al. Feasibility of a low-power radiofrequency ablation protocol to delay steam popping. J Vasc Interv Radiol. 2016;27(2):268–274.
- Weinberg BD, Krupka TM, Haaga JR, et al. Combination of sensitizing pretreatment and radiofrequency tumor ablation: evaluation in rat model. Radiology. 2008;246(3):796–803.
- Hines-Peralta A, Sukhatme V, Regan M, et al. Improved tumor destruction with arsenic trioxide and radiofrequency ablation in three animal models. Radiology. 2006;240(1):82–89.
- Virostko J, Jansen ED. Validation of bioluminescent imaging techniques. Methods Mol Biol. 2009;574:15–23.
- Bank HL. Rapid assessment of islet viability with acridine orange and propidium iodide. In Vitro Cell Dev Biol. 1988;24(4):266–273.
- Cadena-Herrera D, Esparza-De Lara JE, Ramirez-Ibanez ND, et al. Validation of three viable-cell counting methods: manual, semi-automated, and automated. Biotechnol Rep. 2015;7:9–16.
- Hussain H, Raj LS, Ahmad S, et al. Determination of cell viability using acridine orange/propidium iodide dual-spectrofluorometry assay. Cogent Food Agric. 2019;5(1):1–9.
- Llovet JM, Vilana R, Bru C, et al. Increased risk of tumor seeding after percutaneous radiofrequency ablation for single hepatocellular carcinoma. Hepatology. 2001;33(5):1124–1129.
- Livraghi T, Lazzaroni S, Meloni F, et al. Risk of tumour seeding after percutaneous radiofrequency ablation for hepatocellular carcinoma. Br J Surg. 2005;92(7):856–858.
- Poon RT, Ng KK, Lam CM, et al. Radiofrequency ablation for subcapsular hepatocellular carcinoma. Ann Surg Oncol. 2004;11(3):281–289.
- Francica G, Saviano A, De Sio I, et al. Long-term effectiveness of radiofrequency ablation for solitary small hepatocellular carcinoma: a retrospective analysis of 363 patients. Dig Liver Dis. 2013;45(4):336–341.
- Zhang N, Wang L, Chai ZT, et al. Incomplete radiofrequency ablation enhances invasiveness and metastasis of residual cancer of hepatocellular carcinoma cell HCCLM3 via activating β-catenin signaling. PloS One. 2014;9(12):e115949.
- Zhang N, Ma D, Wang L, et al. Insufficient radiofrequency ablation treated hepatocellular carcinoma cells promote metastasis by up-regulation ITGB3. J Cancer. 2017;8(18):3742–3754.
- Wang X, Deng Q, Feng K, et al. Insufficient radiofrequency ablation promotes hepatocellular carcinoma cell progression via autophagy and the CD133 feedback loop. Oncol Rep. 2018;40(1):241–251.
- Batchelor RH, Zhou M. Use of cellular glucose-6-phosphate dehydrogenase for cell quantitation: applications in cytotoxicity and apoptosis assays. Anal Biochem. 2004;329(1):35–42.
- Tung JK, Berglund K, Gutekunst C-A, et al. Bioluminescence imaging in live cells and animals. Neurophotonics. 2016;3(2):025001.