
Abstract
Objectives
To develop an effective nomogram and artificial neural network (ANN) model for predicting pleural effusion after percutaneous microwave ablation (MWA) in lung malignancy (LM) patients.
Methods
LM patients treated with MWA were randomly allocated to either the training cohort or the validation cohort (7:3). The predictors of pleural effusion identified by univariable and multivariable analyses in the training cohort were used to develop a nomogram and ANN model. The C-statistic was used to evaluate the predictive accuracy in both the training and validation cohorts.
Results
A total of 496 patients (training cohort: n = 357; validation cohort: n = 139) were enrolled in this study. The predictors selected into the nomogram for pleural effusion included the maximum power (hazard ratio [HR], 1.060; 95% confidence interval [CI], 1.022–1.100, p = 0.002), the number of pleural punctures (HR, 2.280; 95% CI, 1.103–4.722; p = 0.026) and the minimum distance from needle to pleura (HR, 0.840; 95% CI, 0.775–0.899; p < 0.001). The C-statistic showed good predictive performance in both cohorts, with a C-statistic of 0.866 (95% CI, 0.787–0.945) internally and 0.782 (95% CI, 0.644–0.920) externally (training cohort and validation cohort, respectively). The optimal cutoff value for the risk of pleural effusion was 0.16.
Conclusions
Maximum power, number of pleural punctures and minimum distance from needle to pleura were predictors of pleural effusion after MWA in LM patients. The nomogram and ANN model could effectively predict the risk of pleural effusion after MWA. Patients showing a high risk (>0.16) on the nomogram should be monitored for pleural effusion.
Introduction
Lung malignancy (LM), included primary lung cancer (PLC) and lung metastases, is one of the most severe cancers worldwide. PLC is reported to be the leading cause of cancer incidence and mortality in China and across the world [Citation1,Citation2]. Although surgery remains the first-line therapeutic strategy to improve survival, only 20–40% of LM patients are candidates for surgery [Citation3,Citation4]. In recent decades, thermal ablation has been reported to induce a zone of thermal coagulative necrosis encompassing the entire tumor and a surrounding safety margin, and it has been recommended as a primary therapeutic strategy and/or an adjuvant to other treatments for LM patients [Citation5–8]. Radiofrequency ablation (RFA) and microwave ablation (MWA) are the two most common types of thermal ablation. The latter is applied more frequently due to its advantages of a higher intra-tumoral temperature, a larger ablation zone, lower duration of ablation, and deeper penetration [Citation4].
Pleural effusion is one of the common complications after thermal ablation, with an incidence rate of 4–21% among patients treated with RFA [Citation9–12] and 2.9–21.7% among patients treated with MWA [Citation13,Citation14]. Although most patients with pleural effusion are asymptomatic, persistent pleural effusion might affect the resilience and recoil of the lung, leading to atelectasis, reduced ventilation, hypoxia, and even respiratory failure. Several studies have explored the predictors for pleural effusion after thermal ablation [Citation14–18]. However, these predictors are complex and nonlinear, and a pragmatic and reliable predictive model based on objective measurements is necessary for predicting the occurrence of pleural effusion. Nomograms are statistical models specifically designed to maximize predictive accuracy, which can provide prognostic information based on a combination of variables that allow for an individualized prediction of outcomes [Citation19]. In addition, as a computer technology that modeled on the biological neural systems structurally and functionally, artificial neural network (ANN) has been found to exceed conventional discrimination analysis. ANN can learn from observing data sets and complicated nonlinear relationships between input parameters and output parameters and can identify the importance of each variable for targeted events and make a prediction for the outcomes based on the existed variables [Citation20,Citation21]. However, as far as we know, few studies have focused on the risk prediction of pleural effusion using the above models.
Therefore, a retrospective study was conducted to develop an effective nomogram and ANN model for predicting pleural effusion after MWA in LM patients.
Methods
Patient criteria
This single-center retrospective study included all consecutive LM patients who underwent thermal ablation at this institution. The institutional ethics review board approved this study. The study protocol was conducted in accordance with the Declaration of Helsinki. The informed consent was waived owing to the retrospective nature of this study. Confirmed or suspected LM patients treated with thermal ablation between September 2016 and July 2020 at this institution were screened and were randomly allocated to either the training cohort or the validation cohort at a ratio of 7:3. The inclusion criteria for this study were as follows: (a) age older than 18 years; (b) confirmed or suspected LM patients treated with MWA, and (c) previous or current histopathological examinations confirming the diagnosis of the malignancy. The exclusion criteria were as follows: (a) LM patients treated with RFA; (b) without previous and current histopathological examinations; (c) benign lesions according to the histopathological examinations of synchronous biopsy, (d) other concomitant therapies performed during the MWA procedure, such as the implantation of radioactive seeds; (e) the presence of pleural effusion before MWA, and (f) incomplete data.
Pre-MWA management
All patients with LM underwent chest CT and/or contrasted-enhanced CT (GE Healthcare) before the MWA procedure to evaluate the location, quantity and size of tumors. PET/CT was performed on-demand to evaluate the lymph node and distant metastases. All laboratory examinations were conducted 1–4 days before MWA. The detection of pleural effusion was based on axial computed tomography (CT) scanning, with CT classification according to the quartile of the thorax and the greatest depth of pleural effusion [Citation22]. Pleural effusion was classified as mild if it presented with the greatest depth from the pleura to fluid level <25% of the thorax, moderate if it presented with the greatest depth between 25% and 50% of the thorax, and large if it presented with the greatest depth ≥50% of the thorax. The PLC tumor stage was identified via the clinical TNM staging system of the Union for International Cancer Control (8th edition) [Citation23]. The tumor stage was identified as IV for lung metastases patients.
MWA procedure and follow-up
The MWA indications and procedures followed the guidelines of the Cardiovascular and Interventional Radiology Society of Europe [Citation24] and were performed by several experienced interventional radiologists. An MTC-3C MWA system (Vison Medicine, Nanjing, China) or an ECO-100A1 MWA system (ECO Medical Instrument, Nanjing, China) were used, with a microwave emission frequency of 2450 ± 50 MHz and an adjustable continuous-wave output power of 20–80 W. A thermocouple was applied to monitor the temperature to prevent damage to adjacent organs. The MWA needles (Vison Medicine or ECO Medical Instrument) were 10–18 cm in effective length and 15–17 G in outside diameter according to the tumor location and distance to the pleura, with a 15 mm active tip. Pre-procedural CT was performed to inform the treatment plan to clarify the suitable position, puncture site location, optimal puncture trajectory, and a number of MWA needles. Local anesthesia or intravenous anesthesia were performed as needed. Needles were introduced into the planned site, and the position was confirmed by CT. Subsequently, MWA was performed at the planned power and duration, with adjustments being carried out as needed. The procedure was terminated when the ablation zone presented a 5–10mm rim beyond the lesion boundary. Finally, a repeat chest CT scan was performed to evaluate the ablation zone and detect possible complications. For patients with suspected malignant lesions but without a histopathological examination, synchronous coaxial-cannula biopsy and MWA were performed to obtain the histopathological results and treat the lesions. A 15 G coaxial introducer needle (Argon Medical Devices, Texas, American) was first advanced into the tumor, and then the stylet was replaced by a 16 G full-core biopsy needle (Argon Medical Devices) through the cannula. The biopsy was performed for histopathological examination. A 17 G MWA needle (Vison Medicine or ECO Medical Instrument) was introduced into the tumor through the cannula [Citation25]. Catheter drainage was performed for patients with moderate or large pleural effusion and was removed when drainage disappeared. Short-term follow-up with CT reexamination was conducted 1–5 days after MWA during hospitalization, while the long-term follow-up was performed 3–4 weeks after MWA in an outpatient visit.
Statistical analysis
Categorical variables are described as frequencies and percentages, and continuous variables are described as the mean ± SDs. Statistical analyses were performed using SPSS 25.0 for Windows (IBM, Somers, NY). The data of the two cohorts were compared by Student’s t-test or the Mann–Whitney U test for continuous variables and by Chi-square test for categorical variables. The possible predictors for pleural effusion were analyzed by univariable logistic regression analyses in the training cohort, including 24 parameters on fundamental information, treatment history, ablation factors and radiological features. Variables with p < 0.05 in the univariable analyses were entered as candidate variables into the multivariable logistic regression analyses. Model discrimination was assessed using C-statistic. A p < 0.05 was considered to indicate statistical significance in the multivariable analyses.
The establishment of the nomogram and ANN were based on the results of multivariable logistic regression analyses of the training cohort. The nomogram was constructed with the regression modeling strategies package in R (Version 3.0.2; R Project for Statistical Computing; www.r-project.org). After establishing the predictive nomogram, C-statistic and the receiver operating characteristic (ROC) curve were used to validate the accuracy and discriminative capacity of the nomogram both internally (training cohort) and externally (validation cohort). The C-statistic was calculated as the area under the ROC curve and used to evaluate the predictive ability of the risk model. As reported previously [Citation26], an ANN model was established to compare the importance of variables for pleural effusion by using SPSS 25.0 statistical software. For the establishment of the ANN, two-thirds of the patients in the training cohort were randomly selected to build the model, and the remaining one-third was used for cross-validation. This cross-validation helps to maintain the stability and practicality of the ANN model and to prevent overtraining, which might lead to good performance on a training set. In this study, a three-layer feedforward ANN was developed, including input nodes, a hidden layer, and output nodes. The backpropagation of error was used for learning. The network included an input layer, an output layer, and hidden layers. The ANN model learned to associate each input with the corresponding output by modifying the weight of the connections. A decrease in the minimum error between the ANN output and the desired output was reached as learning proceeds. The predictive accuracy was evaluated by the area under the ROC curve. The optimum cutoff value for clinical use was determined by maximizing the Youden index (sensitivity + specificity − 1).
Results
Patient characteristics and management of pleural effusion
A total of 496 LM patients (357 in the training cohort and 139 in the validation cohort; ) who underwent 549 MWA procedures with a mean follow-up of 3.8 ± 2.4 months were enrolled in this study, comprised of 299 (60.3%) males and 197 (39.7%) females. Detailed demographic characteristics are presented in . A total of 46 (9.3%) patients developed pleural effusion after MWA, with a mean time of 3.0 ± 3.2 days from MWA to the appearance of pleural effusion. Of these, 30 (6.0%) patients had mild, 6 (1.2%) had moderate, and 10 (2.0%) patients had large pleural effusion. For the management of pleural effusion, 16 (34.8%, 16/46) patients underwent catheter drainage, while 30 (65.2%, 30/46) patients were kept under observation without catheter drainage. The mean time to catheter removal was 8.8 ± 8.4 days. All patients recovered from pleural effusion.
Figure 1. Patients selection flowchart. RFA: radiofrequency ablation; MWA: microwave ablation.
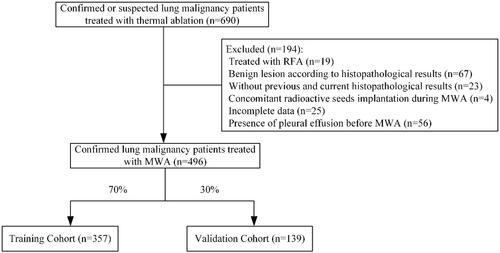
Table 1. Clinical characteristics of lung malignancy patients treated with MWA.
Predictors of pleural effusion in the training cohort
The results of univariable and multivariable logistic regression analyses for pleural effusion are presented in and , respectively. The predictors of pleural effusion after MWA were maximum power (hazard ratio [HR], 1.060; 95% confidence interval [CI], 1.022–1.100; p = 0.002), number of pleural punctures (HR, 2.280; 95% CI, 1.103–4.722; p = 0.026) and minimum distance from needle to pleura (HR, 0.840; 95% CI, 0.775–0.899; p < 0.001).
Table 2. Univariable logistic regression analyses for pleural effusion after MWA in the training cohort.
Table 3. Multivariable logistic regression analyses for pleural effusion after MWA in the training cohort.
Development and validation of the nomogram and ANN
Based on the above three predictors, a nomogram was developed to make early predictions of pleural effusion after MWA (). Based on this nomogram, the total score for each patient was calculated according to the characteristics before and/or during MWA, to predict the occurrence of pleural effusion with risk percentages. According to the internal validation in the training cohort, the C-statistic of this nomogram was 0.866 (95% CI, 0.787–0.945; ), while the index of external validation in the validation cohort was 0.782 (95% CI, 0.644–0.920; ). An ANN model was established based on the results of univariate analyses and multivariate logistic regression analyses. The importance of each predictor is shown in . According to the ANN model, the number of pleural punctures was the predominant predictor of pleural effusion ().
Figure 2. Nomogram for predicting pleural effusion after MWA. To use the nomogram, an individual patient’s value is located on each variable axis, and a line is drawn upward to determine the number of points received for each variable value. The sum of these numbers is located on the Total Point axis, and a line is drawn downward to the risk axes to determine the likelihood of pleural effusion.
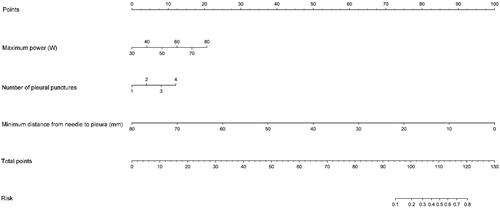
Figure 3. Receiver operating characteristic curve analyses for the nomogram in internal and external validation. The diagonal red line indicates that the index of AUC was 0.5, which was a reference value. C-statistic was calculated as the area between the ROC curve (blue curve) and horizontal axis. (a) The area under the curve (C-statistic) was 0.866 (95% CI, 0.787–0.945) in the training cohort for predicting pleural effusion. (b) The area under the curve (C-statistic) was 0.782 (95% CI, 0.644–0.920) in the validation cohort for predicting pleural effusion.
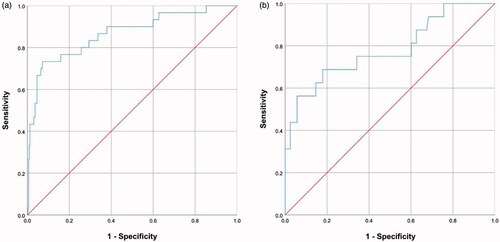
Figure 4. Schematic representation and the importance of each variable in the artificial neural network (ANN) model. (a) The presentation of the ANN model to predict pleural effusion after MWA in LM patients. (b) The importance of each predictor in the ANN model.
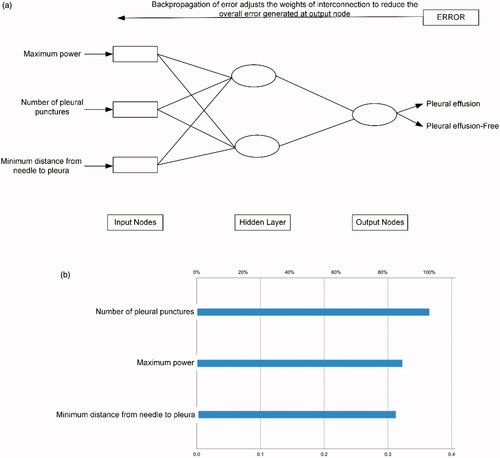
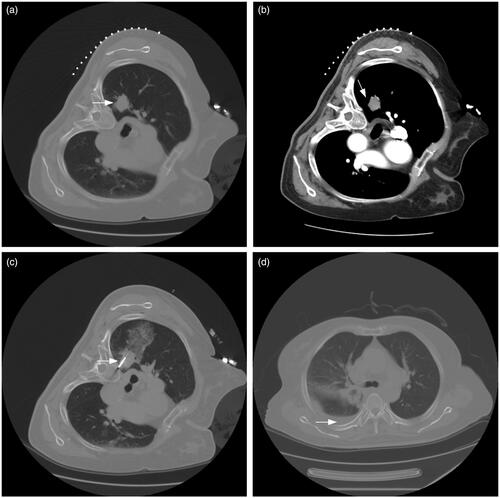
Figure 5. A typical case. (a, b) A patient with suspected NSCLC was admitted. The pre-MWA CT scan revealed the location and size of the lesion (white arrow). (c) Synchronous coaxial-cannula biopsy and MWA were performed, with 40 W of energy released. The minimum distance from needle to pleura was within 5 mm (white arrow). The total points for pleural effusion on the nomogram were approximately 102 points. The estimated risk of pleural effusion after MWA was approximately 0.21 for this patient, which indicated a high risk of pleural effusion and was monitored by radiological reexamination. (d) The histopathological result proved the diagnosis of adenocarcinoma after the synchronous biopsy. The CT reexamination was performed 4 days after MWA, and pleural effusion was detected (white arrow).
The developed nomogram in clinical practice
According to the maximized Youden index, the optimal cutoff value for the risk of pleural effusion was 0.16. Patients with a predictive risk >0.16 according to the nomogram had a high risk of pleural effusion (). The sensitivity, specificity, positive predictive value, and negative predictive value of using this cutoff value in the training cohort and validation cohort are presented in .
Table 4. Diagnostic efficacy of the nomogram for pleural effusion after MWA.
Discussion
Previous studies have identified multiple predictors to significantly correlated with pleural effusion after thermal ablation, including high pleural temperature, the distance between the electrode and pleura, lung length between the electrode and pleura, the distance between the tumor and pleura, etc. [Citation14–18]. Although the correlation is complex and nonlinear, it is possible to use predictors related to MWA to predict the risk of pleural effusion. As far as we know, this is the first nomogram and ANN model for predicting the risk of pleural effusion after MWA in LM patients.
Thermal damage to the pleura might increase the risk of pleural events, with the pleura losing resilience and its ability to repair the pleural opening, potentially inducing pleurisy and accompanied by pleural effusion. The maximum temperature in the lung parenchyma adjacent to MWA can reach 150 °C. It has been reported that the lung parenchyma is relatively unaffected by microwave energy and increased tissue impedance during MWA [Citation27]. Although it is believed that the ablation energy delivered is critical for the size of the ablation zone, the energy applied in the MWA procedure usually ranges from 20 to 80 W in LM patients [Citation13,Citation14]. Several studies have attempted high-energy MWA in LM patients and found that it can achieve larger ablation margins, an ideal sphere, and less local progression than low-energy MWA, with maximum power up to 180 W and no cases of pleural effusion [Citation28–30]. Kodama et al. [Citation31] performed high power (100 W) MWA in the normal swine lung parenchyma and found that a longer duration of high-power energy delivery can create larger spherical ablations without significant differences in post-MWA complications compared to a shorter duration of energy delivery. Moreover, as far as we know, few studies have indicated the potential correlation between the maximum power and the risk of pleural effusion. In this study, the maximum power during MWA procedures was up to 80 W, 242 (48.8%, 242/496) patients received a maximum power ≥60 W, and 35 (14.5%, 35/242) patients developed pleural effusion after MWA, which demonstrated that the maximum power was a significant predictor of pleural effusion. The potential mechanism is that the higher microwave energy transmitted to the lung parenchyma might have caused elevated pleural temperature and increased the risk of pleurisy. Moreover, the mean minimum distance to pleura for tumors was 1.0 ± 1.1 cm, which indicates a set of tumors adjacent to the pleura and facilitated microwave energy transmission to the pleura.
The distance from the tumor to the pleura has been identified as a predictor for pleural effusion [Citation14–16]. Prud’Homme et al. [Citation32] performed MWA for 1, 2 and 3 cm sized tumor lesions in swine and found that the mean maximal ablation diameters were 3.6, 4.1 and 4.8 cm, respectively. This indicates a risk of energy transmission and pleural involvements in patients with ablated tumors adjacent to the pleura. Zheng et al. [Citation14] analyzed 42 major complications in 204 LM patients treated with MWA and found 6 (2.9%) cases of pleural effusion requiring catheter drainage, which were associated with a distance of less than 1 cm between the tumor and pleura. Moreover, another study with 21 major complications revealed four (5.7%) cases of large pleural effusion requiring catheter drainage and identified that major complications were more likely to occur when the tumor was located within 7 mm from the pleura [Citation16]. In 2008, Tajiri et al. [Citation12] compared two groups of LM patients with the highest pleural temperatures of <40 °C and ≥40 °C during the RFA procedures and found that the overall incidence of pneumothorax and pleural effusion was 56% and 20%, respectively. The incidence of pleural effusion was significantly higher in the group with the highest pleural temperatures of ≥40 °C than in the other group. The predictors significantly affecting pleural temperature included the distance between the electrode and pleura and the length of lung parenchyma between electrode and pleura. At this institution, MWA systems have a thermocouple to monitor the temperature of MWA needles, one of which can terminate the ablation automatically when the temperature in the pleural puncture sites reaches above 40 °C. The mean minimum distance to pleura and the minimum distance from needle to pleura were 1.0 ± 1.1 cm and 22.7 ± 12.1 mm, respectively. Although the former revealed an adequate correlation with pleural effusion in univariable analyses, the relative importance was lower than that of the latter in multivariable analyses.
A previous study revealed that the number of punctures was a significant risk factor for aseptic pleuritis [Citation17], which might increase the risk of pleural effusion. Similarly, the number of pleural punctures was identified as a significant predictor of pleural effusion in this study. The needle creates a large pleural hole in the MWA procedure; these pleural holes might get further enlarged by respiratory-induced lung motion. An increased number of pleural punctures can lead to an increased number of pleural holes and their enlargement, thereby increasing the risk of exudation and pleural effusion. Wang et al. [Citation25] attempted synchronous coaxial-cannula biopsy and MWA to reduce the number of pleural punctures and found that the risk of pneumothorax was significantly reduced. In this study, 148 (29.8%) patients underwent synchronous coaxial-cannula biopsy and MWA, and a lower risk of pleural effusion was seen in these patients.
However, some variables were not analyzed as predictors of pleural effusion or were not selected for the nomogram. Emphysema is reported to be associated with an increased risk of both pneumothorax and pleural effusion [Citation14,Citation18]. Although a possible correlation between emphysema and pleural effusion was revealed in this study, emphysema was likely to be more related to pneumothorax. In addition, previous chemotherapy has been reported as a risk factor for aseptic pleuritis [Citation17]. Immunosuppression induced by chemotherapy might induce pleuritis. However, this trend was not seen in LM patients with previous chemotherapy. In general, the patients with pleural effusion after MWA were asymptomatic, and 16 (3.2%) patients received catheter drainage in this study, which was comparable to the reported rates of 2.8–10% [Citation10,Citation14,Citation33].
Based on the results of univariable and multivariable analyses, a predictive nomogram and ANN were established to predict pleural effusion after MWA. The data from the training cohort as internal validation and data from the validation cohort as external validation were used to validate the accuracy of this nomogram. The C-statistic values provided sufficient predictive accuracy in both cohorts, which indicated the high accuracy of the nomogram. The designed three-layer feedforward ANN showed a good prediction performance with a sensitivity of 73.3%. Compared to conventional regression methods, ANN did not require a predefined mathematical relationship between the dependent and independent variables and could model any arbitrarily complicated nonlinear relationship. These advantages enable ANN to be a useful tool in solving the complex challenge of prediction. However, this study has several limitations. First, this was a retrospective study; thus, patient selection bias may exist. Second, although a validation cohort was established and showed high accuracy for predictive performance, external validation from other datasets is warranted. Third, the pleural temperature adjacent to the needle tip and the power released by the active tip was not measured. Finally, although the estimated volume of pleural effusion was according to the CT classification, the exact volume was not calculated.
In conclusion, the maximum power, the number of pleural punctures and the minimum distance from needle to pleura were predictors of pleural effusion after MWA in LM patients. The nomogram and ANN model could effectively predict the risk of pleural effusion after MWA. Patients showing a high risk (>0.16) on the nomogram should be monitored for the occurrence of pleural effusion.
Acknowledgment
The authors thank Xin Huang, MS, for his assistance in protocol review and statistical analyses.
Disclosure statement
No potential conflict of interest was reported by the author(s).
Additional information
Funding
References
- Bray F, Ferlay J, Soerjomataram I, et al. Global cancer statistics 2018: GLOBOCAN estimates of incidence and mortality worldwide for 36 cancers in 185 countries. CA Cancer J Clin. 2018;68(6):394–424.
- Chen W, Zheng R, Baade PD, et al. Cancer statistics in China, 2015. CA Cancer J Clin. 2016;66(2):115–132.
- Mazzone P. Preoperative evaluation of the lung resection candidate. Cleveland Clin J Med. 2012;79(5):S17–S22.
- Liu H, Steinke K. High-powered percutaneous microwave ablation of stage I medically inoperable non-small cell lung cancer: a preliminary study. J Med Imaging Radiat Oncol. 2013;57(4):466–474.
- Quirk MT, Lee S, Murali N, et al. Alternatives to surgery for early-stage non-small cell lung cancer: thermal ablation. Clin Chest Med. 2020;41(2):197–210.
- Iezzi R, Cioni R, Basile D, et al. Standardizing percutaneous microwave ablation in the treatment of lung tumors: a prospective multicenter trial (MALT study). Eur Radiol. 2020. DOI:https://doi.org/10.1007/s00330-020-07299-2. Online ahead of print.
- Postmus PE, Kerr KM, Oudkerk M, et al. Early and locally advanced non-small-cell lung cancer (NSCLC): ESMO clinical practice guidelines for diagnosis, treatment and follow-up. Ann Oncol. 2017;28(4):v1–v21.
- Donington J, Ferguson M, Mazzone P, et al. American College of Chest Physicians and Society of Thoracic Surgeons consensus statement for evaluation and management for high-risk patients with stage I non-small cell lung cancer. Chest. 2012;142(6):1620–1635.
- Lanuti M, Sharma A, Digumarthy SR, et al. Radiofrequency ablation for treatment of medically inoperable stage I non-small cell lung cancer. J Thorac Cardiovasc Surg. 2009;137(1):160–166.
- Hiraki T, Tajiri N, Mimura H, et al. Pneumothorax, pleural effusion, and chest tube placement after radiofrequency ablation of lung tumors: incidence and risk factors. Radiology. 2006;241(1):275–283.
- Okuma T, Matsuoka T, Yamamoto A, et al. Frequency and risk factors of various complications after computed tomography-guided radiofrequency ablation of lung tumors. Cardiovasc Intervent Radiol. 2008;31(1):122–130.
- Nomura M, Yamakado K, Nomoto Y, et al. Complications after lung radiofrequency ablation: risk factors for lung inflammation. BJR. 2008;81(963):244–249.
- Wolf FJ, Grand DJ, Machan JT, et al. Microwave ablation of lung malignancies: effectiveness, CT findings, and safety in 50 patients. Radiology. 2008;247(3):871–879.
- Zheng A, Wang X, Yang X, et al. Major complications after lung microwave ablation: a single-center experience on 204 sessions. Ann Thorac Surg. 2014;98(1):243–248.
- Tajiri N, Hiraki T, Mimura H, et al. Measurement of pleural temperature during radiofrequency ablation of lung tumors to investigate its relationship to occurrence of pneumothorax or pleural effusion. Cardiovasc Intervent Radiol. 2008;31(3):581–586.
- Splatt AM, Steinke K. Major complications of high-energy microwave ablation for percutaneous CT-guided treatment of lung malignancies: single-centre experience after 4 years. J Med Imaging Radiat Oncol. 2015;59(5):609–616.
- Kashima M, Yamakado K, Takaki H, et al. Complications after 1000 lung radiofrequency ablation sessions in 420 patients: a single center’s experiences. AJR Am J Roentgenol. 2011;197(4):W576–W580.
- Hiraki T, Gobara H, Fujiwara H, et al. Lung cancer ablation: complications. Semin Intervent Radiol. 2013;30(02):169–175.
- Bochner BH, Kattan MW, Vora KC. Postoperative nomogram predicting risk of recurrence after radical cystectomy for bladder cancer. J Clin Oncol. 2006;24(24):3967–3972.
- Cross SS, Harrison RF, Kennedy RL. Introduction to neural networks. Lancet. 1995;346(8982):1075–1079.
- Baxt WG. Application of artificial neural networks to clinical medicine. Lancet. 1995;346(8983):1135–1138.
- Song SG, Hur YH, Cho JY, et al. Pleural effusion after hepatic radiofrequency ablation with artificial ascites: clinical spectrum and significance. J Vasc Interv Radiol. 2020;31(10):1636–1644.
- Lim W, Ridge CA, Nicholson AG, et al. The 8th lung cancer TNM classification and clinical staging system: review of the changes and clinical implications. Quant Imaging Med Surg. 2018;8(7):709–718.
- Venturini M, Cariati M, Marra P, et al. CIRSE standards of practice on thermal ablation of primary and secondary lung tumours. Cardiovasc Intervent Radiol. 2020;43(5):667–683.
- Wang D, Li B, Bie Z, et al. Synchronous core-needle biopsy and microwave ablation for highly suspicious malignant pulmonary nodule via a coaxial cannula. J Cancer Res Ther. 2019;15(7):1484–1489.
- Xu S, Guan LJ, Shi BQ, et al. Recurrent hemoptysis after bronchial artery embolization: prediction using a nomogram and artificial neural network model. AJR Am J Roentgenol. 2020;215:1490–1498.
- Hinshaw JL, Lubner MG, Ziemlewicz TJ, et al. Percutaneous tumor ablation tools: microwave, radiofrequency, or cryoablation-what should you use and why? Radiographics. 2014;34(5):1344–1362.
- Egashira Y, Singh S, Bandula S, et al. Percutaneous high-energy microwave ablation for the treatment of pulmonary tumors: a retrospective single-center experience. J Vasc Interv Radiol. 2016;27(4):474–479.
- Vogl TJ, Roman A, Nour-Eldin NA, et al. A comparison between 915 MHz and 2450 MHz microwave ablation systems for the treatment of small diameter lung metastases. Diagn Interv Radiol. 2018;24(1):31–37.
- Vogl TJ, Basten LM, Nour-Eldin NA, et al. Microwave ablation (MWA) of pulmonary neoplasms: clinical performance of high-frequency MWA with spatial energy control versus conventional low-frequency MWA. Am J Roentgenol. 2019;213(6):1388–1396.
- Kodama H, Ueshima E, Gao S, et al. High power microwave ablation of normal swine lung: impact of duration of energy delivery on adverse event and heat sink effects. Int J Hyperthermia. 2018;34(8):1186–1193.
- Prud’homme C, Teriitehau C, Adam J, et al. Lung microwave ablation - an in vivo swine tumor model experiment to evaluate ablation zones. Int J Hyperthermia. 2020;37(1):879–886.
- Han X, Yang X, Huang G, et al. Safety and clinical outcomes of computed tomography-guided percutaneous microwave ablation in patients aged 80 years and older with early-stage non-small cell lung cancer: a multicenter retrospective study. Thorac Cancer. 2019;10(12):2236–2242.