
 ?Mathematical formulae have been encoded as MathML and are displayed in this HTML version using MathJax in order to improve their display. Uncheck the box to turn MathJax off. This feature requires Javascript. Click on a formula to zoom.
Abstract
Purpose
To examine the ablation zone, muscle contractions, and temperature increases in both rabbit liver and kidney models in vivo for a custom-made high-frequency irreversible electroporation (H-FIRE) generator.
Materials and Methods
A total of 18 New Zealand white rabbits were used to investigate five H-FIRE protocols (n = 3 for each protocol) and an IRE protocol (n = 3) for the performance of the designed H-FIRE device in both liver and kidney tissues. The ablation zone was determined by using histological analysis 72 h after treatment. The extent of muscle contractions and temperature change during the application of pulse energy were measured by a commercial accelerometer attached to animals and fiber optic temperature probe inserted into organs with IRE electrodes, respectively.
Results
All H-FIRE protocols were able to generate visible ablation zones without muscle contractions, for both liver and kidney tissues. The area of ablation zone generated in H-FIRE pulse protocols (e.g., 0.3–1 μs, 2000 V, and 90–195 bursts) appears similar to that of IRE protocol (100 μs, 1000 V, and 90 pulses) in both liver and kidney tissues. No significant temperature increase was noticed except for the protocol with the highest pulse energy (e.g., 1 μs, 2000 V, and 180 bursts).
Conclusion
Our work serves to complement the current H-FIRE pulse waveforms, which can be optimized to significantly improve the quality of ablation zone in terms of precision for liver and kidney tumors in clinical setting.
1. Introduction
High-frequency irreversible electroporation (H-FIRE) has been widely investigated to be an alternative to the conventional irreversible electroporation (IRE) because of its ability to avoid or reduce neuro and muscle contractions during the administration of bipolar electric pulses. Conventional IRE protocols deliver a series of 50–100 μs monopolar square pulses, and a common protocol in use clinically involves 90 pulses with each having a width of 100 μs, delivered at the frequency of around 1 Hz [Citation1,Citation2]. H-FIRE replaces the 100-μs pulses in IRE with the bursts of bipolar pulses with much smaller pulse widths (0.25–50 μs). To simplify the discussion of the H-FIRE pulse waveforms in this paper, we have adopted the notion P-D-N mentioned in Sano et al. [Citation3], where P, D, and N are the positive pulse width, pulse delay, and negative pulse width, respectively, and they are all measured in microseconds.
Miklavcic et al. [Citation4] first showed that muscular contractions can be reduced by increasing the frequency of electric pulses above the frequency of tetanic contraction, while maintaining the antitumor efficacy in an in vivo rat model study. Using eight 100-μs unipolar pulses at a frequency of 5 kHz, they resulted in a single contraction instead of 8. However, this approach had the potential to generate significant temperature increases when more pulses are delivered, like the 90 pulses used clinically. The notion of H-FIRE was proposed by Arena et al. [Citation5]; they used a burst of high-frequency and bipolar pulses (P-D-N: 2-0-2 or 2-2-2) to replace the single monopolar pulse in IRE. They demonstrated that the H-FIRE pulse waveforms at 4000 V/cm did not cause muscle contractions in a rat model, nor did they cause a significant temperature increase. Since then, much work has been done to further explore the use of H-FIRE with various pulse waveforms by computational [Citation3,Citation5], in vitro [Citation6–8], ex vivo [Citation9–11], and in vivo [Citation12–15] studies. Sano et al. [Citation6] looked at the use of H-FIRE pulse waveforms with a sub-microsecond pulse width (i.e., 0.25-2-0.25 and 0.5-2-0.5) in a pancreatic tumor cell in vitro cell suspension model and showed this modality was effective at causing cell death. and Ivey et al. [Citation16] (i.e., 0.5-2-0.5) using a similar treatment protocol were able to demonstrate a visible ablation zone in a 3 D collagen glioma stem cell model, respectively at high electric field strengths (e.g., 4000 V/cm). Dong et al. in a first in human trial of H-FIRE prostate cancer [Citation17] demonstrated the effectiveness of H-FIRE (250 pulse bursts with a pulse waveform of 5-10-5).
The studies cited above established the proof-of-concept that H-FIRE can generate an ablation zone without causing muscle contractions nor significant temperature increase. Other than the work by DeWitt et al. [Citation18] using 0.5-2-0.5 in porcine liver tissues, few in vivo studies on H-FIRE with a sub-microsecond pulse width can be found in literature.
However, we believe that the sub-microsecond H-FIRE pulse waveforms are worthy of further in vivo study that measures muscle contractions and temperature, due to 1) the unique ablation characteristics of the sub-microsecond H-FIRE and 2) more in vivo results that can enrich the current H-FIRE protocols, especially for the precision ablation of tumors. Previous studies [Citation19,Citation20] have shown that sub-microsecond H-FIRE is effective at the electroporation of intracellular structures, all the while preserving the integrity of the outer cell membrane. Further study into the mechanism and cascade of cell death that occurs when intracellular structures are electroporated is warranted. On the other hand, more in vivo results with sub-microsecond H-FIRE will be helpful to enrich the current protocols and improve the precision of the local ablation of tumors. Using an in vivo rabbit model, we constructed a custom-made H-FIRE pulse generator (including sub-microsecond pulse waveforms) where the various parameters can be closely controlled. We hope to evaluate muscle contractions, and temperature increases in both liver and kidney tissues. Information obtained from this in vivo study in an animal model should provide information someday be useful in the clinical setting [Citation21].
2. Materials and methods
2.1. Custom-made H-FIRE
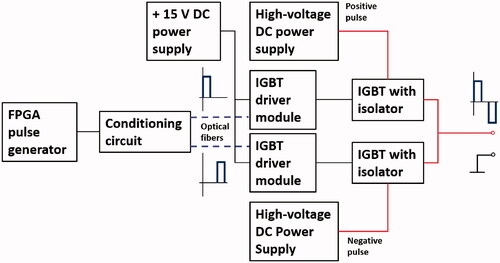
To study H-FIRE in-depth, we designed and fabricated a custom-made H-FIRE pulse generator that can deliver up to 3000-V bipolar pulses with a pulse width of 0.3–1 μs and a pulse delay of 1–100 μs. The bipolar pulses were generated using two commercially available insulated-gate bipolar transistors (IGBTs) (T0140QC33G, IXYS Corporation, CA, USA) as the electronic switches, as shown in . A controllable square pulse signal was generated by a commercially available field-programmable gate array (FPGA) (Cyclone 10 LP, Intel Corporation, CA, USA). By a designed conditioning circuit, the two pulse signals with a controllable time delay were transmitted to IGBT driver modules through optical fibers to activate the IGBTs. Two regulated high-voltage DC power supplies (136 XR Series, MAGNA-POWER Electronics, Inc., NJ, USA) were used to maintain a sufficient level of charge to deliver 3000 V over a 200 μs burst in a bipolar fashion.
Figure 1. Schematic of the custom-made H-FIRE pulse generator.
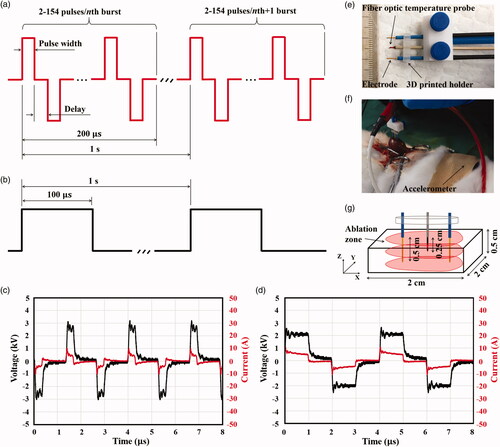
Each pulse burst was fixed at a width of 200 μs, and our device can output 2–154 pulses per pulse burst, depending on the pulse duration and pulse delay as shown in . The frequency of pulse burst was fixed at 1 Hz, as shown in . The first step in our current study was to validate the ablation performance of the designed pulse generator, and to do this, we performed an in vivo experimental study on different tissues using a rabbit model. As shown in , a conventional IRE pulse waveform with a pulse width of 100 μs and a frequency of 1 Hz was used in the study to demonstrate the performance of the custom-made H-FIRE pulse generator on ablation zone generation, muscle contractions, and temperature in both liver and kidney tissues. The conventional IRE protocol resulted in strong muscle contractions even with a much lower electric voltage. show the two representative voltage and current pulse waveforms of our H-FIRE device for the pulse waveform of 0.3-1-0.3 at 2500 V and 1-1-1 at 2000 V, respectively.
Figure 2. In vivo experimental setup: (a) designed H-FIRE pulses, (b) conventional IRE pulses, (c) H-FIRE voltage and current pulses for 0.3-1-0.3 at 2500 V, (d) for 1-1-1 at 2000 V, (e) electrode configuration, including a fiber optic temperature probe, (f) experimental H-FIRE or IRE ablation set up, including an accelerometer, and (g) harvested tissue cube with the ablation area.
2.2. Ablation protocols
To characterize the performance of the custom-made H-FIRE pulse generator, six ablation protocols were selected, as shown in . For the same pulse width, protocols with different pulse voltages were designed to investigate the performance of the designed H-FIRE on the change of pulse voltages, like P1 and P2, P4 and P5. Similarly, to study the impact of pulse width on the ablation performance, P1 and P3 were designed with the similar energized time ( pulses per burst
number of bursts
pulse width) and the same pulse voltage (i.e., 2000 V). Protocols with the same pulse width and pulse voltage were also examined at different energized times, such as P3 and P5. All the designed H-FIRE pulse waveforms (P1-P5) were also compared to the conventional IRE pulse waveform (i.e., P6) for studying the ablation performance. All protocols were also examined the electric dose (pulse voltage squared
energized time in second) for thermal damage. In the current study, the ablation zone, muscle contraction, and temperature increase were measured for each ablation protocol.
Table 1. Ablation protocols evaluated in the current study.
2.3. In vivo experiments
All in vivo experiments were performed at the Shanghai Jambo Biological Technology Laboratory with the approval for these trials from the Institution of Shanghai Science and Technology Commission. All operations were in accordance with the general guidelines for animal use issued by the Institute of Zoology, Chinese Academy of Science. A total of 18 New Zealand white rabbits (2.43 0.27 kg) were included in the current study. Nine of them were selected randomly for the in vivo experiment with the liver tissues and the remaining nine rabbits were used for the kidney tissues. Animals were anesthetized with a mixed solution of 0.15–0.2 ml/kg Zoletil 50 and Lumianning with the ratio of 5:2 about 15 min before the application of the designed H-FIRE or IRE protocols. The abdomen was opened via a midline laparotomy after confirmation of general anesthesia. Two larger liver lobes of each animal in the liver group were selected regardless of anatomical division to be treated with the designed H-FIRE or IRE protocols. In the kidney group, both the right and left kidneys were treated. Only one ablation protocol was performed per liver lobe or kidney, with the result being that each animal received two different ablation protocols.
H-FIRE and IRE protocols were performed in vivo using the above-mentioned custom-made H-FIRE pulse generator and a commercial IRE pulse generator (BTX ECM 830, Harvard Apparatus, Holliston, MA, USA), respectively. Two monopolar electrodes, each with a diameter of 0.5 mm (Genetrode, 508, Harvard Apparatus, Holliston, MA, USA) were held parallel and 1 cm apart using a 3 D printed holder, as shown in . The electrodes were then inserted into the liver or kidney tissues perpendicularly to the surface of the organ at an insertion depth of 0.5 cm, as shown in . This insertion depth was sufficient to generate an ablation result in the both the liver and kidney parenchyma even though a deeper insertion would generally be used clinically. The electrodes were inserted away from other vital organs, like bile ducts or large blood vessels, so as to minimize mechanical trauma.
The temperature at the central point between the two electrodes was monitored during the treatment using a fiber optic temperature probe () inserted at a depth of 2.5 mm at the midpoint between the two electrodes. The probe was connected to a custom-made temperature measurement system (Indigo Precision, Suzhou, China) and temperature was recorded at a frequency of 30 Hz to be analyzed for temperature increases. As shown in , a commercial accelerometer (BWT901CL, WitMotion Shenzhen Co., Ltd, Shenzhen, China) was attached to the flank of the animal to measure the muscle contraction intensity in the liver and kidney groups, respectively. The muscle contraction data was recorded in the embedded memory card of the accelerometer and then was analyzed for muscle contractions.
After the application of the designed H-FIRE or IRE protocols, the treated organs were place back in their anatomical position and the incision was closed with silk sutures. After recovery from anesthesia, the treated animals were housed individually in ventilated cages with the access to food and water ad libitum and maintained in a room with the ambient temperature of 22–24 and humidity of 60–70%. To avoid postoperative infection, 0.5 ml benzylpenicillin sodium solution was also injected muscularly into each treated animal. Animals were euthanized at 72 h by overdose injection as per local protocols and organs were removed immediately after. No animals died before the day of organ removal. As shown in , the tissue including the ablation zone was carefully cut into a cube with a dimension of approximately 2
2
0.5
and then was sliced perpendicularly to the direction of Z-axis by a scalpel for histological analysis by standard hematoxylin and eosin (H&E) staining. The ablation zone was then calculated by a commercial H&E slide reader software (CaseViewer, 3DHISTECH, Budapest, Hungary) after the manual determination of the ablation zone.
2.4. Statistical analysis
Each ablation protocol, including measurements of the temperature and muscle contraction was performed in triplicate, and the result was tabulated as mean ± standard deviation. A one-way ANOVA was calculated using Minitab 17 (Minitab, Inc., State College, PA, USA) in order to compare results between groups. Results were considered as statistically significant at p < 0.05.
3. Results
3.1. Histological analysis
Animals endured all the ablation protocols without mortality or serious morbidity during and after the administration of the designed H-FIRE pulses. All animals woke up after about 20 min after the treatment and returned to upright posture.
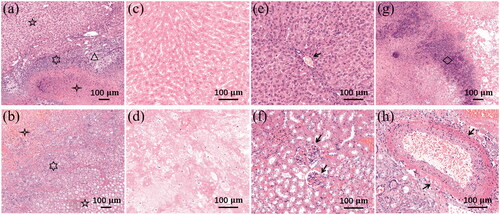
shows the histological results of liver and kidney tissues treated by the planned H-FIRE protocols. Three visible zones can be found in both liver and kidney tissues, consistent with prior reported studies of IRE and H-FIRE, namely the ablation zone (four-pointed star), intact zone (five-pointed star), and transition zone (six-pointed star), as shown in , respectively. Inflammatory cells were found infiltrating the transition zone in both treated liver and kidney tissues. Fibrosis and bile duct proliferation (triangle) were also seen in the transition zone of treated liver tissues, as shown in . The ablation zone of liver or kidney tissues demonstrated a central zone of complete cellular necrosis, showing pyknotic nuclei and cell debris, as shown in . Some preserved structures can be recognized in the intact zone based on the tissue type, like a capillary in the liver tissue (arrow in ) and glomeruli in the kidney tissue (arrows in ). Some inflammatory cells (mainly macrophages, diamond in ) were also found in the ablation zone of liver tissues. shows a blood vessel with intact vessel wall and erythrocytes inside in the transition zone of kidney tissues.
Figure 3. Histology of liver and kidney 72 h post-H-FIRE, H&E staining. (a) Liver ablation zone (five-pointed star), intact zone (four-pointed star), and transition zone (six-pointed star) with inflammation cells, bile duct proliferation, and fibrosis (triangle), 10x. (b) Kidney ablation zone (five-pointed star), intact zone (four-pointed star), and transition zone (six-pointed star) with inflammation cells, 10x. (c) Liver ablation zone with complete cellular necrosis, 20x. (d) Kidney ablation zone with complete cellular necrosis, 20x. (e) Liver intact zone with a capillary (arrow), 20x. (f) Kidney intact zone with visible glomeruli (arrows), 20x. (g) Inflammatory cells in the liver ablation zone (diamond), 10x. (h) A blood vessel in the kidney transition zone (arrows), 20x.
3.2. Ablation zones
3.2.1. General results
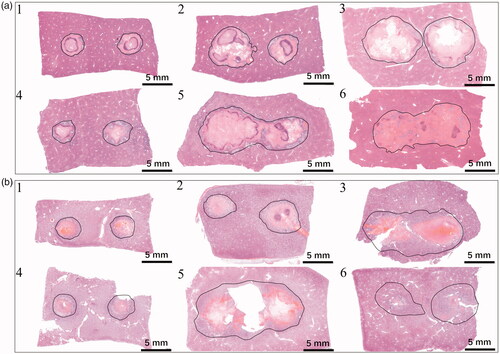
The measured area of the ablation zone for each ablation protocol can be found in . show the representative H&E results of ablation zone examined 72 h after treatments for liver tissues and kidney tissues, respectively. An ablation zone is seen with all designed H-FIRE and IRE protocols and the ablation zone varied for each protocol yielded different results for liver and kidney tissues. As shown in , the minimum and maximum ablation zones were generated by P1 (25.4 4.3 and 26.5
3.8 mm2) and P5 (90.1
1.3 and 118.7
10.0 mm2), respectively in both liver and kidney groups. For the liver group, two separate ablation zones were seen for P1, P2, P3, and P4, and the two ablation zones merged into one for P5 and P6. However, the merged ablation zone can be found in P3 and P5 instead of P6 in the kidney group. Similar with the liver group, the ablation zones in P1, P2, and P4 were two separated round zones in the kidney group. The same pattern of ablation zone was also seen in other repeated samples (N = 3) for both the liver and kidney groups.
Figure 4. Representative images of ablation zones examined 72 h after treatments for (a) Liver and (b) kidney (the number on the figure denotes the protocol number).
3.2.2. Comparison of ablation zones between ablation protocols
shows the comparison in the areas of ablation zone for the six protocols between the liver and kidney groups. Except P5, there was no significant difference in the ablation zone between the liver and kidney groups in all ablation protocols. The change in the ablation zone with the protocol was also found to be identical in both tissues. show the areas of ablation zone in P1-P6 for the liver and kidney groups, respectively. In the liver group, the largest ablation zone was achieved in P5, and there was no significant difference between P5 and P6 (90.1 1.3 vs. 86.3
13.0 mm2). Compared to the IRE protocol, a significant difference in the area of ablation zone can be found between P6 and P1 (86.3
13.0 vs. 25.4
4.3 mm2, p < 0.01), P2 (86.3
13.0 vs. 59.9
9.0 mm2, p < 0.05), and P4 (86.3
13.0 vs. 41.6
5.1 mm2, p < 0.01). However, the results showed a different conclusion in the kidney group among protocols. Though the largest ablation zone was also achieved in P5 like the liver group, there was a significant difference in the area between P5 and P6 (118.7
10.0 vs. 54.0
19.3 mm2) (p < 0.01). The area of ablation zone achieved in P3 was also found significantly larger than that in P6 (90.4
11.0 vs. 54.0
19.3mm2, p < 0.05), which was not the case in the liver group.
Figure 5. Comparisons of the ablation zone areas between (a) liver and kidney for each ablation protocol in (b) liver and (c) kidney, (d) P1 and P2 in liver, (e) P4 and P5 in liver, (f) P1 and P2 in kidney, (g) P4 and P5 in kidney, and (h) P1 and P3 in liver, (i) P1 and P3 in kidney, (j) P3 and P5 in liver, and (k) P3 and P5 in kidney. **p < 0.05, and ***p < 0.01 (error bar represents standard deviation).
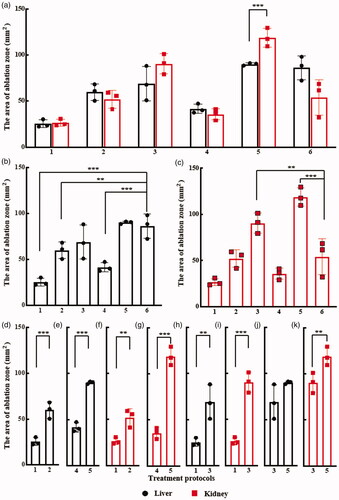
3.2.3. Comparison of ablation zones between pulse voltages
As shown in , the area of ablation zone of liver was significantly higher using P2 protocol (59.9 9.0 mm2) versus P1 (25.4
4.3 mm2) (p < 0.01), as the pulse voltage increased to 2500 V in P2 from 2000 V in P1 while keeping other values of pulse parameters identical. Similarly, in other pulse parameter setting scenarios, the significant increase in the area of ablation zone of liver with the increase in pulse voltage was also recognized in P4 (41.6
5.1 mm2, 1500 V) and P5 (90.1
1.3 mm2, 2000 V) (p < 0.01), as shown in . Similar with the cases in the liver group, significant increases in the area of ablation zone were also found between P1 and P2 (26.5
3.8 vs. 52.1
9.6 mm2, p < 0.05), P4 and P5 (35.6
6.0 vs. 118.7
10.0 mm2, p < 0.01) in the kidney group, as shown in .
3.2.4. Comparison of ablation zones between pulse widths
We noticed that though the energized time was similar (9009 vs. 9000 μs), there was a significant increase in the area of ablation zone when the pulse width increased from 0.3 μs in P1 to 1 μs in P3 in both the liver and kidney groups (liver group: 25.4 4.3 vs. 69.0
18.7 mm2, p < 0.05, and kidney group: 26.5
3.8 vs. 90.4
11.0 mm2, p < 0.01), as shown in . This increase could also be owing to the larger on-time per burst of P3 (100 μs) than that of P1 (46.2 μs). However, no significant difference in the area of ablation zone (69.0
18.7 vs. 90.1
1.3 mm2, p = 0.122) was found when the energized time increased from 9000 μs in P3 to 18000 μs in P5 in the liver group with the identical on-time per burst (i.e., 100 μs), as shown in . Conversely, the area of ablation zone in the kidney group was increased significantly (90.4
11.0 vs. 118.7
10.0 mm2, p < 0.05) when there was an increase in the energized time from 9000 in P3 to 18000 μs in P5, as shown in .
3.3. Muscle contractions
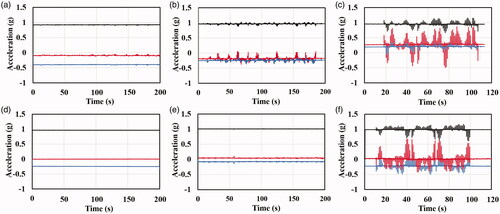
The muscle contraction intensities of the rectus abdominus and oblique muscles of the animals treated by IRE (P6) or H-FIRE (P2 or P5, two cases of highest pulse energy with different pulse widths) were measured in the liver and kidney groups, respectively. shows the muscle contraction accelerations for representative samples of designed H-FIRE and IRE in liver and kidney groups. Except for one mild muscle contraction noticed in one animal receiving H-FIRE to the liver (), no visual or tactile evidence of muscular contraction was found by the authors during the designed H-FIRE bursts in P2 and P5 in both liver and kidney groups. However, macroscopic muscle contractions were seen during the conventional IRE applications by the authors. These results can also be quantitively confirmed by the data recording from the accelerometer, as shown in . Compared with the highest amounts of pulse energy in the designed H-FIRE protocols (P2: 0.3 μs and 2500 V; P5: 1 μs and 2000 V), the conventional IRE protocol (P6: 100 μs and 1000 V) were able to generate significant muscle contractions, showing the drastic acceleration fluctuations along the x, y, and z axes in both liver and kidney groups, as shown in .
Figure 6. Representative muscle contraction accelerations of (a) P2, (b) P5, and (c) P6 for liver and (d) P2, (e) P5, and (f) P6 for kidney. (red, blue, and black lines represent the accelerations along the x, y, and z axes, respectively).
3.4. Temperature changes
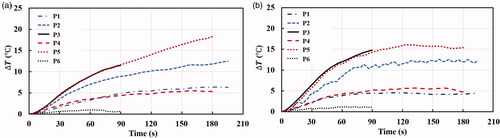
The initial temperatures of liver and kidney tissues were 35.13 0.96 and 35.74
1.76
respectively. As shown in , the average temperature increases caused by the designed H-FIRE protocols followed a similar tendency in both liver and kidney groups. The largest temperature increase was seen in P5 in both liver (approximately
) and kidney (approximately
) groups. The measured temperature was above 50
for about 1 and 1.5 min in the liver and kidney tissues, respectively. Considering that the temperature surrounding the electrode needles was higher than that at the middle point where it was measured, it is quite likely that thermal damage to tissues occurred following P5 protocol. Similarly, P3 was also able to increase the temperature significantly with the same pulse width and voltage with P5 but a shorter energized time. P2 with the pulse width of 0.3 μs and the pulse voltage of 2500 V can increase the measured temperature up to 48
(
) at the end of pulse application in both liver and kidney groups, which might also generate thermal damages to tissues surrounding the electrode needles. It is interesting to mention the temperature increases caused by P1 (0.3 and 2000 V) and P5 (1 μs and 2000 V) followed the same growth tendency and ended at the similar temperature increase (around
) in both liver and kidney groups. Compared to the designed H-FIRE protocols, the conventional IRE protocol (P6: 100 μs and 1000 V) was found to generate negligible temperature increase (
) during the whole pulse application procedure, which resonates with the findings of IRE in existing studies.
Figure 7. Average temperature increases () of P1-P6 for (a) liver and (b) kidney.
4. Discussion
In the present study, we demonstrated that our custom-made H-FIRE pulse generator can produce ablation zones without muscle contractions in both liver and kidney tissues, but with slight temperature increases when high pulse energy (e.g., 1-1-1 and 2000 V) was used. The H-FIRE pulse waveforms tested in this study seem to be safe to rabbit models in the absence of muscle relaxant agents. In both liver and kidney groups, the ablation zone increased with the increase in the pulse energy. Similar with the findings in the work of O’Brien et al. [Citation22], the ablation zone increased significantly with the increase in the pulse width in this study while keeping the total energized time identical (i.e., P3 and P5 in both liver and kidney groups).
Interestingly, except for the P5 protocol, no significant difference in the area of ablation zone was found in other H-FIRE protocols between the liver and kidney groups in the study, although the electric threshold was found to be different between the liver (423 V/cm [Citation23], 300–500 V/cm [Citation24], or 637 V/cm [Citation25]) and kidney tissues (575 67 V/cm [Citation26]), which, however, might be measured in various IRE protocols. It is worth mentioning that a significant increase in the area of the ablation zone is supposed to be generated when the energized time increased significantly, such as in the case of P3 (9000 μs) and P5 (18000 μs) in the kidney group. But, this was not observed in the liver group, which needs further studies with more samples to clarify the underlying reason as the local environment of tissues can affect the ablation results significantly [Citation27]. Conversely, by using a pulse waveform of 2-5-2 at the voltage-to-distance ratio of 1500 V/cm, Siddiqui et al. [Citation12] demonstrated that a significant increase in the ablation zone could be found in a swine liver model with increasing pulse number.
Another interesting result achieved in the study is the difference in the area of ablation zone generated by the IRE protocol (P6) between the liver and kidney groups. The area of ablation zone generated by P6 was found to be significantly smaller than P5 (118.7 10.0 vs. 54.0
19.3 mm2, p < 0.01) and P3 (90.4
11.0 vs. 54.0
19.3 mm2, p < 0.05) in the kidney group, which was not the case in the liver group. In addition, the area of ablation zone by P6 in the kidney group was smaller than that in the liver group (54.0
19.3 vs. 86.3
13.0 mm2, p = 0.075), which did not change even though the experiments were repeated.
The temperature increases in both liver and kidney groups were similar when the ablation protocols with the lower pulse energy were used, for example P1 and P4. Interestingly, however, for those protocols (P2, P3, and P5) with the relatively higher pulse energy that generated higher temperature increases, the temperature increase grew in a different way between the liver and kidney groups. In the liver group, the temperature increase grew slowly to the end of pulse application. But in the kidney group, the temperature increase grew sharply before 90 s and then leveled off until the end of pulse application. The reason leading to this phenomenon might be the differences in perfusion and different thermal properties between the liver and kidney tissues. The other possible reason could also be due to the different electrical conductivities of these two tissues and different dynamic conductivity responses to the electroporation protocols. The impact of this conductivity difference might be even more pronounced when a higher temperature was attained. Further work is warranted to help clarify these results as will need to be considered in the optimization of this non-thermal ablation technique.
In the both liver and kidney group, the relatively high temperature increases (approximately ) were seen in P2, P3, and P5 are concerning. One of the important advantages of IRE or H-FIRE is that they can produce ablation without heat, making these safe to the tissues surrounding the electrode needles ( and ). The reasons leading to this significant temperature increase can be ascribed to the short pulse delay (1 μs in the study), the large number of pulse bursts (e.g., 195 in P2 and 180 in P5), and the high electric field strength (voltage-to-distance ratio: 2500 V/cm in P2). A similar temperature increase was also seen in Sweeney et al.’s in vitro cell study [Citation28] using the pulse waveform of 1-1-1 and 200 pulse bursts containing 50 pulses each at the electric field strength of 1250 V/cm. It is worth mentioning that the protocols examined in the current study were carefully selected to investigate the limit of the custom-made H-FIRE pulse generator. Therefore, we believe that the temperature increase can be kept within acceptable levels, such as (
) with proper pulse parameter settings (e.g., increasing the pulse delay to 2 or 5 μs (), limiting the number of pulse bursts, or lowering the electric field strength), as in the work of Yao et al. [Citation13]. In their study, there was only a mild temperature increase of around 5
seen at the end of pulse administration (90 pulse bursts) with the pulse waveform of 2-2-2 at the voltage-to-distance ratio of 2000 V/cm. In a recent study, Aycock et al. [Citation29] showed that the longer interpulse delays could lower the temperature increase due to the so-called effective baseline conductivity, which is a function of the interpulse delay. However, it is worth mentioning that the pulse delay concerned in the current work includes both the interphase delay and interpulse delay used in the work of Aycock et al. Therefore, it is necessary to confirm whether the pulse delay concerned in the current study also has the similar effect on the electrical conductivity as the interpulse delay does.
It is noteworthy that temperature was only monitored at the center between the two electrode needles during the ablation procedure. The spatial distribution of the temperature during the designed H-FIRE application should be determined with a sophisticated H-FIRE computer model that includes the physics of bioheat transfer. Alternatively, a temperature measuring system with fine temperature probes could be used to measure these temperatures. The testing of a larger number and greater variety H-FIRE ablation protocols would allow for a more accurate comparison to the spatial electric field distribution by the H-FIRE computer model. This might allow a better quantitation of the electric threshold value of irreversible tissue electroporation for different protocols.
Finally, we believe that the desired size of the ablation zone can be achieved with a clinically safe temperature increase by optimizing the designed H-FIRE pulse waveforms, such as increasing the energized time with an optimal pulse voltage, width, and delay.
There are still some limits in the present study that need to be examined further. First, the ablation response of different types of cells to the pulse waveforms of this custom-made H-FIRE pulse generator needs to be studied. Both single cell and 3 D tumor cell models may be employed for this study. Second, the effectiveness of this custom-made H-FIRE pulse generator needs to be further confirmed with in vivo animal tumor models. Third, the robust performance of this custom-made H-FIRE pulse generator by an adequate setting of the pulse waveforms and other process parameters of this generator with respect to heterogeneous tumors in clinical practice along with their micro bio-environments warrants study. Here, the general definition of robustness of a dynamic system is referred to the literature [Citation30]. Finally, an integrated approach to the parameter setting and feedback control of the H-FIRE process with this generator may be developed. The feasibility of this development is based on our past work, in particular the feedback control of an ablation process being upon the radiofrequency ablation process [Citation31] and the integrated process parameter setting and operation management being upon the general dynamic system [Citation32].
5. Conclusion
In conclusion, we have demonstrated that our H-FIRE pulse generator (1), with the proper protocol, can generate clinically relevant ablation zones without muscle contractions and without significant temperature increases in both liver and kidney tissues of a rabbit model in vivo; and (2), with highly adjustable pulse-setting parameters, there is great potential personalized precision ablation of tumors.
Acknowledgement
The authors would like to acknowledge the help with histopathology from Dr. Tamalina Banerjee, MD, FRCPC, College of Medicine, University of Saskatchewan, Canada.
Disclosure statement
No potential conflict of interest was reported by the author(s).
Additional information
Funding
References
- Zhang B, Yang Y, Ding L, et al. Tumor ablation enhancement by combining radiofrequency ablation and irreversible electroporation: an in vitro 3D tumor study. Ann Biomed Eng. 2019;47(3):694–705.
- Fang Z, Mao H, Moser MA, et al. Irreversible electroporation enhanced by radiofrequency ablation: an in vitro and computational study in a 3D liver tumor model. Ann Biomed Eng. 2021:1–13. DOI:https://doi.org/10.1007/s10439-021-02734-x
- Sano MB, DeWitt MR, Teeter SD, et al. Optimization of a single insertion electrode array for the creation of clinically relevant ablations using high-frequency irreversible electroporation. Comput Biol Med. 2018;95:107–117.
- Miklavčič D, Pucihar G, Pavlovec M, et al. The effect of high frequency electric pulses on muscle contractions and antitumor efficiency in vivo for a potential use in clinical electrochemotherapy. Bioelectrochemistry. 2005;65(2):121–128.
- Arena CB, Sano MB, Rossmeisl JH, et al. High-frequency irreversible electroporation (H-FIRE) for non-thermal ablation without muscle contraction. Biomed Eng Online. 2011;10:102.
- Sano MB, Arena CB, DeWitt MR, et al. In-vitro bipolar nano- and microsecond electro-pulse bursts for irreversible electroporation therapies. Bioelectrochemistry. 2014;100:69–79.
- Novickij V, Ruzgys P, Grainys A, et al. High frequency electroporation efficiency is under control of membrane capacitive charging and voltage potential relaxation. Bioelectrochemistry. 2018;119:92–97.
- Mercadal B, Beitel-White N, Aycock KN, et al. Dynamics of cell death after conventional IRE and H-FIRE treatments. Ann Biomed Eng. 2020;48(5):1451–1412.
- Sano MB, Fan RE, Cheng K, et al. Reduction of muscle contractions during irreversible electroporation therapy using high-frequency bursts of alternating polarity pulses: a laboratory investigation in an Ex Vivo Swine Model. J Vasc Interv Radiol. 2018;29(6):893.e4–898.e4.
- Bhonsle SP, Arena CB, Sweeney DC, et al. Mitigation of impedance changes due to electroporation therapy using bursts of high-frequency bipolar pulses. BioMed Eng Online. 2015;14(Suppl 3):S3.
- Kaufman JD, Fesmire CC, Petrella RA, et al. High-frequency irreversible electroporation using 5,000-V waveforms to create reproducible 2- and 4-cm ablation zones-A laboratory investigation using mechanically perfused liver. J Vasc Interv Radiol. 2020;31(1):162.e7–168. e7.
- Siddiqui IA, Latouche EL, DeWitt MR, et al. Induction of rapid, reproducible hepatic ablations using next-generation, high frequency irreversible electroporation (H-FIRE) in vivo. HPB. 2016;18(9):726–734.
- Yao C, Dong S, Zhao Y, et al. Bipolar microsecond pulses and insulated needle electrodes for reducing muscle contractions during irreversible electroporation. IEEE Trans Biomed Eng. 2017;64(12):2924–2937.
- Latouche EL, Arena CB, Ivey JW, et al. High-frequency irreversible electroporation for intracranial meningioma: a feasibility study in a spontaneous canine tumor model. Technol Cancer Res Treat. 2018;17:1533033818785285.
- Ringel-Scaia VM, Beitel-White N, Lorenzo MF, et al. High-frequency irreversible electroporation is an effective tumor ablation strategy that induces immunologic cell death and promotes systemic anti-tumor immunity. EBioMedicine. 2019;44:112–125.
- Ivey J, Wasson E, Alinezhadbalalami N, et al. Characterization of ablation thresholds for 3D-cultured patient-derived glioma stem cells in response to high-frequency irreversible electroporation. Research. 2019;2019:8081315.
- Dong S, Wang H, Zhao Y, et al. First human trial of high-frequency irreversible electroporation therapy for prostate cancer. Technol Cancer Res Treat. 2018;17:1533033818789692.
- DeWitt MR, Lattouche E, Kaufman JD, et al. Simplified non-thermal tissue ablation with a single insertion device enabled by bipolar high-frequency pulses. IEEE Trans Biomed Eng. 2019;67(7):2043–2051.
- Ivey JW, Latouche EL, Sano MB, et al. Targeted cellular ablation based on the morphology of malignant cells. Sci Rep. 2015;5:17157.
- Sano MB, Volotskova O, Xing L. Treatment of cancer in vitro using radiation and high-frequency bursts of submicrosecond electrical pulses. IEEE Trans Biomed Eng. 2018;65(4):928–935.
- Miklovic T, Latouche EL, DeWitt MR, et al. A comprehensive characterization of parameters affecting high-frequency irreversible electroporation lesions. Ann Biomed Eng. 2017;45(11):2524–2534.
- O’Brien TJ, Passeri M, Lorenzo MF, et al. Experimental high-frequency irreversible electroporation using a single-needle delivery approach for nonthermal pancreatic ablation in vivo. J Vasc Interv Radiol. 2019;30(6):854.e7–862.e7.
- Sano MB, Neal RE, Garcia PA, et al. Towards the creation of decellularized organ constructs using irreversible electroporation and active mechanical perfusion. Biomed Eng Online. 2010;9:83.
- Edd JF, Horowitz L, Davalos RV, et al. In vivo results of a new focal tissue ablation technique: irreversible electroporation. IEEE Trans Biomed Eng. 2006;53(7):1409–1415.
- Miklavčič D, Šemrov D, Mekid H, et al. A validated model of in vivo electric field distribution in tissues for electrochemotherapy and for DNA electrotransfer for gene therapy. Biochim Biophys Acta. 2000;1523(1):73–83.
- Neal RE, Garcia PA, Kavnoudias H, et al. In vivo irreversible electroporation kidney ablation: experimentally correlated numerical models. IEEE Trans Biomed Eng. 2015;62(2):561–569.
- Ben-David E, Ahmed M, Faroja M, et al. Irreversible electroporation: treatment effect is susceptible to local environment and tissue properties. Radiology. 2013;269(3):738–747.
- Sweeney DC, Reberšek M, Dermol J, et al. Quantification of cell membrane permeability induced by monopolar and high-frequency bipolar bursts of electrical pulses. Biochim Biophys Acta. 2016;1858(11):2689–2698.
- Aycock KN, Zhao Y, Lorenzo MF, et al. A theoretical argument for extended interpulse delays in therapeutic high-frequency irreversible electroporation treatments. IEEE Trans Biomed Eng. 2021. DOI:https://doi.org/10.1109/TBME.2021.3049221
- Zhang W, Van Luttervelt C. Toward a resilient manufacturing system. CIRP Ann. 2011;60(1):469–472.
- Zhang B, Moser MA, Zhang EM, et al. A new approach to feedback control of radiofrequency ablation systems for large coagulation zones. Int J Hyperth. 2017;33(4):367–377.
- Zhang W, Wang J, Lin Y. Integrated design and operation management for enterprise systems. Enterp Inf Sys.; 2019;13(4):424–429.
Appendix
Table A1. Results of ablation zone in all protocols for liver and kidney tissues.
Methods
To investigate the thermal effect of the designed H-FIRE generator, an ex vivo experiment was performed using porcine liver tissues. Excised liver samples purchased from the local butcher were heated up to and maintained at 35 (same with the in vivo experiment) during the application of H-FIRE pulses in saline solution using a commercial water bath (WO-02L, YUHUA, Gongyi, Henan, China). As the ablation effect of IRE/H-FIRE for exercised tissues cannot be recognized by visual examination, we believe that the color change (white zone) in the treated area of tissues can be taken as the protein denaturation due to the thermal damage. Four H-FIRE protocols were designed to investigate the thermal effect as shown in . P7 and P8 were designed at a similar electrical dose with P5 to study if the pulse delay between the positive and negative pulses can reduce the temperature increase. However, it is noteworthy that the on-time per burst and the burst delivery rate were not identical between these three protocols, which may also affect the temperature increase. P9 was designed to compare the temperature increase with P5 at an increased pulse voltage but identical pulse parameter settings.
Table A2. H-FIRE protocols evaluated for thermal effect.
Results
As shown in , it is interesting to note that the temperature increase of P5 in the ex vivo porcine liver tissues is smaller than that in the in vivo rabbit liver tissues ( vs.
), which might be due to difference in the thermal and electrical properties, the existence of blood perfusion, and the dynamic responses of thermal and electrical conductivities to H-FIRE pulses. The highest temperature increase (i.e.,
) was generated in P9 with the highest electrical dose as shown in . As shown in , we found that the temperature increase reduced with the increase in the pulse delay between the positive and negative pulses although the protocols were administered with the similar electrical dose.
Figure A1. Average temperature increases () of P5, P7-P9 in the ex vivo porcine liver experiment (a) and thermal effects of P5 (b), P7(c), P8 (d), and P9 (e).
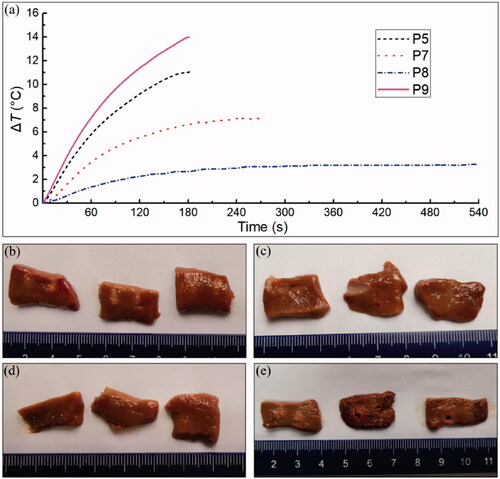
A slight thermal damage was noticed in the porcine liver tissues surrounding the electrodes in P5 (1-1-1) while no visible thermal damage can be found in the tissues treated by neither P7 (1-2-1) nor P8 (1-5-1), as shown in . There was mild thermal damage to the tissues surrounding the electrodes in P9 (1-1-1, 2100 V/cm) as well. However, the thermal damages were still restrained in the tissue areas closing to the electrodes, as shown in . It is noteworthy that some tissue damages (holes in ) were noticed in tissue areas adjacent to the distal part of electrodes in two treated liver samples, which might be due to the high-voltage electrical pulses shocks.