Abstract
Objectives
To confirm the long-term efficacy and safety of radiofrequency ablation (RFA) for low-risk papillary thyroid microcarcinoma (PTMC).
Methods
We retrospectively reviewed data of 102 primary papillary thyroid carcinoma patients (82 women, 20 men; mean age: 43 [19] years) treated with radiofrequency ablation and thyroid-stimulating hormone (TSH) suppression therapy before December 2018. All patients were at high surgical risk or refused surgery. They were followed up at 1, 3, 6, 9, and 12 months and every 6–12 months thereafter using ultrasound and contrast-enhanced ultrasound. The volume and volume reduction ratio was calculated. Recurrence and lymph node or distant metastasis were evaluated.
Results
The mean initial tumor diameter was 0.50 (0.29) cm; the mean initial volume was 0.06 (0.09) mL. At 1, 3, 6, 9, 12, 24, 36, 48, and 60 months after RFA, complete resorption rates were 0, 0, 9.8 (10/102), 33.3 (34/102), 91.2 (93/102), 96.1 (98/102), 99 (101/102), 100, and 100%, respectively. Two patients had developed ipsilateral neck lymph node metastasis in regions IV and VI at 30- and 18-month follow-ups, respectively. After RFA, 3/102 patients (2.9%) developed hoarseness—the main side effect. No life-threatening or delayed complications occurred. The TSH value in the initial period was 0.06 (0.02) µIU/mL; the rate of reaching the TSH target was 85.7%. The TSH value at follow-up was 1.47 (0.91) µIU/mL; the compliance rate was 99.3%.
Conclusions
Ultrasound-guided RFA for PTMC is highly effective and safe. RFA can serve as a minimally invasive treatment for PTMC patients who refuse surgery or active surveillance.
Acknowledgments
I wish to thank clinical investigators who took care of study patients.
Disclosure statement
No potential conflict of interest was reported by the author(s).
Data availability statement
The data that support the findings of this study are available on request from the corresponding author.
Figure 1. Ultrasound (US) image of a 33-year-old woman with a low-risk papillary thyroid microcarcinoma (PTMC). (a) Before radiofrequency ablation (RFA), US image showing a tumor (arrow) located in the right thyroid lobe; it had an initial volume of 307.13 mm3. (b) Immediately after RFA, the volume of the ablation area (arrow) was 852.82 mm3 on contrast-enhanced ultrasound. (c,d) One month after RFA, the volume of the ablation area (arrow) was 556.09 mm3. (e,f) Three months after RFA, the volume of the ablation area (arrow) was 164.12 mm3. (g,h) Six months after RFA, the volume of the ablation area (arrow) was 26.90 mm3. (i,j) Nine months after RFA, the ablation area could not be identified on the longitudinal US image. There was only a focal concavity in the capsule caused by shrinkage of the scar (arrow) on the transverse US image. (k,l) Twelve months after RFA, the ablation area completely disappeared.
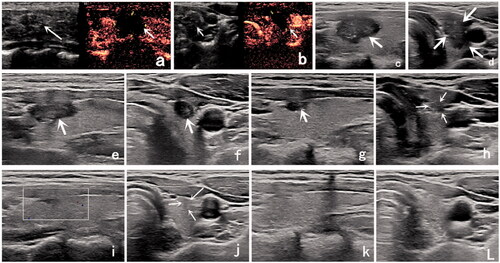
Figure 2. Changes in volume at each follow-up point. After RFA, the volumes are of the ablated area.
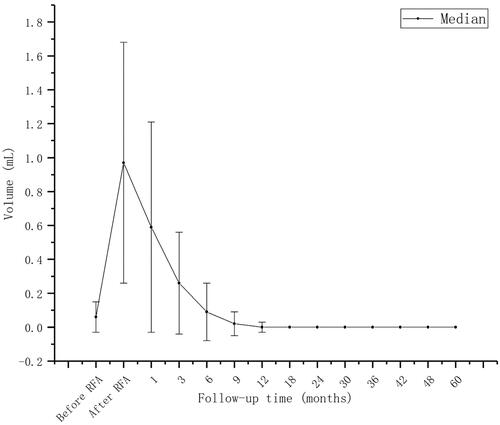
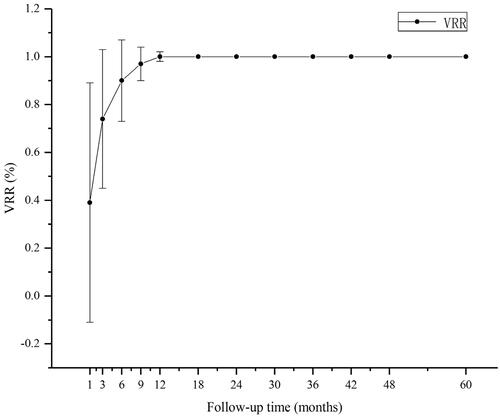
Figure 3. Changes in the volume reduction rate (VRR) at each follow-up point.