
 ?Mathematical formulae have been encoded as MathML and are displayed in this HTML version using MathJax in order to improve their display. Uncheck the box to turn MathJax off. This feature requires Javascript. Click on a formula to zoom.
Abstract
Background
In thermal ablation of malignant liver tumors, ablation dimensions remain poorly predictable. This study aimed to investigate factors influencing volumetric ablation dimensions in patients treated with stereotactic microwave ablation (SMWA) for colorectal liver metastases (CRLM).
Methods
Ablation volumes from CRLM ≤3 cm treated with SMWA within a prospective European multicentre trial were segmented. Correlations between applied ablation energies and resulting effective ablation volumes (EAV) and ablation volume irregularities (AVI) were investigated. A novel measure for AVI, including minimum enclosing and maximum inscribed ellipsoid ablation volumes, and a surrogate parameter for the expansion of ablation energy (EAV per applied energy), was introduced. Potential influences of tumor and patient-specific factors on EAV per applied energy and AVI were analyzed using multivariable mixed-effects models.
Results
A total of 116 ablations from 71 patients were included for analyses. Correlations of EAV or AVI and ablation energy were weak to moderate, with a maximum of 25% of the variability in EAV and 13% in AVI explained by the applied ablation energy. On multivariable analysis, ablation expansion (EAV per applied ablation energy) was influenced mainly by the tumor radius (B = −0.03, [CI –0.04, –0.007]). AVI was significantly larger with higher applied ablation energies (B = 0.002 [CI 0.0007, 0.002]]); liver steatosis, KRAS mutation, subcapsular location or proximity to major blood vessels had no influence.
Conclusions
This study confirmed that factors beyond the applied ablation energy might affect volumetric ablation dimensions, resulting in poor predictability. Further clinical trials including tissue sampling are needed to relate physical tissue properties to ablation expansion.
Introduction
Percutaneous microwave ablation (MWA) is an established treatment technique for malignant liver tumors, including colorectal cancer liver metastases (CRLM) [Citation1]. As a minimally invasive, parenchyma preserving procedure it is associated with low complication rates, short hospital length of stay and enhanced patient recovery [Citation2]. In selected patients, MWA is associated with survival comparable to that after resection [Citation3] and can be performed repeatedly in case of recurrent disease [Citation4,Citation5]. Next to standard image-guidance modalities such as ultrasound, computed tomography (CT) and magnetic resonance, image fusion and stereotactic guidance have been proposed to enhance tumor visibility, targeting accuracy and avoid high radiation exposure [Citation6,Citation7]. This was shown to augment treatment accuracy, safety and targeting success, leading to enhanced efficiency and efficacy when using stereotactic guidance [Citation7–9].
Next to targeting accuracy, the effective creation of ablation volumes leading to complete tumor coverage with adequate ablation margins is crucial for treatment success [Citation10–12]. The generation of ablation volumes is a function of the delivered energy, controlled via power and duration settings on the ablation device. Standardized energy settings for different ablation sizes in 2 D are provided in the ablation device manufacturers’ instructions for use (IFU). These are usually derived experimentally from ex-vivo (non-perfused) or in-vivo healthy animal livers [Citation13]. Concerns regarding a potential lack of correspondence between these predictions and ablation dimensions actually obtained in clinical practice have previously been raised [Citation14–Citation16]. Clinical experience suggests that physical tumor and liver parenchyma characteristics related to tissue perfusion (e.g., perivascular location or tumor vascularity) and liver consistency (e.g., fatty liver disease) might influence the expansion of ablation energy and resulting ablation dimensions, beyond what can be predicted based on energy settings [Citation13,Citation16]. Furthermore, irregularities and inconsistencies of created ablation shapes make predictions of ablation dimensions and thus safety and efficacy of ablation treatment difficult.
The aim of this work was to acquire further knowledge on predictors of treatment success in microwave ablation for CRLM, by investigating i) correlations of predicted and effective ablation volumes, ii) ablation volume irregularities, and iii) factors influencing ablation dimensions beyond energy settings, in a patient cohort extracted from a prospective European multicentre study.
Materials and methods
Patient population
Clinical data from a prospective European multicentre cohort trial (Microwave Ablation Versus Resection for Resectable Colorectal Liver Metastases, MAVERRIC, clinicaltrials.gov: NCT02642185) were analyzed. In this trial, 98 patients with a maximum of 5 CRLM lesions of ≤30 mm diameter, amenable to both CT-guided stereotactic microwave ablation (SMWA) and surgical resection as assessed in local tumor boards, were prospectively included for SMWA treatment in three tertiary HPB Centers (Bern, Switzerland; Groningen, Netherlands; Stockholm, Sweden). While the main study endpoint was overall survival after SMWA as opposed to surgical resection, secondary endpoints included technical analyses of resulting ablation volumes. All clinical and procedure-related data were stored on a secured RedCap database. All imaging data were retrieved from the SMWA systems and stored on secure file storage. Ethical approval was obtained by all respective regional committees.
CT-guided SMWA was performed using the commercially available navigation system CAS-One IR (CAScination AG, Bern, Switzerland) and the Needle Positioning System (NPS; DEMCON Advanced Mechatronics) [Citation8] for enhanced planning of ablation probe trajectories, stereotactic positioning of ablation probes, quantitative validation of ablation probe positions and qualitative validation of ablation success. Detailed setup and procedural workflows of both systems have been described in detail previously [Citation8,Citation17–19]. For patients in whom kidney function allowed a second contrast injection, CT scans for qualitative validation of ablation success were performed immediately after SMWA treatment. Ablation systems routinely used in each center were applied, including Acculis pMTA (Angiodynamics, Latham, NY USA), Solero (Angiodynamics, Latham, NY USA), Amica (HS Medical Inc, Rome, Italy) and Covidien EmprintTM (Covidien/Medtronic AG, USA, Minneapolis).
Data extraction and analysis
Clinicopathological characteristics (e.g., KRAS mutational status) and ablation data (energy settings) were extracted from the study database, and corresponding imaging data was obtained from each center. Retrospective analysis of ablation dimensions generated after SMWA of CRLM was performed using the immediate post-ablation contrast-enhanced (CE)-CT validation scans. In cases of immediate re-ablation in the same treatment session due to initial incomplete ablation, only the first ablation validation scan was used for ablation volume analysis. We excluded cases in which i) no immediate CE-CT validation scan was available (e.g., due to restricted tolerance of contrast administration), ii) multiple parallel ablation probes were applied to create larger ablation volumes, and iii) merging ablation volumes resulted due to multiple tumors ablated in proximity, resulting in the difficult distinction of individual ablation volume boundaries. In included cases, the ablation volumes were manually segmented using semi-automatic segmentation tools available in the software Amira (ThermoFisher Scientific, USA), and stored as binary masks. All segmentations were performed by a trained technical expert and verified by an experienced interventional radiologist from the respective clinical institutions.
Effective and predicted ablation volumes
Obtained effective ablation volumes (EAV) resulting after SMWA were correlated to predicted ablation volumes (PAV) and applied ablation energies, stratified according to the type of applied ablation device. Subgroups with ≤10 EAV samples available were excluded from the analysis. Ablation energy was calculated from the applied power and time settings (), as set on the ablation device by the treating physician. PAV was extracted from the ablation device manufacturer’s guides. For applied ablation energies for which no corresponding PAV dimensions were available from the manufacturer’s IFU’s, but which were situated within the minimum and maximum energy range provided from the IFU’s, PAV was interpolated using linear regression (
). Additionally, the percentage of tumor volume in the ablation volume was calculated as described by Heerink et al. [Citation14].
Ablation volume irregularity
We hypothesize that ablation volume contours are of importance for obtaining complete ablation. Therefore, we introduced ablation volume irregularity (AVI) as a potential risk factor for incomplete tumor coverage by the ablation zone. In the present study, correlations between AVI and applied ablation energies and factors influencing AVI were investigated. AVI was defined as the deviation of the ablation volume from a perfectly ellipsoid shape. To this end, the minimum enclosing ellipsoid volume (MEV) and maximum inscribed ellipsoid volumes (MIV) of obtained ablation volumes were calculated as illustrated in (). AVI was calculated as the proportion of the volume between MIV and MEV compared to the total MEV (see equation below). AVI = 1 represents a highly irregular ablation consisting of only spikes and AVI = 0 represents a perfectly ellipsoid shape with MEV = MIV.
Figure 1. Calculation of ablation volume irregularity (AVI) of effective ablation volumes (EAV). MEV: minimum enclosing ellipsoid volume,;MIV: maximum inscribed ellipsoid volume.
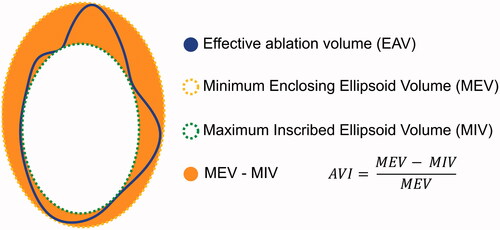
This definition was chosen to account for the fact that MEV–MIV increases with larger ablation volumes and to create an outcome parameter with a fixed range. A convex optimization algorithm as defined by P. Boyd and L. Vandenberghe [Citation20] was applied for computation of MIV and MEV, and the CVXPY library [Citation21] was used for implementation.
Factors influencing ablation dimensions
Factors potentially influencing resulting ablation dimensions were investigated using linear regression analysis. Separate linear regression models were created, using EAV per kJ energy, MEV/kJ, MIV/kJ and AVI as outcome variables. EAV/energy () was chosen as a parameter defining the expansion of ablation energy across the tissue, acting as a possible surrogate variable for tissue properties affecting heat generation and conduction (e.g., heat capacity, microwave absorption). MEV/energy and MIV/energy (
) were chosen as parameters defining the maximum and minimum expansion of ablation energy. All factors available from the study database and thought to potentially influence the spread of ablation energy and thus ablation volume dimensions (EAV/kJ and AVI) beyond the applied ablation energy, were included in the regression models. An overview of factors thought to potentially influence ablation expansion and thus ablation dimensions are provided in . Their description and rationale for inclusion are provided in the following sections.
Figure 2. Overview of factors thought to potentially influence ablation expansion and resulting ablation dimensions.
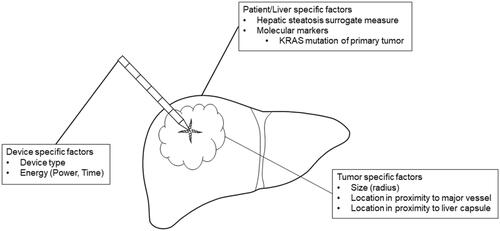
Device-specific factors
Due to different wavelengths, antenna designs and other technical factors, different ablation devices yield varying ablation volume dimensions, depending on the applied energy [Citation22]. The type of applied ablation device was therefore included as a random effect in both models. The applied ablation energy was included as an independent variable in the model investigating AVI, and as part of the outcome parameter in the EAV/energy model.
Tumor specific factors
Tissue necrosis due to MWA has derived from direct heat production and absorption of microwaves in the vicinity of the ablation probe and by heat conduction further away from the probe [Citation23]. Water and lipid concentrations in cancerous tissue are different from those in the healthy liver parenchyma. This results in variation in physical properties affecting direct heat creation and heat conduction [Citation24]. To capture different effects of microwaves onto cancerous versus non-cancerous liver tissue, tumor radius defined as the distance between tumor center and non-cancerous parenchyma was included as an independent variable. A subcapsular tumor location (≤5 mm distance from the liver capsule) was included as a physical factor limiting ablation expansion and promoting tissue shrinkage. Additionally, differences in vascularity in the periphery of the liver compared to more centrally located parenchyma could influence ablation expansion. Proximity (distance ≤5 mm) to intrahepatic vessels (≥3 mm in diameter) was entered as a variable in the model to account for the potential heat sink effect known to influence ablation dimensions [Citation25].
Patient/liver-specific factors
Liver steatosis was described to affect heat conduction properties during ablation [Citation26]. As a surrogate measure for hepatic steatosis, we compared Hounsfield units (HU) of the liver and spleen on the intraprocedural native CT scan, with hepatic steatosis defined as HULiver – HUSpleen < −10 [Citation27]. To assess if Kirsten Rat Sarcoma (KRAS) tumor mutation, previously described as a significant influencing factor for ablation site recurrence [Citation28], affects ablation expansion, KRAS mutation status was included as an independent variable.
Statistics
Outcome parameters were reported as medians and interquartile ranges (IQR). Linear correlation analysis was applied to investigate relationships between applied energy and EAV, EAV and PAV and AVI. Correlation <0.4 was considered weak, <0.7 moderate and >0.7 strong [Citation29]. Univariable and multivariable linear regression analyses were performed to investigate factors potentially influencing EAV/kJ, MEV/kJ, MIV/kJ and AVI, with all independent variables included in the multivariable model. Linear mixed-effects modeling was applied to account for clustering of data for patient-specific factors (hepatic steatosis surrogate measure, KRAS mutation) and device-specific factors (device type), with ‘patient’ and ‘ablation device’ included as random effects. The effect size of all tested variables was reported as linear regression coefficients with 95% Wald confidence intervals (CI). Statistical significance was set at p < 0.05 level. Statistical analyses were performed using R (R Core Team, 2019) and RStudio (RStudio Inc., USA) and graphs were generated using ggplot2. The R package lme4 was used for mixed-effects modeling. The full reproducible statistical code and data for R are available in the supplementary material ‘statistical_analysis.pdf’ and ‘data.csv’.
Results
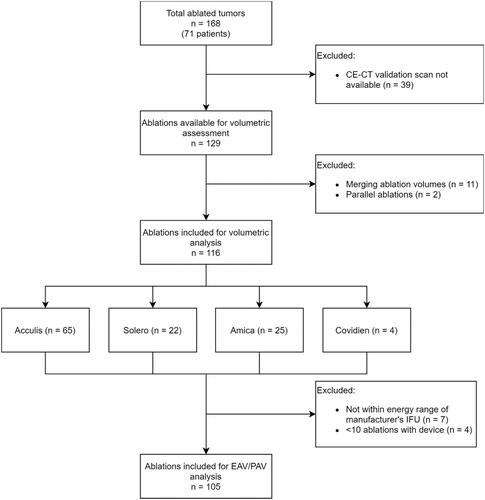
From a total of 168 CRLM treated with SMWA in 98 patients included in the MAVERRIC trial, 116 tumors were suitable for retrospective volumetric analyses of ablation dimensions and 105 tumors for correlation analysis of EAV to PAV. PAV was interpolated in 74 of the 105 cases included for correlation analyses (70%). illustrates the reasons for the exclusion of treated tumors and the number of included tumors per applied ablation device. In the 116 lesions included for volumetric analyses, 17 (15%) arose in steatotic livers, 49 (42%) had KRAS mutation of the primary tumor, 53 (46%) were located in a subcapsular position and 18 (16%) in proximity to major blood vessels.
Figure 3. Flowchart of ablations included for volumetric analyses of ablation dimensions. IFU: Instructions for use; CE-CT: contrast-enhanced computed tomography; EAV: effective ablation volume; PAV: predicted ablation volume.
Median ablation energies in kilojoules (kJ), tumor radius in millimeters (mm), EAV, PAV, MEV, MIV in milliliters (mL) and AVI as ratios are summarized per ablation device and overall (n = 116) in .
Table 1. Summary of main outcome parameters.
Effective and predicted ablation volumes
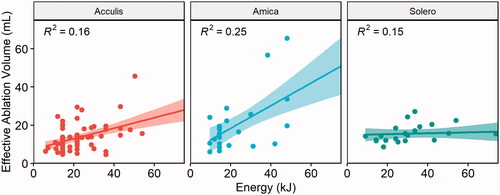
Correlation analysis between EAV and applied energy per ablation device are illustrated in . Overall, the correlation between applied energy and EAV was moderate (r = 0.4, R2 = 0.16, p < 0.001) for the Acculis device, moderate (r = 0.5, R2 = 0.25, p = 0.01) for the Amica device, and weak (r = 0.38, R2 = 0.15, p = 0.08) for the Solero device. This represented a 16%, 25% and 15% of the variability of EAV being explained by the applied ablation energy, when using the Acculis, Amica and Solero device, respectively.
Figure 4. Correlation between ablation energy and EAV for the Acculis, Amica and Solero systems. Lines represent mean correlations, 95% confidence intervals displayed as colored areas.
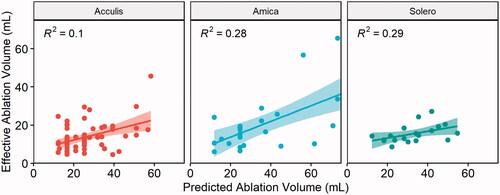
Correlation analysis between EAV and PAV showed a weak correlation for the Acculis system (r = 0.32, R2 = 0.1, p = 0.011) and a moderate correlation for the Amica system (r = 0.53, R2 = 0.28, p = 0.006) and the Solero system (r = 0.54, R2 = 0.29, p = 0.016), as illustrated in .
Figure 5. Correlation between EAV and PAV for the Acculis, Amica and Solero systems. Lines represent mean correlations, 95% confidence intervals displayed as colored areas.
Ablation volume irregularity
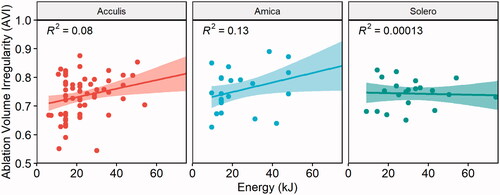
Correlation analysis between applied ablation energy and ablation volume irregularity (AVI) per ablation device is illustrated in . Overall, the correlation between applied energy and AVI showed a weak correlation for the Acculis system (r = 0.28, R2 = 0.08, p = 0.02) and a moderate correlation for the Amica system (r = 0.36, R2 = 0.13, p = 0.07) and no correlation for the Solero system (r = −0.01, R2 = 0.00013, p = 0.96). This represented an 8%, 13% and 0.013% of the variability of EAV being explained by the applied ablation energy when using the Acculis, Amica and Solero device, respectively.
Figure 6. Correlation between energy and AVI for the Acculis, Amica and Solero systems. Lines represent mean correlations, 95% confidence intervals displayed as colored areas.
Factors influencing ablation dimensions
Factors influencing EAV/kJ
Univariable and multivariable linear regression analyses of factors potentially influencing obtained EAV per applied kJ energy are summarized in . The univariable analysis yielded tumor radius as the only statistically significant factor regarding EAV per applied kJ energy, with decreasing EAV per applied energy for each increasing millimeter (mm) tumor radius (B = −0.03, p = 0.002). In multivariable analysis, a larger distance between tumor center and healthy liver parenchyma (tumor radius) yielded significantly smaller ablation volume per applied kJ energy (B = −0.03, p = 0.01). KRAS mutated tumors yielded on average 14% larger ablation volumes per applied kJ ablation energy (p = 0.09). Other factors did not show a significant influence on ablation volume expansion in our model.
Table 2. Linear regression mixed-effects model of factors influencing effective ablation volume (EAV) per applied kiloJoule (kJ) ablation energy, including patient and ablation device as random effects.
Factors influencing MIV/kJ
Univariable and multivariable linear regression analyses of factors potentially influencing MIV per applied energy are summarized in . On univariable analysis, only the tumor radius was shown to be a significant factor influencing MIV/kJ (B = −0.02, p < 0.001). On multivariable analysis, larger tumor radius remained leading to smaller MIV per applied energy (B = −0.02, p < 0.001). All other factors did not have a statistically significant influence on MIV per energy in our model.
Table 3. Linear regression mixed-effects model of factors influencing maximum inscribed volume (MIV) per applied kiloJoule (kJ) ablation energy, including patient and ablation device as random effects.
Factors influencing MEV/kJ
Univariable and multivariable linear regression analyses of factors potentially influencing MEV per applied energy are summarized in . On univariable analysis, the tumor radius (B = −0.07, p = 0.002) and KRAS mutation status (B = 0.44, p = 0.02) were shown to be a significant factor influencing MEV/kJ. On multivariable analysis, larger tumor radius remained leading to smaller (B = −0.07, p = 0.008) and KRAS mutations leading to larger (B = 0.44, p = 0.04) MEV per applied energy. All other factors did not have a statistically significant influence on MEV per energy in our model.
Table 4. Linear regression mixed effects model of factors influencing minimum enclosed volume (MEV) per applied kiloJoule (kJ) ablation energy, including patient and ablation device as random effects.
Factor influencing AVI
Univariable and multivariable linear regression analyses of factors potentially influencing ablation volume irregularity (AVI) are summarized in . On univariable analysis, only the applied ablation energy was shown to be a significant factor influencing AVI (B = 0.001, p = 0.001). On multivariable analysis, higher ablation energy lead to increasingly irregularly shaped ablation dimensions (B = 0.002, p = 0.002). KRAS mutant status, steatotic liver parenchyma, a subcapsular tumor location or proximity to blood vessels did not have a statistically significant influence on AVI in our model.
Table 5. Linear regression mixed effects model of factors influencing ablation volume irregularity (AVI), including patient and ablation device as random effects.
Discussion
This study investigated ablation dimensions using a quantitative approach based on 3 D segmentation of effective ablation volumes, in a prospective multicentre patient cohort treated with SMWA for CRLM. To the best of our knowledge, this is the first work analyzing factors influencing ablation expansion and dimensions in 3 D using clinical data on ablation of malignant liver tumors. The weak to moderate linear correlations between obtained effective ablation volumes and applied ablation energies and predicted ablation volumes confirmed that other factors than ablation energy affect ablation dimensions [Citation13,Citation16]. At most, 25% of the variability in the EAV was explained by the applied energy, highlighting overall poor predictability of created ablation volumes solely by the applied ablation energy. The weak to moderate correlations between EAV and PAV are in concordance with previous works reporting significantly smaller clinical ablation volumes than the ones predicted in the manufacturer’s IFU [Citation14,Citation30,Citation31]. This can be explained by the physical properties of tumor and diseased (steatotic, fibrotic or cirrhotic) human liver tissue being different than in ex-vivo or in-vivo healthy animal tissue, where PAV are usually extracted from [Citation15]. A heat sink effect must further be expected leading to smaller ablation volumes in perfused livers. These findings supported our rationale for investigating factors potentially influencing ablation dimensions using multivariable analyses.
We chose EAV per applied ablation energy to investigate effective ablation volumes, to i) include the main exposure parameter (applied energy) in the outcome variable and ii) create a potential surrogate parameter for the expansion of ablation energy across tumor and liver tissue. This is thought to be caused by microwave absorption, heat capacity, heat conductivity and other factors influencing heat generation within the ablated tissue. These parameters are difficult to assess in a clinical setting, especially when considering the heterogeneity between tumors, and would require tissue biopsies of the tumors to be ablated and the surrounding liver parenchyma. Whether a tendency toward larger EAV per energy in KRAS mutations of the primary tumor and hepatic steatosis is reproducible must be investigated in further studies. Also, KRAS mutation led to potentially larger ablation volumes (B = 0.14, CI [–0.02, 0.3], p = 0.09), which could be perceived counterintuitive as previous studies reported higher local recurrence rates in KRAS mutant tumors after thermal ablation [Citation28]. The presence of satellite lesions, altered lipid metabolism and tissue composition related to genetic tumor properties [Citation32,Citation33], or different chemotherapy regimens applied depending on KRAS mutational status [Citation34], might explain these differences. Lipids having a lower heat capacity than water molecules would result in less heating energy required for ablation expansion [Citation35] and explain larger ablation volumes in steatotic livers or tumors with altered lipid metabolism. In contrast to other studies [Citation26], we found no significant effect of hepatic steatosis surrogate measure on ablation volumes created per applied energy unit. This could be due to the low incident of patients in the hepatic steatosis surrogate measure subgroup (8 patients, 17 lesions). Even though these results were not statistically significant, they suggest that genetic mutations and potentially hepatic steatosis might influence the underlying tissue properties relevant for heat generation and conduction, such as lipid and water concentrations. This must be confirmed in clinical studies objectifying hepatic steatosis in the biopsy specimen.
Another interesting finding was that tumors with a larger radius created significantly smaller ablations per kJ ablation energy (B = −0.03, p = 0.01). Similar to the effect of hepatic steatosis shown in other studies, this could be explained by the higher water and lower lipid content in cancerous tissue as opposed to liver parenchyma [Citation24]. Thus, with liver parenchyma of higher lipid concentration being closer to the positioned ablation probe in the tumor center, higher heat might be created faster at the same energy level. More tumor tissue of higher water content in the vicinity of the ablation probe (direct heat) causes gas bubble formation, which might act as a heat insulator due to the lower thermal conductivity of gases [Citation35]. Enhanced vascularity in cancerous tissue compared to parenchyma might also contribute to this effect. Similar to Heerink et al. [Citation14], the tumor volume represented a low percentage of the total ablation volume (7.7%, IQR = [3.0%, 15.7%]), suggesting that physical characteristics of the surrounding parenchyma might contribute more to the ablation zone expansion than the characteristics of the tumor tissue. This holds especially for smaller tumors where an ablation volume increases to the power of 3 with the added margin. Other factors such as a subcapsular location and vessel proximity did not significantly influence but on average yielded smaller EAV per applied energy. This is probably explained by the inherent limitation of heat expansion at the liver capsule and due to the well-known heat sink effect [Citation25].
To investigate surface irregularities of the generated ablation volumes and potential differences between the ablation volume yielding tumor necrosis and the one yielding spikes and potential collateral damage, a novel measure of approximating AVI was proposed. Hypothesizing that irregularities in the ablation volume surface caused by varying heat profiles around the MWA antenna might lead to increased risk of recurrence or need for re-ablation, we analyzed factors influencing such irregularities. The MIV described the volume where all tumor cells would be covered by the ablation volume with high certainty, the MEV the volume representing danger for inadvertent ablation of surrounding structures. While the perfectly ellipsoidal ablation volumes described by the manufacturer’s guides would yield an AVI of 0, large differences between MIV and MEV and AVI heavily differing from 0 were shown in our clinical data, suggesting a significant variability in ablation shapes. Larger irregularity with higher applied energies was confirmed in multivariable analysis, with however a small effect size, corresponding to the maximum 13% variability in correlation analysis. The tendency toward larger ablation irregularities in subcapsular tumors might arise due to the typically wedge-shaped ablations generated in these locations. Even though not statistically significant, these findings and the correlation of AVI with ablation site recurrence must be validated in further clinical trials. Regarding MEV per applied energy, a significant (44%) increase in MEV per kJ of energy in KRAS mutated tumors was found. This could not be observed for MIV per kJ of energy, suggesting that KRAS mutations might have a higher effect on tissue properties toward the periphery of the tumor.
A limitation of this study is that even though prospectively acquired clinical data was used, ablation dimensions were analyzed retrospectively. This led to 29.5% of ablated tumors being excluded from analyses. Additionally, 70% of PAV had to be interpolated since predictions were not available from the manufacturers’ IFU. This might have affected the precision of results from correlation analyses. Another notable aspect includes the fact that MWA is known to cause significant tissue shrinkage immediately post-treatment [Citation31,Citation36,Citation37]. This might have led to an underestimation of EAV in this study since CT scans for ablation validation were taken immediately after the SMWA treatment.
In conclusion, this study confirms poor predictability of ablation dimensions solely based on the applied ablation energy. Other clinical factors influencing the physical properties of tumor and liver tissue affect the size and shape of ablation volumes after SMWA for CRLM. Further clinical trials including tissue sampling are needed to confirm these results.
Author contributions
IP, PT: Study planning, data collection, analysis and interpretation, manuscript writing; JF, SR, KPJ, SW: Study planning, analysis and interpretation, and manuscript proofreading. All authors provided approval for the publication of the final version of the manuscript.
Supplemental Material
Download PDF (378.5 KB)Disclosure statement
Stefan Weber and Daniel Candinas are co-founders and shareholders of CAScination, manufacturer of one of the navigation systems applied for stereotactic microwave ablation in this study. Iwan Paolucci, Jacob Freedman, Simeon J. S. Ruiter, Koert P. de Jong and Pascale Tinguely have no conflict of interest to declare.
Data availability statement
All data used in this study is available in the supplementary material “data.csv”. The full statistical analysis and the code are available in the supplementary material “statistical_analysis.pdf”.
Additional information
Funding
References
- Leung U, Kuk D, D'Angelica MI, et al. Long-term outcomes following microwave ablation for liver malignancies. Br J Surg. 2015;102(1):85–91.
- Beermann M, Lindeberg J, Engstrand J, et al. 1000 Consecutive ablation sessions in the era of computer assisted image guidance – lessons learned. Eur J Radiol Open. 2019;6:1–8.
- Tinguely P, Dal G, Bottai M, et al. Microwave ablation versus resection for colorectal cancer liver metastases – a propensity score analysis from a population-based nationwide registry. Eur J Surg Oncol. 2020;46(3):476–485.
- Engstrand J, Nilsson H, Jansson A, et al. A multiple microwave ablation strategy in patients with initially unresectable colorectal cancer liver metastases – a safety and feasibility study of a new concept. Eur J Surg Oncol. 2014;40(11):1488–1493.
- Hof J, Wertenbroek MWJLAE, Peeters PMJG, et al. Outcomes after resection and/or radiofrequency ablation for recurrence after treatment of colorectal liver metastases. Br J Surg. 2016;103(8):1055–1062.
- Bale R, Widmann G, Stoffner DIIR. Stereotaxy: breaking the limits of current radiofrequency ablation techniques. Eur J Radiol. 2010;75(1):32–36.
- Beyer LP, Pregler B, Nießen C, et al. Stereotactically-navigated percutaneous irreversible electroporation (IRE) compared to conventional IRE: a prospective trial. PeerJ. 2016;4:e2277.
- Heerink WJ, Ruiter SJS, Pennings JP, et al. Robotic versus freehand needle positioning in CT-guided ablation of liver tumors: a randomized controlled trial. Radiology. 2019;290(3):826–832.
- Tinguely P, Paolucci I, Ruiter S, et al. Stereotactic and robotic minimally invasive thermal ablation of malignant liver Tumours –a systematic review and meta-analysis. BMC Cancer. 2020.
- Shady W, Petre EN, Do KG, et al. Percutaneous microwave versus radiofrequency ablation of colorectal liver metastases: ablation with clear margins (A0) provides the best local tumor control. J Vasc Interv Radiol. 2018;29(2):268–275.e1.
- Calandri M, Yamashita S, Gazzera C, et al. Ablation of colorectal liver metastasis: interaction of ablation margins and RAS mutation profiling on local tumour progression-free survival. Eur Radiol. 2018;28(7):2727–2734.
- Teng W, Liu K-W, Lin C-C, et al. Insufficient ablative margin determined by early computed tomography may predict the recurrence of hepatocellular carcinoma after radiofrequency ablation. Liver Cancer. 2015;4(1):26–38.
- Shyn PB, Bird JR, Koch RM, et al. Hepatic microwave ablation zone size: correlation with total energy, net energy, and Manufacturer-Provided chart predictions. J Vasc Interv Radiol. 2016;27(9):1389–1396.
- Heerink WJ, Solouki AM, Vliegenthart R, et al. The relationship between applied energy and ablation zone volume in patients with hepatocellular carcinoma and colorectal liver metastasis. Eur Radiol. 2018;28(8):3228–3236.
- Ruiter SJS, Heerink WJ, de Jong KP. Liver microwave ablation: a systematic review of various FDA-approved systems. European Radiology. 2019;29(8):4026–4035.
- Amabile C, Ahmed, M, Solbiati, L, et al. Microwave ablation of primary and secondary liver tumours: ex vivo, in vivo, and clinical characterisation. Int. J. Hyperth. 2017;33(1):34–42.
- Engstrand J, Toporek G, Harbut P, et al. Stereotactic CT-guided percutaneous microwave ablation of liver tumors with the use of high-frequency jet ventilation: an accuracy and procedural safety study. AJR Am J Roentgenol. 2017;208(1):193–200.
- Lachenmayer A, Tinguely P, Maurer MH, et al. Stereotactic image – guided microwave ablation of hepatocellular carcinoma using a computer – assisted navigation system. Liver Int. 2019;39(10):1975–1985.
- Tinguely P, Frehner L, Lachenmayer A, et al. Stereotactic image-guided microwave ablation for malignant liver tumors-a multivariable accuracy and efficacy analysis. Front Oncol. 2020;10:842.
- Boyd S, Vandenberghe L. Convex optimization. Cambridge: Cambridge University Press; 2004.
- Diamond S, Boyd S. CVXPY: a python-embedded modeling language for convex optimization. J Mach Learn Res. 2016;17:83.
- Winokur RS, Du JY, Pua BB, et al. Characterization of in vivo ablation zones following percutaneous microwave ablation of the liver with two commercially available devices: are manufacturer published reference values useful? J Vasc Interv Radiol. 2014;25(12):1939–1946.e1.
- Schramm W, Yang D, Haemmerich D. Contribution of direct heating, thermal conduction and perfusion during radiofrequency and microwave ablation. Annual International Conference of the IEEE Engineering in Medicine and Biology – Proceedings, New York,; 2006. p. 5013–5016.
- Ueda J, Kobayashi Y, Kenko Y, et al. Distribution of water, fat, and metals in normal liver and in liver metastases influencing attenuation on computed tomography. Acta Radiol. 1988;29(1):33–39.
- Ringe KI, Lutat C, Rieder C, et al. Experimental evaluation of the heat sink effect in hepatic microwave ablation. PLOS One. 2015;10(7):e0134301–8.
- Young S, Rivard M, Kimyon R, et al. Accuracy of liver ablation zone prediction in a single 2450 MHz 100 watt generator model microwave ablation system: an in human study. Diagn Interv Imaging. 2020;101(4):225–233.
- Zhang Y, Fowler KJ, Hamilton G, et al. Liver fat imaging-a clinical overview of ultrasound, CT, and M R imaging. Br J Radiol. 2018;91(1089):20170959.
- Shady W, Petre EN, Vakiani E, et al. Kras mutation is a marker of worse oncologic outcomes after percutaneous radiofrequency ablation of colorectal liver metastases. Oncotarget. 2017;8(39):66117–66127.
- Akoglu H. User’s guide to correlation coefficients. Turk J Emerg Med. 2018;18(3):91–93.
- Young S, Rivard M, Kimyon R, et al. Accuracy of liver ablation zone prediction in a single 2450 MHz 100 watt generator model microwave ablation system: an in human study. Diagn Interv Imaging. 2020;101(4):225–233.
- Amabile C, Farina L, Lopresto V, et al. Tissue shrinkage in microwave ablation of liver: an ex vivo predictive model. Int J Hyperthermia. 2017;33(1):101–109.
- Pakiet A, Kobiela J, Stepnowski P, et al. Changes in lipids composition and metabolism in colorectal cancer: a review. Lipids Health Dis. 2019;18(1):29–21.
- Tabuso M, Christian M, Kimani PK, et al. KRAS status is associated with metabolic parameters in metastatic colorectal cancer according to primary tumour location. Pathol Oncol Res. 2020;26(4):2537–2548.
- Lin Y, Liang Y, Tsai J, et al. Oxaliplatin-based chemotherapy is more beneficial in KRAS mutant than in KRAS wild-type metastatic colorectal cancer patients. PLOS One. 2014;9(2):e86789.
- Hasgall PA, Di Gennaro F, Baumgartner C, et al. “IT’IS Database for thermal and electromagnetic parameters of biological tissues.” 2018.
- Solbiati M, Muglia R, Goldberg SN, et al. A novel software platform for volumetric assessment of ablation completeness. Int J Hyperth. 2019;36(1):337–343.
- Farina L, Nissenbaum Y, Cavagnaro M, et al. Tissue shrinkage in microwave thermal ablation: comparison of three commercial devices. Int J Hyperthermia. 2018;34(4):382–391.