
Abstract
Objective
This study explores the feasibility and value of three-dimensional ultrasound virtual organ computer-aided analysis (3D-VOCAL) combined with contrast-enhanced ultrasound (CEUS) for measuring the non-perfused volume (NPV) after microwave ablation (MWA) of benign uterine lesions.
Methods
Fifty-six patients with uterine myoma (UM) and adenomyosis (AM) treated with MWA were enrolled. NPV measurements were obtained postoperatively using two-dimensional CEUS (2D-CEUS), 3D-VOCAL combined with CEUS and three-dimensional contrast-enhanced magnetic resonance imaging (3D-CEMRI). Bland–Altman analysis and intraclass correlation coefficient (ICC) values were used to analyze the agreement of NPV measurements obtained via 2D-CEUS and the combined method with 3D-CEMRI. The inter- and intra-observer agreements of the NPV values obtained with all three methods were also analyzed.
Results
Considering 3D-CEMRI as the standard, 3D-VOCAL showed greater agreement than 2D-CEUS and higher ICCs (ICC, 0.999 vs. 0.891) than 2D-CEUS for different lesion types and sizes of non-perfusion areas (p < 0.001 for all comparisons). NPV measurements obtained via 2 D-CEUS and 3 D-CEMRI differed significantly for AM and non-perfusion areas with maximum diameter ≥5 cm (p < 0.05) and showed no significant differences (p > 0.05) for UM and non-perfusion areas with maximum diameter <5 cm. The NPV measurements obtained via 3D-VOCAL and 3D-CEMRI did not differ significantly (p > 0.05). The intra- and inter-observer agreements of 3D-VOCAL measurements were better than those of 2D-CEUS and slightly lower than those of 3D-CEMRI.
Conclusions
3D-VOCAL combined with CEUS provides accurate estimates of NPV after MWA of benign uterine lesions, and offers a reliable, simple and efficient alternative to CEMRI.
Introduction
Uterine myomas (UMs) and adenomyoses (AMs) are common benign uterine lesions in women of childbearing age. The prevalence of UMs is as high as 70%, while the average prevalence of AMs is 20–30%. Both conditions present clinical symptoms, including pelvic pain, abnormal vaginal bleeding, and reproductive dysfunction, which seriously affect the patient’s quality of life [Citation1–4].
Ultrasound-guided microwave ablation (MWA) for the treatment of benign uterine lesions has been shown to yield good safety, short operation times, fewer complications, and quick postoperative recovery [Citation5–10]. Therefore, an increasing number of patients are selecting this therapeutic modality. The non-perfused volume (NPV) of the contrast agent in the ablation lesion is often measured immediately to evaluate the ablation effect after MWA. The most frequently used enhancement methods for such measurements are contrast-enhanced ultrasound (CEUS) and contrast-enhanced magnetic resonance imaging (CEMRI) [Citation11]. Studies have shown that CEMRI can accurately evaluate the size of uterine fibroids and non-perfusion areas [Citation12–14]. Lei et al. [Citation15] reported that 2D-CEUS and CEMRI showed good agreement in evaluating the ablation volume of uterine fibroids, and that 2D-CEUS can serve as the preferred noninvasive examination. Xu et al. [Citation16] showed that 2D-CEUS could accurately evaluate the ablation rate of localized AM after MWA, and its results were consistent with CEMRI data. However, in both studies, two-dimensional images were used to measure the three diameters of the lesions, after which lesion volume was calculated using a formula. The accuracy of this method is limited by the shape of the measured organ or tumor. Thus, while it is suitable for elliptical or nearly ellipsoid organs or tumors, the measurement accuracy is significantly lower for irregular organs or tumors [Citation17,Citation18]. Since the morphology of benign uterine lesions after ablation is usually irregular, especially in AM patients, 2D-CEUS shows limited accuracy in measuring the ablation volume, which is not conducive for evaluation of postoperative ablation efficacy.
Three-dimensional ultrasound virtual organ computer-aided analysis (3D-VOCAL) is a new volume measurement method that can clearly reshape the three-dimensional structure of human organs or tumors and shows high repeatability and agreement for measurement of the volume of irregular organs or tumors in the human body [Citation19–21]. Three-dimensional contrast-enhanced ultrasound (3D-CEUS) has been used to evaluate tumor blood perfusion in three planes of focal liver lesions and the volume of radiofrequency ablation (RFA) of hepatocellular carcinomas (HCCs) [Citation22,Citation23].
To our knowledge, there have been no reports on the use of 3D-VOCAL combined with CEUS for evaluating the ablation of benign uterine lesions. Thus, the purpose of this study is to evaluate the feasibility of 3D-VOCAL combined with CEUS for NPV measurement after benign uterine lesion ablation and to provide an accurate, efficient, and simple method for efficacy evaluation after benign uterine lesion ablation.
Materials and methods
Patient population
From May 2019 to April 2022, a retrospective study was conducted on 56 patients with UM or AM (age range, 26–51 years; average age, 40.3 ± 6.0 years) who underwent MWA at our hospital. This study was approved by the institutional ethics review board (approval number [2019] Ethics Committee Approval for Scientific Research No. 035), and written informed consent was obtained from all patients.
The inclusion criteria were as follows: (1) patients with UM or AM and related symptoms diagnosed using ultrasound and CEMRI; (2) patients who wished to maintain their uterus; (3) availability of a safe puncture route through the abdominal wall; (4) patients with unifocal UM or AM. Conversely, the exclusion criteria were as follows: (1) pregnant or lactating patients; (2) absence of a safe percutaneous puncture route; (3) patients with multiple UM or AM; (4) patients with poor image quality or inability to record most sections of NPV; (5) allergy to SonoVue or gadolinium.
Equipment
All ultrasound measurements were performed using a GE E8 Color Doppler ultrasound diagnostic instrument (General Electric Healthcare, Milwaukee, MI, USA) equipped with a 5–9-MHz transvaginal three-dimensional volume probe, including VOCAL analysis software. CEMRI was performed in all patients using a 3.0-T MR scanner (Ingenia; Philips, CX, Netherlands).
Method of examination
Transvaginal contrast-enhanced ultrasound
Transvaginal CEUS was performed on postoperative day 1, and 3, 6 and 12 months post MWA. All postoperative transvaginal contractions were performed using the same sonographer with more than 5 years of working experience. The contrast agent was SonoVue (Bracco, Milan, Italy); 59 mg diluted with 5 ml of normal saline, and 2.4 ml was injected through the anterior elbow vein, followed by a rapid injection of 5 ml of normal saline. The postoperative non-perfusion area was observed, and all arterial phase dynamic continuous transverse sections and longitudinal section scanning videos were saved.
Enhanced magnetic resonance imaging
CEMRI was performed 1–2 times on postoperative day 1, and 3, 6 and 12 months post MWA based on the clinical efficacy evaluation and patients’ wishes; CEMRI was also performed on the same day as CEUS. Gadolinium (Magnevist; Schering, Berlin, Germany) injection was administered via the anterior elbow vein at a rate of 0.2 ml/kg, after which CEMRI was performed, and the image was saved.
Image analysis
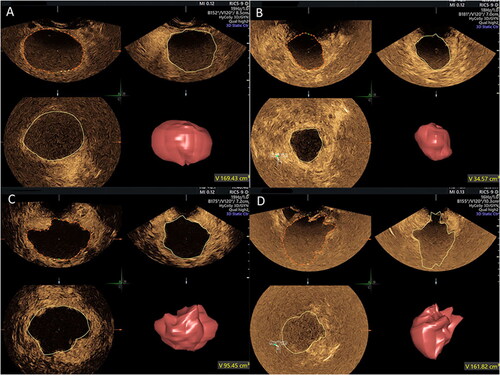
The NPV measurements were performed in 2D-CEUS dynamic images and 3D-VOCAL volume images by two sonographers with more than 5 years of experience, who independently and blindly reviewed the examinations offline at different times. One of the sonographers was blinded to the additional measurements at different times (7-day interval). The NPV measurement method in 2D-CEUS involved evaluation of the maximum longitudinal and transverse sections of the non-perfusion area by observing the dynamic video and measuring the superior-inferior diameter (D1), left-right diameter (D2) and anterior-posterior diameter (D3) of the largest section. NPV was obtained using the volume calculation formula V (cm3) = 0.523 × D1 (cm) × D2 (cm) × D3 (cm). The NPV measurement method in 3D-VOCAL involved reviewing the entire examination data and choosing the best phase, recording the contours of the non-perfusion area in six planes manually or automatically in the area of interest, and clicking finish. The VOCAL analysis system automatically calculated the non-perfusion area volume in milliliters, also providing a 3D rendering ().
Figure 1. Three-dimensional contrast-enhanced ultrasound volumetric images (A–D).
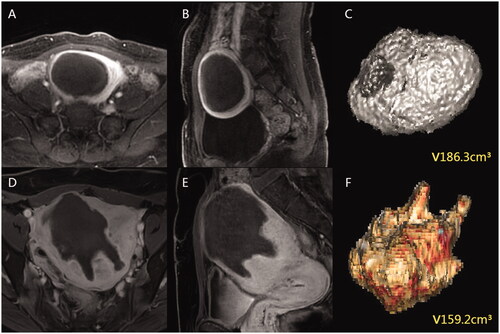
Two radiologists with more than 5 years of experience were independently blinded at different times to measure the NPV using three-dimensional CEMRI (3D-CEMRI), and one radiologist was blinded to obtain an additional measurement after a 7-day interval. The NPV measurement method in 3D-CEMRI involved manually tracing all planes on the T1-enhanced axial sequence and obtaining the contours of the postoperative non-perfusion area. The data were imported, 3D volume images were automatically formed by software, and the volume was obtained ().
Figure 2. Three-dimensional contrast-enhanced magnetic resonance imaging (A–F).
Statistical analysis
Statistical analyses were performed using SPSS Windows (version 28.0, IBM, USA) and R Foundation for Statistical Computing (version 4.0.5, Vienna, Austria). Measurement data were expressed as mean ± standard deviation, and the NPV measurements obtained using the three detection methods were compared using one-way repeated analysis of variance with least significant difference as a post-hoc comparison. The intraclass correlation coefficient (ICC) with 95% confidence intervals (CIs) was obtained to compare agreement, and Bland–Altman analysis was performed to evaluate the magnitude of variations between different methods (2D-CEUS and 3D-CEMRI, 3D-VOCAL and 3D-CEMRI) and between inter- and intra-observer assessments. The averages of the differences and 95% limits of agreement (LoAs) were calculated, and all statistical analyses were two-sided, with p < 0.05 indicating statistical significance.
Results
Baseline data in non-perfusion area
Following MWA, 56 patients with 56 non-perfusion areas were included in the analysis, of which 34 patients with UM (maximum diameter range 2.3–8.3 cm; average diameter 5.0 ± 1.5 cm), and 22 with AM (maximum diameter range 2.1–7.7 cm; average diameter 4.9 ± 1.9 cm).
The maximum diameter of the non-perfusion area was <5 cm in 30 patients (including 18 patients with UM and 12 with AM; maximum diameter range 2.1–4.9 cm; average diameter 3.7 ± 0.9 cm) and ≥5 cm in 26 patients (including 16 patients with UM and 10 with AM; maximum diameter range 5.0–8.3 cm; average diameter 6.4 ± 0.9 cm). The results showed no statistically significant difference in the UM/AM composition between the two groups (p = 0.906).
Reliability and agreement of the two ultrasonic measurement methods and 3D-CEMRI
The NPV measurements use the CEUS and MRI data from the same day by the same sonographer using the two ultrasonic measurement methods (2D-CEUS and 3D-VOCAL), along with the same MRI radiologist on MRI scans ensure reliability. The Bland–Altman analysis of NPV measurements obtained using 2D-CEUS and 3D-CEMRI is shown in , while the Bland–Altman analysis of the NPV values obtained using 3D-VOCAL and 3D-CEMRI is shown in . The 95% LoAs of all groups suggested that the NPV values of 3D-VOCAL and 3D-CEMRI were significantly narrower than those of 2D-CEUS and 3D-CEMRI ().
Figure 3. Bland–Altman plot of NPV measurements obtained via 2D-CEUS and 3D-CEMRI. (A) all patients; (B) patients with UM; (C) patients with AM; (D) patients with maximum diameter ≥5 cm; (E) patients with maximum diameter <5 cm.
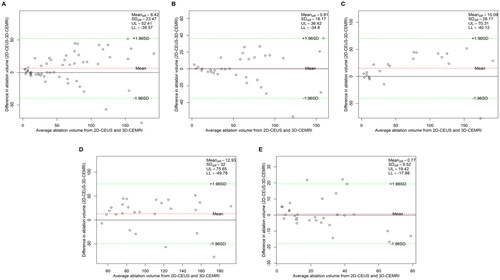
Figure 4. Bland–Altman plot of NPV measurements obtained via 3D-VOCAL and 3D-CEMRI. (A) All patients; (B) patients with UM; (C) patients with AM; (D) patients with maximum diameter ≥5 cm; (E) patients with maximum diameter <5 cm.
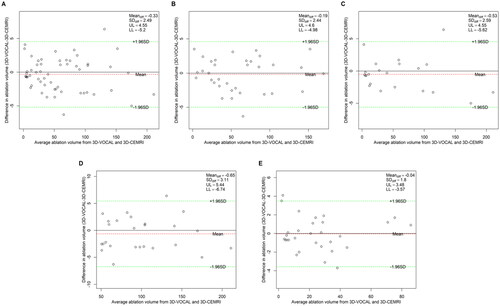
Table 1. Reliability and agreement between the two ultrasonic measurement methods and 3D-CEMRI.
Data from the ICC analysis of the NPV values obtained using the two ultrasonic measurement methods and 3D-CEMRI is shown in . Using 3D-CEMRI as the standard, the ICC of the combined 3D-VOCAL and 3D-CEMRI method was higher than that of 2D-CEUS and 3D-CEMRI in each group (all p < 0.001), which indicates that the reliability and agreement of 3D-VOCAL and 3D-CEMRI are significantly better than those of 2D-CEUS and 3D-CEMRI in all groups.
Comparison of NPV values obtained with the three measurement methods
NPV measurements use the CEUS and MRI data from the same day obtained by the same sonographer using the two ultrasonic measurement methods and those obtained by the same MRI radiologist using the MRI scan were used for variation analysis.
The NPV results measured via 2D-CEUS, 3D-VOCAL and 3D-CEMRI are shown in . The overall NPV values obtained via 2D-CEUS, 3D-VOCAL and 3D-CEMRI were significantly different (p < 0.05), and the NPV values obtained by 2D-CEUS and 3D-CEMRI were significantly different (p < 0.05). No significant difference was observed in the NPV values obtained with 3D-VOCAL and 3D-CEMRI (p > 0.05).
Table 2. Comparison of NPV values obtained by the three measurement methods.
Further analysis showed no significant difference in the NPV measurements obtained by the three methods in cases of UM (p > 0.05). However, the three measurement methods yielded significantly different NPV measurements in cases of AM (p < 0.05). The NPV values obtained using 2D-CEUS and 3D-CEMRI differed significantly (p < 0.05), but no significant differences were observed in the NPV values obtained with 3D-VOCAL and 3D-CEMRI (p > 0.05). The three methods showed no significant difference in measurements of the non-perfusion area with a maximum diameter of <5 cm (p > 0.05). However, in measurements of the non-perfusion area with a maximum diameter ≥5 cm, significant differences were observed (p < 0.05), with statistically significant differences between the NPV measurements obtained via 2D-CEUS and 3D-CEMRI (p < 0.05) with no significant differences between the NPV measurements obtained via 3D-VOCAL and 3D-CEMRI (p > 0.05).
Inter-observer agreement of the three measurement methods
The Bland–Altman analysis of the inter-observer agreement among the three measurement methods is shown in . The results () show that the 95% LoAs of the inter-observer assessment of NPV measurements obtained by 3 D-VOCAL were significantly narrower than those of 2D-CEUS in all groups. also shows the inter-observer ICCs of the three measurement methods, indicating that the ICC of 3D-VOCAL was higher than that of 2D-CEUS (p < 0.001) and slightly lower than that of 3D-CEMRI in each group; thus, the agreement of 3D-VOCAL measurements obtained by different observers was better than that of 2D-CEUS and slightly lower than that of 3D-CEMRI.
Figure 5. Bland–Altman plot of the inter-observer agreement for NPV measurements obtained via 2D-CEUS. (A) All patients; (B) patients with UM; (C) patients with AM; (D) patients with maximum diameter ≥5 cm; (E) patients with maximum diameter <5 cm.
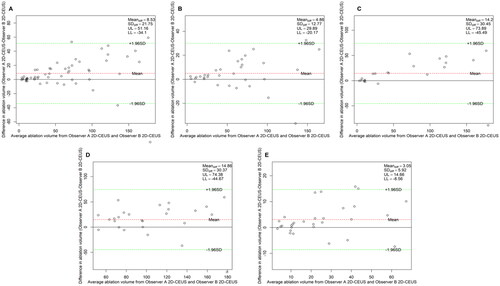
Figure 6. Bland–Altman plot of the inter-observer agreement for NPV measurements obtained via 3D-VOCAL. (A) All patients; (B) patients with UM; (C) patients with AM; (D) patients with maximum diameter ≥5 cm; (E) patients with maximum diameter <5 cm.
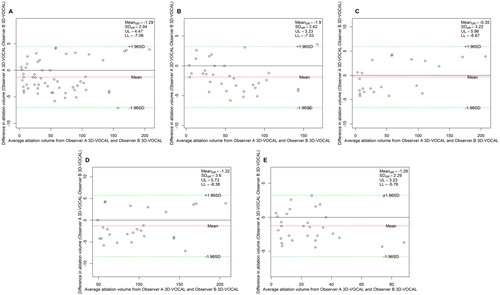
Figure 7. Bland–Altman plot of the inter-observer agreement for NPV measurements obtained via 3D-CEMRI. (A) All patients; (B) patients with UM; (C) patients with AM; (D) patients with maximum diameter ≥5 cm; (E) patients with maximum diameter <5 cm.
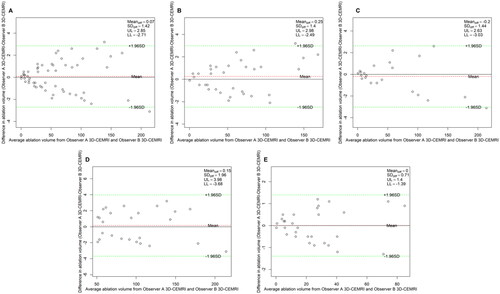
Table 3. Inter-observer agreement in the three measurement methods.
Intra-observer agreement of the three measurement methods
The Bland–Altman analysis of the intra-observer agreement among the three measurement methods is shown in . shows that the 95% LoAs of the intra-observer assessment for NPV values in 3D-VOCAL were significantly narrower than those in 2D-CEUS, and the ICCs of 3D-VOCAL in all groups was higher than those in 2D-CEUS (all p < 0.001). In other words, the intra-observer agreement and repeatability of 3D-VOCAL were more superior to those of 2D-CEUS.
Figure 8. Bland–Altman plot of the intra-observer agreement for NPV measurements obtained via 2D-CEUS. (A) All patients; (B) patients with UM; (C) patients with AM; (D) patients with maximum diameter ≥5 cm; (E), patients with maximum diameter <5 cm.
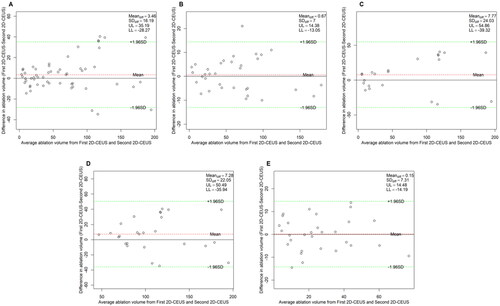
Figure 9. Bland–Altman plot of the intra-observer agreement for NPV measurements obtained via 3D-VOCAL. (A) All patients; (B) patients with UM; (C) patients with AM; (D) patients with maximum diameter ≥5 cm; (E) patients with maximum diameter <5 cm.
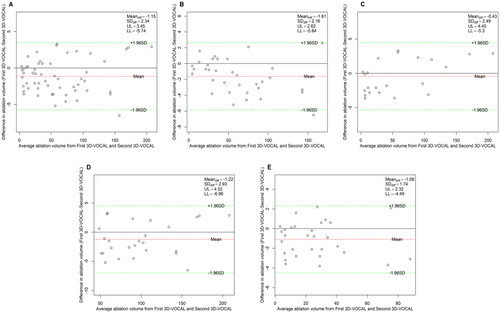
Figure 10. Bland–Altman plot of intra-observer agreement for NPV measurements obtained via 3D-CEMRI. (A) All patients; (B) patients with UM; (C) patients with AM; (D) patients with maximum diameter ≥5 cm; (E) patients with maximum diameter <5 cm.
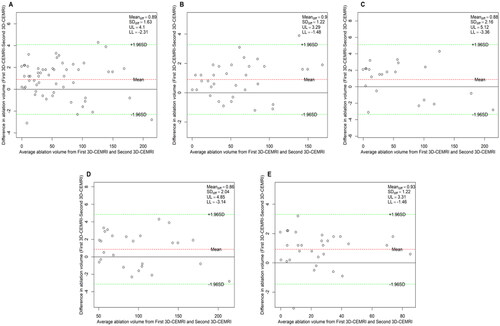
Table 4. Intra-observer agreement of the three measurement methods.
Discussion
In this study, 3D-VOCAL combined with CEUS could accurately evaluate the NPV of benign uterine lesions, indicating its potential as an alternative to CEMRI to evaluate the NPV of benign uterine lesions. CEUS can safely and accurately assess the outcomes of minimally invasive treatments for uterine disease [Citation24], and 3D-US combined with CEUS imaging is feasible for immediate evaluation of ablation during thermal ablation of HCCs [Citation25]. By demonstrating the ablated areas and residual tumors in three dimensions, 3D-CEUS showed good concordance with the results obtained by three-dimensional computed tomography (3D-CT) [Citation22]. Cao et al. [Citation26] suggested that the combination of 2D-CEUS and 3D-CEUS may serve as an alternative to CEMRI in clinical follow-up assessments after RFA treatment in patients with HCC. However, the combination of 3D-VOCAL with CEUS in benign uterine lesion ablation has not yet been reported. We used this combination to evaluate the NPV after thermal ablation of benign uterine lesions and proved the feasibility and value of 3D-VOCAL combined with CEUS in NPV measurement after thermal ablation of benign uterine lesions.
Our data showed a statistically significant difference between NPV measurements obtained by 2D-CEUS and 3D-CEMRI, but no significant difference between measurements obtained with 3D-VOCAL and 3D-CEMRI. The agreement between 3D-VOCAL and 3D-CEMRI was significantly higher than that between 2D-CEUS and 3D-CEMRI. Lyshchik et al. [Citation18] revealed that in comparison with 2D-US, 3D-US can measure the thyroid volume more accurately; however, one study found that 3D-US and MRI showed poor correlation for placental volume measurement (ICC = 0.49), potentially because the placenta is often located behind the fetus and can affected by sound shadow, the placental edge is not clearly distinguished, and the placental volume cannot be accurately estimated. Nevertheless, ultrasound examinations in this study were conducted under the vagina and showed high image quality, which may have yielded the different results in our study [Citation27]. Xiao et al. [Citation28] showed that the accuracy of 3D-US for measuring breast cancer (ICC = 0.90) was significantly better than that of 2D-US (ICC = 0.81). In our study, both 3D-VOCAL and 3D-CEMRI allowed manual or automatic contouring of lesions in multiple planes and yielded volume data automatically with a computer, which was not influenced by lesion shape. 2D-US has no exact standard maximum section and can only measure lesion size in two planes, which is greatly affected by the operator’s subjective opinions. In contrast, 3D-VOCAL involves coronal plane imaging, which can be multi-angle and multiplane continuous imaging, is less affected by the operator’s subjective influence, and offers more advantages for the accuracy of lesion volume measurement. In addition, 3D-VOCAL technology provides preliminary trace measurement, but can also be repeated to modify the initial contour of each plane, such that its measured volume value is more accurate.
The results of this study show that for both AM and UM, the agreement between 2D-CEUS and 3D-CEMRI is lower than that between 3D-VOCAL and 3D-CEMRI. However, the three methods showed no significant differences in NPV measurements of UM (p > 0.05). One possible explanation for this is that the NPV profile after UM ablation shows a clear boundary and an almost spherical or oval shape ( and ). Therefore, the calculated volume was close to the actual volume. However, 2D-CEUS and 3D-CEMRI showed significant differences in the NPV measurement of AM (p < 0.05), which may be due to the absence of a capsule and unclear boundary of AM, resulting in an irregular NPV contour after ablation ( and ). 2D-US measurements were only obtained in two vertical planes, and the calculation of volume by the elliptical volume formula can cause large errors. The 3D-US method has been found to be more accurate than the two-dimensional ultrasonic method for volume measurement of irregularly shaped objects [Citation29].
The accuracy of 2D-US measurements of benign and malignant breast tumors is affected by lesion size; the larger the lesion diameter, the lower the measurement accuracy [Citation30,Citation31]. The accuracy of 3D-US in measuring breast cancer of different sizes is obviously better than that of 2D-US [Citation28]. Our study found that the reliability of 2D-CEUS in measuring the non-perfusion area with a maximum diameter ≥5 cm was lower than that with a maximum diameter <5 cm, whereas 3D-VOCAL showed better reliability for non-perfusion areas of different sizes. The poor measurement accuracy of 2 D-US for large lesions may be attributable to echo attenuation when ultrasound passes through large lesions, leading to unclear rear boundary display, complicating accurate identification of the two largest vertical sections of lesions, and affecting the measurement accuracy. However, 3D-VOCAL involves multiplane stereo imaging, and for different lesion sizes, measurement accuracies are more advantageous.
Our data showed that the NPV values of 3D-VOCAL, which indicated high inter- and intra-observer agreement, were higher than those of 2D-CEUS. In addition, the NPV values of different lesion types and sizes showed almost perfect inter- and intra-observer agreement (ICC ≥0.996). Previous studies have shown that 3D-VOCAL has good inter- and intra-observer agreement and can be used to measure the volume of some relatively irregular organs such as the fetal intracranial and fetal thoracic cavities [Citation21,Citation32]. These studies indicated that the intra- and inter-observer agreement in 3D-VOCAL is not affected by the shape and size of the lesions since the 3D-VOCAL technology uses volume space contrast imaging to optimize the imaging in three orthogonal sections and multi-azimuth and multi-angle observations of the form and structure of the organization and viscera to show the size of the organization, spatial anatomical structure and boundary. A study of 3D-CEUS measurements of the volume of focal liver lesions showed almost perfect inter- and intra-observer agreement (ICC = 0.996 and 0.995) [Citation33]. Interestingly, the participants in this study were not ultrasound specialists who specialized in abdomen imaging, but ultrasound residents who had received only 5 h of specialized training, suggesting that 3 D-CEUS was less dependent on operator experience and offered a high degree of agreement among residents with less experience. Therefore, we believe that 3D-VOCAL is a reliable method for volume measurements after uterine ablation.
Notably, the 3D-VOCAL combined with CEUS offers the following advantages over CEMRI: First, CEUS uses SonoVue, a microbubble contrast agent not excreted through the kidneys, and can also be used in patients with chronic renal insufficiency with high safety and extremely low incidence of allergy (0.014%) [Citation34] without allergy tests. It is also beneficial in those with CEMRI contrast agent allergy and has been widely used in the evaluation of efficacy after ablation of benign uterine lesions [Citation35,Citation36]. Second, 3D-VOCAL combined with CEUS can reveal the blood perfusion of the lesion in real time and in the whole process dynamically; when the image is not satisfactory, SonoVue can be injected intravenously immediately for reevaluation, whereas MRI scans can only be performed at distinct time points. Moreover, this approach is suitable for patients with contraindications of CEMRI, such as a metal IUD, metal denture, or metal internal fixator. Furthermore, CEUS can be performed in an ordinary ultrasound examination room and has no effect on patients with spatial claustrophobia; CEUS is easy to operate, has a short examination time, repeatable examination and low examination cost.
To our knowledge, the use of 3D-VOCAL combined with CEUS to evaluate ablation foci after uterine ablation has not been reported. This study has some limitations as a preliminary empirical exploration. This was a single-center, retrospective study; all participants were from the same institution. Moreover, the study sample size was limited and comprised only those with a single lesion at present. Considering the lack of relevant data and evaluation criteria for multiple lesions, future prospective studies with larger sample sizes are required to confirm the value of this combined approach in efficacy evaluation after ablation of benign uterine lesions, especially in long-term follow-up.
Conclusion
In comparison with traditional 2D-US, 3D-VOCAL combined with CEUS showed higher accuracy and better repeatability for NPV measurement after MWA of benign uterine lesions. The results obtained with the combined method were not affected by lesion morphology, showed less operator dependence and showed high agreement with 3D-CEMRI findings. Thus, it is a reliable, simple and efficient alternative to CEMRI.
Acknowledgements
The authors thank Taylor & Francis for the English language editing.
Disclosure statement
No potential conflict of interest was reported by the author(s).
Additional information
Funding
References
- Giuliani E, As Sanie S, Marsh EE. Epidemiology and management of uterine fibroids. Int J Gynaecol Obstet. 2020;149(1):3–9.
- Graziano A, Lo Monte G, Piva I, et al. Diagnostic findings in adenomyosis: a pictorial review on the major concerns. Eur Pev Med Pharmacol Sci. 2015;19:1146–1154.
- Bird CC, McElin TW, Manalo-Estrella P. The elusive adenomyosis of the uterus–revisited. Am J Obstet Gynecol. 1972;112(5):583–593.
- Cunningham RK, Horrow MM, Smith RJ, et al. Adenomyosis: a sonographic diagnosis. Radiographics. 2018;38(5):1576–1589.
- Yang Y, Hao Y, Zhang J, et al. Ultrasound-guided percutaneous microwave ablation for subserosal uterine myomas. J Minim Invasive Gynecol. 2019;26(3):544–550.
- Fu Y, Feng Q, Zhang S, et al. Application of oxytocin in ultrasound-guided percutaneous microwave ablation for treatment of hypervascular uterine fibroids: a preliminary report. Int J Hyperth. 2019;36(1):760–766.
- Ierardi AM, Petrillo M, Fumarola EM, et al. Percutaneous microwave ablation of uterine fibroids: correlation between shrinkage and trend symptoms. Minim Invasive Ther Allied Technol. 2021;30(1):33–39.
- Hai N, Zhang J, Xu R, et al. Percutaneous microwave ablation with artificial ascites for symptomatic uterine adenomyosis: initial experience. Int J Hyperthermia. 2017;33(6):646–652.
- Lin XL, Hai N, Zhang J, et al. Comparison between microwave ablation and radiofrequency ablation for treating symptomatic uterine adenomyosis. Int J Hyperthermia. 2020;37(1):151–156.
- Zhang S, Wang K, Di A, et al. Ultrasound-guided percutaneous microwave ablation of adenomyosis: a narrative review. Ann Palliat Med. 2021;10(11):12003–12011.
- Multi-center Research Collaboration Group of Percutaneous Microwave/Radiofrequency Ablation for Uterine Leiomyoma in China. Guidelines for clinical application of ultrasound-guided percutaneous microwave (radiofrequency) ablation in the treatment of uterine fibroids (2017). Chin J Med Ultrasound. 2018;15:90–94.
- Rabinovici J, Inbar Y, Revel A, et al. Clinical improvement and shrinkage of uterine fibroids after thermal ablation by magnetic resonance-guided focused ultrasound surgery. Ultrasound Obstet Gynecol. 2007;30(5):771–777.
- Morita Y, Takeuchi S, Hikida H, et al. Decreasing margins to the uterine serosa as a method for increasing the volume of fibroids ablated with magnetic resonance-guided focused ultrasound surgery. Eur J Obstet Gynecol Reprod Biol. 2009;146(1):92–95.
- Zhao W, Chen J, Zhang L, et al. Feasibility of ultrasound-guided high intensity focused ultrasound ablating uterine fibroids with hyperintense on T2-weighted MR imaging. Eur J Radiol. 2013;82(1):e43–e49.
- Lei F, Jing Z, Bo W, et al. Uterine myomas treated with microwave ablation: the agreement between ablation volumes obtained from contrast-enhanced sonography and enhanced MRI. Int J Hyperth. 2014;30(1):11–18.
- Xu C, Tang Y, Zhao Y, et al. Use of contrast-enhanced ultrasound in evaluating the efficacy and application value of microwave ablation for adenomyosis. J Can Res Ther. 2020;16(2):365.
- Riccabona M, Nelson TR, Pretorius DH, et al. Distance and volume measurement using three-dimensional ultrasonography. J Ultrasound Med. 1995;14(12):881–886.]
- Lyshchik A, Drozd V, Schloegl S, et al. Three-dimensional ultrasonography for volume measurement of thyroid nodules in children. J Ultrasound Med. 2004;23(2):247–254.
- Chen X, Hu S, Lv G. Application of 2- and 3-dimensional sonography using the virtual organ computer-aided analysis technique to measure the hippocampal formation and its correlation with corrected gestational age in neonates. J Ultrasound Med. 2018;37(3):683–688.
- Ahmed AI, Aldhaheri SR, Rodriguez-Kovacs J, et al. Sonographic measurement of cervical volume in pregnant women at high risk of preterm birth using a geometric formula for a frustum versus 3-dimensional automated virtual organ computer-aided analysis. J Ultrasound Med. 2017;36(11):2209–2217.
- Albers M, Buisman E, Kahn RS, et al. Intra- and interobserver agreement for fetal cerebral measurements in 3D-ultrasonography. Hum Brain Mapp. 2018;39(8):3277–3284.
- Luo W, Numata K, Morimoto M, et al. Role of sonazoid-enhanced three-dimensional ultrasonography in the evaluation of percutaneous radiofrequency ablation of hepatocellular carcinoma. Eur J Radiol. 2010;75(1):91–97.
- Dong FJ, Xu JF, Du D, et al. 3D analysis is superior to 2D analysis for contrast-enhanced ultrasound in revealing vascularity in focal liver lesions - a retrospective analysis of 83 cases. Ultrasonics. 2016;70:221–226.
- Stoelinga B, Juffermans L, Dooper A, et al. Contrast-Enhanced ultrasound imaging of uterine disorders: a systematic review. Ultrason Imaging. 2021;43(5):239–252.
- Xu EJ, Lv SM, Li K, et al. Immediate evaluation and guidance of liver cancer thermal ablation by three-dimensional ultrasound/contrast-enhanced ultrasound fusion imaging. Int J Hyperthermia. 2018;34(6):870–876.
- Cao J, Dong Y, Mao F, et al. Dynamic three-dimensional contrast-enhanced ultrasound to predict therapeutic response of radiofrequency ablation in hepatocellular carcinoma: preliminary findings. Biomed Res Int. 2018;2018:6469703–6469708.
- Sagberg K, Eskild A, Sommerfelt S, et al. Placental volume in gestational week 27 measured by three-dimensional ultrasound and magnetic resonance imaging. Acta Obstet Gynecol Scand. 2021;100(8):1412–1418.
- Xiao LL, Li YJ, Ma F, et al. Preoperative assessment of the accuracy of breast cancer size measured by two-dimensional ultrasound, three-dimensional volume ultrasound and ultrasound strain elastography and its influencing factors. Chin J Ultrasonography. 2021;30:414–419.
- Riccabona M, Nelson TR, Pretorius DH. Three-dimensional ultrasound: accuracy of distance and volume measurements. Ultrasound Obstet Gynecol. 1996;7(6):429–434.
- Heusinger K, Löhberg C, Lux MP, et al. Assessment of breast cancer tumor size depends on method, histopathology and tumor size itself. Breast Cancer Res Treat. 2005;94(1):17–23.
- Ko KH, Son EJ, Kim IW. Accuracy of ultrasound for preoperative assessment of tumor size in patients with newly diagnosed breast cancer: is it affected by the background parenchymal echotexture? J Ultrasound Med. 2018;37(11):2621–2630.
- Lian X, Xu Z, Zheng L, et al. Reference range of fetal thorax using two-dimensional and three-dimensional ultrasound VOCAL technique and application in fetal thoracic malformations. BMC Med Imaging. 2021;21(1):34.
- Bartolotta TV, Sidoti PA, Cannella R, et al. Focal liver lesions: interobserver and intraobserver agreement of three-dimensional contrast-enhanced ultrasound-assisted volume measurements. Ultrasonography. 2021;40(3):333–341.
- Sidhu PS, Cantisani V, Dietrich CF, et al. The EFSUMB guidelines and recommendations for the clinical practice of contrast-enhanced ultrasound (CEUS) in non-hepatic applications: update 2017 (long version). Ultraschall Med. 2018;39(2):e2–e44.
- Kessner R, Nakamoto DA, Kondray V, et al. Contrast-enhanced ultrasound guidance for interventional procedures. J Ultrasound Med. 2019;38(10):2541–2557.
- Wang YJ, Zhang PH, Zhang R, et al. Predictive value of quantitative uterine fibroid perfusion parameters from contrast-enhanced ultrasound for the therapeutic effect of high-intensity focused ultrasound ablation. J Ultrasound Med. 2019;38(6):1511–1517.