
 ?Mathematical formulae have been encoded as MathML and are displayed in this HTML version using MathJax in order to improve their display. Uncheck the box to turn MathJax off. This feature requires Javascript. Click on a formula to zoom.
Abstract
Some heat shock proteins (HSPs) have been shown to influence tumor prognosis, but their prognostic significance in colorectal cancer (CRC) remains unclear. This study explored the prognostic significance of HSP-related genes in CRC. Transcriptional data and clinical information of CRC patients were obtained from The Cancer Genome Atlas (TCGA) database, and a literature search was conducted to identify HSP-related genes. Using Least Absolute Selection and Shrinkage Operator (LASSO) regression and univariate/multivariate Cox regression analyses, 12 HSP-related genes demonstrating significant associations with CRC survival were successfully identified and employed to formulate a predictive risk score model. The efficacy and precision of this model were validated utilizing TCGA and Gene Expression Omnibus (GEO) datasets, demonstrating its reliability in CRC prognosis prediction. gene ontology (GO) and Kyoto Encyclopedia of Genes and Genomes (KEGG) enrichment analyses revealed significant disparities between high- and low-risk groups in chromatin remodeling biological functions and neutrophil extracellular trap formation pathways. Single sample gene set enrichment analysis (ssGSEA) further revealed differences in immune cell types and immune functional status between the two risk groups. Differential analysis showed higher expression of immune checkpoints within the low-risk group, while the high-risk group exhibited notably higher Tumor Immune Dysfunction and Exclusion (TIDE) scores. Additionally, we predicted the sensitivity of different prognosis risk patients to various drugs, providing potential drug choices for tailored treatment. Combined, our study successfully crafted a novel CRC prognostic model that can effectively predict patient survival, immune landscape, and treatment response, providing important support and guidance for CRC patient prognosis.
1. Introduction
Colorectal cancer (CRC) represents a malignancy originating in the colon and rectum, posing a significant threat to individuals’ intestinal health and causing considerable disruption to their daily lives [Citation1]. The incidence of CRC is closely associated with factors such as race, geographic location, lifestyle, and diet [Citation2, Citation3]. Early-stage CRC typically presents with no symptoms, but as the disease progresses, it may manifest symptoms such as rectal bleeding, diarrhea, and localized abdominal pain. In advanced stages, systemic symptoms like anemia and weight loss may become evident [Citation4]. Despite the development of various early screening methods over the past few decades, including advanced screening programs involving fecal occult blood testing, colonoscopy, and noninvasive imaging techniques, the incidence and mortality rates of CRC have steadily declined [Citation5]. Nevertheless, there is a concerning trend of the disease burden shifting toward younger patients with a greater tendency for late-stage metastasis [Citation2]. The 5-year survival rate for early-stage CRC individuals is approximately 90%, whereas for locally advanced individuals, it drops to around 70%, and for metastatic patients, it plummets to just 15% [Citation6]. Therefore, there exists an imperative demand for novel prognostic factors to more accurately identify the prognosis risk of CRC individuals.
Heat shock proteins (HSPs) constitute a category of proteins synthesized by cells in reaction to stressful environmental conditions. Their primary function is to assist cells in coping with various stressors and stimuli, such as high temperatures, hypoxia, and oxidative stress [Citation7]. The inducible promoters of HSP genes, which can be activated to a certain extent by various compounds, with heat being the most effective mode of activation, are largely responsible for this enhanced stress resistance [Citation8]. Consequently, HSP genes have long been recognized for their potential in gene therapy regulation. Previous studies have developed lipid-based template gold nanoparticles that enhance tumor suppression through cooperative action with HSPs and photothermal temperature [Citation9]. The overexpression of HSPs, particularly HSP70 and HSP90 limits the efficacy of low-temperature photothermal therapy. In a recent study, Liu et al. [Citation10] demonstrated that inhibiting the expression of HSPs enhanced the effectiveness of low-temperature photothermal therapy. Collectively, these findings underscore the significant potential of HSPs in the context of thermal therapy.
Several studies have indicated that high levels of HSPs are correlated with the growth and spread of cancer cells. They can promote tumor growth by modulating the immune response, facilitating the growth of new blood vessels to supply the tumor, and influencing tumor-related signaling pathways [Citation11–13]. HSPs are closely linked to the prognosis and therapeutic approaches for various cancer types, encompassing CRC, bladder cancer, and lung cancer [Citation14–17]. Research by Huang et al. [Citation18] found that CRC patients exhibiting high levels of HSP27 expression experience significantly reduced overall survival, and silencing HSP27 can mitigate tumor progression. Guo et al. [Citation19] ascertained that low expression of HSP60 disrupts the homeostasis of mitochondrial proteins, leading to an accumulation of adenine, which in turn triggers the AMPK signaling pathway to suppress protein translation and CRC cell proliferation. Additionally, research has shown that Hsp90 inhibitors can reduce the growth of CRC tumors by lowering the levels of macrophage migration inhibitory factor without affecting organoids derived from healthy epithelial cells [Citation20]. Given the findings from these studies, identifying HSP-related genes for prognostic assessment in CRC individuals may hold significant importance.
In our study, we selected 12 reliable HSP-related genes from The Cancer Genome Atlas (TCGA)-CRC dataset to establish a prognostic model. We also dissected the relationships between different prognostic patients and factors such as the immune microenvironment, immunotherapy, and sensitivity to anti-tumor drugs. This research aimed to underscore the utility of HSPs in evaluating the prognosis of CRC individuals via comprehensive analysis of gene expression profile data.
2. Materials and methods
2.1. Data acquisition
Patient data for CRC training set (tumor: 647, normal: 51) were provided by TCGA database (https://portal.gdc.cancer.gov/). To further validate our research results, we downloaded the CRC validation set, GSE33113, from Gene Expression Omnibus (GEO) database (https://www.ncbi.nlm.nih.gov/geo/). This validation set included primary tumor samples from 90 CRC patients.
2.2. Analysis of HSP-related genes
We initially collected 97 genes related to HSPs from the literature [Citation21] (Supplementary Table 1). A protein-protein interaction (PPI) network was constructed utilizing STRING database (https://cn.string-db.org/cgi/input.pl). While building the PPI network, we set the “minimum required interaction score” option to “high confidence” (0.900) to ensure the selection of highly credible interaction relationships. This PPI network aids in understanding the biological connections and functional interactions among these genes. Chi-square tests were conducted on copy number variations (CNVs) in the normal and tumor groups in TCGA dataset, and “RCircos” package was used to plot the specific chromosomal locations of HSP-related genes’ CNVs in CRC.
2.3. Establishment of the prognostic model
Univariate Cox analysis was conducted on HSP-related genes employing “survival” package in tumor samples from the training set. During this process, a significance level of 0.05 was set to screen for genes with statistical significance as important prognostic factors. Least Absolute Selection and Shrinkage Operator (LASSO) regression analysis was executed utilizing the “glmnet” and “survival” packages. LASSO regression is a regularization method that assists in selecting the most predictive features to build a simpler and more generalizable model. Through LASSO regression, we identified which HSP-related genes played a significant role in overall survival prediction. Finally, multivariate Cox regression analysis was carried out using the “survival” package to construct a comprehensive prognostic risk score model. In this step, other potential influencing factors, such as age, gender, tumor stage, etc., were considered to determine the relative risks of each gene. By performing univariate Cox regression, LASSO regression, and ultimately, multivariable Cox regression, it is possible to progressively screen, select, and adjust predictive factors, thereby constructing a more accurate, concise, and reliable survival prediction model. This methodology helps mitigate the risk of overfitting and enhance the model’s interpretability and generalizability.
The calculation formula of the specific prognostic risk score model was as follows: Riskscore= In this formula, “coef” represents the coefficient of the feature gene obtained by multivariate regression analysis, and “expression” represents the relative expression level after the feature gene normalization [Citation22]. We could use the Riskscore to predict the survival outcome of patients.
2.4. Performance evaluation and verification of the prognostic model
Riskscores for patients were calculated ground on their gene expression profiles. The median value of Riskscores for individuals was utilized as the threshold for categorizing individuals into high- and low-risk groups. Individuals in the validation set were also categorized into two risk groups in line with the defined threshold. Riskscore distribution plots, survival status distribution plots, gene expression heatmaps, survival curves, and receiver operator characteristic (ROC) curves were generated to illustrate differences between the two risk groups. The same analysis steps were performed using patient data from the external validation set, GSE33113.
2.5. Kyoto encyclopedia of genes and genomes (KEGG) and gene ontology (GO) analyses
Differential gene analysis was conducted using the “edgeR” package between high-risk and low-risk groups. In this analysis, genes with significant differential expression, including those with substantial fold changes (|logFC|>1) and a False Discovery Rate (FDR) of less than 0.05 after multiple testing correction, were selected. Subsequently, the “clusterProfiler” package was utilized for KEGG and GO enrichment analyses, with the outcomes visualized using “enrichplot” package. Through the results of enrichment analysis, we could learn the functions and pathways enriched by these differential genes.
2.6. Establishment and verification of nomogram based on the prognostic model
Combined with clinical information of CRC samples, we performed differential analysis of Riskscores among patients with different T, M, N, and stage characteristics to understand the association between different clinical features and survival risk of patients. Univariate and multivariate Cox regression analyses for age, gender, stage, TNM staging, and Riskscore were conducted using the “survival” and “forestplot” packages. This helped identify which features were independent prognostic factors for CRC. Nomogram and calibration curves were established utilizing the “survival”, “regplot”, and “rms” packages. Nomogram was utilized to forecast the 1-year, 3-year, and 5-year survival rates, taking into account Riskscores as well as other clinical variables. The nomogram that integrated the Riskscore and clinicopathological factors also predicted the survival outcome of patients. The degree of agreement between the predicted outcome and the actual outcome is shown by the calibration curve.
2.7. Exploration of the immune landscape in high- and low-risk CRC patients
The “estimate” package was executed to assess the tumor microenvironment (TME) for each sample in the two risk groups. Immune scores, stromal scores, ESTIMATE scores, and tumor purity scores were calculated. Wilcoxon tests were conducted, and violin plots were drawn to compare the scores between two risk groups. Using the Single sample gene set enrichment analysis (ssGSEA) method, the levels of immune cells and immune functions in high- and low-risk groups were determined. Wilcoxon tests were performed, and boxplots were generated to visualize the differences.
2.8. Prediction of immune response to therapy
We calculated the expression of immune checkpoint genes in high- and low-risk groups and compared the differences using Wilcoxon tests. This analysis helped assess whether there were significant disparities in immune checkpoint expression between the two risk groups. Furthermore, we used Tumor Immune Dysfunction and Exclusion (TIDE) algorithm to score the two groups to evaluate the potential responsiveness to immune therapy. As a computational tool used for predicting tumor immune therapy response, the TIDE algorithm is based on the understanding of immune suppression and evasion mechanisms within the tumor microenvironment and utilizes analysis of tumor gene expression data to assess patients’ potential response to immune-based therapies. T-tests were conducted on the TIDE scores of both groups to determine if there were notable disparities in TIDE scores. Finally, boxplots were created using the “ggpubr” package to visualize the distribution of TIDE scores in the two groups. These boxplots aided in comparing differences in immune checkpoint expression and TIDE scores between the two groups, providing important insights for further research on immune treatment strategies.
2.9. Drug sensitivity analysis
To predict drugs that may be suitable for the high- and low-risk groups, we first integrated the transcriptomic data of two groups with drug sensitivity data from the GDSC database. This integration included gene expression data from patients in both groups and drug sensitivity data from the GDSC database. Using the “oncoPredict” package, we conducted correlation analysis to ascertain drugs whose sensitivity was related with the gene expression patterns of patients in two groups. Finally, a T-test was performed on the IC50 values of relevant drugs for the two risk groups to determine if there were notable disparities in drug sensitivity between the two groups. A high IC50 value for a drug indicates that the patient is not sensitive to the drug.
3. Results
3.1. Analysis of HSP-related genes
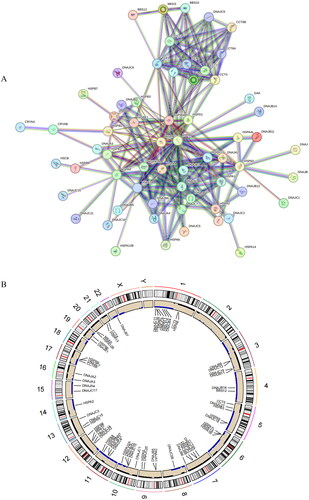
We utilized a PPI network to enhance comprehension of the interactions and regulatory mechanisms of HSPs. This network encompassed 91 nodes and 240 edges, with an average node degree of 5.27 (). It could be seen that there was a strong interaction relationship between these HSP-related genes. To attain a more comprehensive understanding of genetic variations in CRC patients, we presented the CNVs of HSP-related genes in CRC across 24 chromosomes, along with information about these variations (). This in-depth investigation contributed to an enhanced understanding of the molecular basis of HSPs in CRC.
Figure 1. Analysis of HSP-related genes. (A) PPI network constructed based on HSP-related genes. Circles represent genes and lines represent interactions. (B) CNV chromosome representation of HSP-related genes. The dots corresponding to the gene names indicate the specific location of the gene on the chromosome.
3.2. Construction of CRC prognostic model using selected prognostic genes
In order to provide more accurate predictions and personalized treatment decision support to clinical physicians and patients, we constructed a prognostic model based on HSP-related genes through regression analysis. Firstly, we carried out univariate Cox regression analysis to screen HSP-related genes significantly associated with survival (p < 0.05). As a result, we successfully identified 17 survival-related differentially expressed genes (DEGs) (). To filter out less significant prognostic factors and ensure the accuracy and reliability of our model, we employed LASSO regression to determine 12 prognostic genes (). Finally, these 12 prognostic genes were used in a multivariate Cox regression analysis to establish the prognostic model (). The model formula is as follows:
Figure 2. Construction of the prognostic model.(A) LASSO coefficient spectrum obtained from LASSO regression. Based on the graph, the optimal λ value is selected. The two dashed lines indicate two specific λ values: lambda.min and lambda.1se. The lambda.1se model is the simplest as it utilizes fewer genes, while lambda.min achieves slightly higher accuracy by incorporating a slightly larger number of genes. In this case, lambda.min is chosen for further analysis. (B) Coefficient distribution plot generated for the logarithm (λ) sequence in the LASSO model. Each curve in the figure represents a gene, the ordinate is the coefficient of the gene, and the abscissa is log(λ). (C) Forest plot of the multivariate Cox regression model, including 12 prognostic model genes and their corresponding coefficients. Hazard ratio (HR) > 1, Risk factors; HR < 1, Protective factors. *indicates P < 0.05; **indicates P < 0.01; ***indicates P < 0.001.
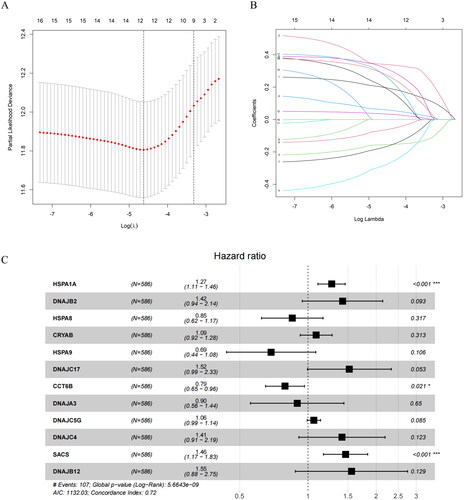
Table 1. Results of univariate Cox regression analysis.
3.3. Performance evaluation and validation of the CRC prognostic model in TCGA training set
To evaluate the performance of the prognostic model, we performed a series of validation tests. Using this model, we conducted risk assessment of clinical samples from TCGA. During this process, we divided all samples from the training and validation sets into high-risk and low-risk groups, respectively (). Reduction in Riskscores was concerned with better survival in more patients, indicating a more favorable prognosis. Conversely, high Riskscores were related with more deaths, signifying a poorer prognosis (). To delve deeper into the expression patterns of prognostic model genes in both groups, we generated a gene expression heatmap. In the high-risk group, HSPA1A, DnaJ Heat Shock Protein Family (Hsp40) Member C5 Gamma (DNAJC5G), alpha B-crystallin (an important member of the small heat shock proteins; CRYAB), SACS, DNAJB2, DnaJ heat shock protein family (Hsp40) member B12 (DNAJB12), DNAJC17, and DnaJ Heat Shock Protein Family (Hsp40) Member C4 (DNAJC4) were found highly expressed, while in the low-risk group, CCT6B, DnaJ homolog subfamily A member 3 (DNAJA3), heat shock protein family A member 8 (HSPA8), and heat shock protein family A member 9 (HSPA9) were highly expressed (). Survival analysis demonstrated that the low-risk group exhibited a higher survival rate than the high-risk group (). To assess the predictive ability of the prognostic model, we drew ROC curves for 1-year, 3-year, and 5-year survival, with corresponding area under the curve (AUC) values of 0.75, 0.72, and 0.74, indicating excellent performance of our prognostic model in predicting patient survival (). Moreover, when compared to the prognostic ability of individual feature genes, the AUC values for single feature genes were mostly below 0.6, whereas the multi-gene prognostic model exhibited AUC values above 0.7 in both training and validation sets (Supplementary Figure 1). These results underscored the effectiveness of the prognostic model we developed for risk assessment in patients. Next, we applied this model to GEO validation set to further validate its predictive performance, with results further confirming the robustness and reliability of our model ().
Figure 3. Performance evaluation and validation of the CRC prognostic model in TCGA. (A) Distribution of Riskscore in high/low-risk group patients in TCGA. The high-risk group is indicated on the right of the dotted line and the low-risk group on the left of the dotted line. (B) Distribution of survival status in high/low-risk group patients in TCGA. The dashed line on the right represents the high-risk group, while the dashed line on the left represents the low-risk group. Each data point represents an individual patient. The red dots indicate patients who experienced death at the corresponding time point, while the green dots represent patients who were still alive at the corresponding time point. (C) Heatmap depicting the expression levels of prognostic genes in high/low-risk groups of patients in TCGA. The red line represents gene expression up-regulation, while the green line represents gene expression down-regulation. (D) Survival curve analysis of high/low-risk group patients in TCGA. (E) ROC curves demonstrating the accuracy of the model in predicting 1-year, 3-year, and 5-year survival in CRC patients. The X-axis represents the specificity of the model, while the Y-axis represents the sensitivity of the model. The larger the AUC, the higher the sensitivity and specificity of the model. Therefore, a larger AUC value indicates a higher level of sensitivity and specificity in the model.
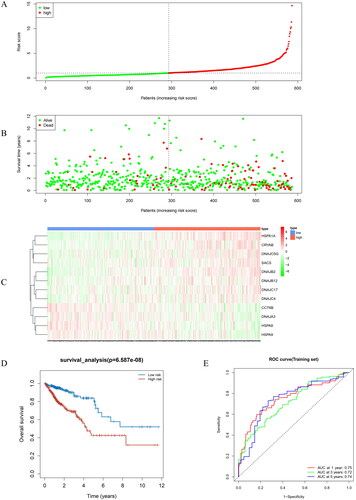
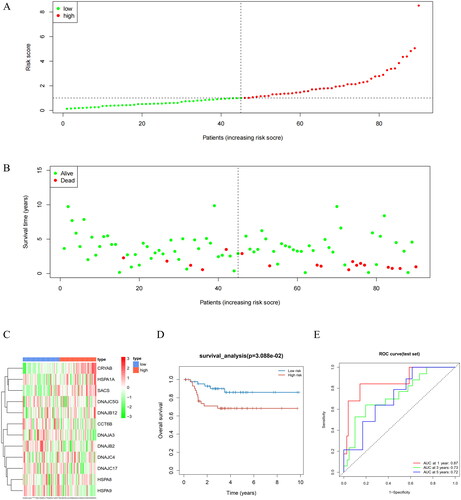
Figure 4. Performance evaluation and validation of the prognostic model in the GEO validation set. (A) Distribution of Riskscore in high/low-risk group patients in the GEO validation set. The high-risk group is indicated on the right of the dotted line and the low-risk group on the left of the dotted line. (B) Distribution of survival status in high/low-risk group patients in the GEO validation set. The dashed line on the right represents the high-risk group, while the dashed line on the left represents the low-risk group. Each data point represents an individual patient. The red dots indicate patients who experienced death at the corresponding time point, while the green dots represent patients who were still alive at the corresponding time point. (C) Heatmap illustrating the expression levels of prognostic genes in high/low-risk groups of patients in the GEO validation set. The red line represents gene expression up-regulation, while the green line represents gene expression down-regulation. (D) Survival curve analysis of high/low-risk group patients in the GEO validation set. (E) ROC curves demonstrating the accuracy of the model in predicting 1-year, 3-year, and 5-year survival in CRC patients. The X-axis represents the specificity of the model, while the Y-axis represents the sensitivity of the model. The larger the AUC, the higher the sensitivity and specificity of the model. Therefore, a larger AUC value indicates a higher level of sensitivity and specificity in the model.
3.4. Clinical significance of prognostic features and nomogram
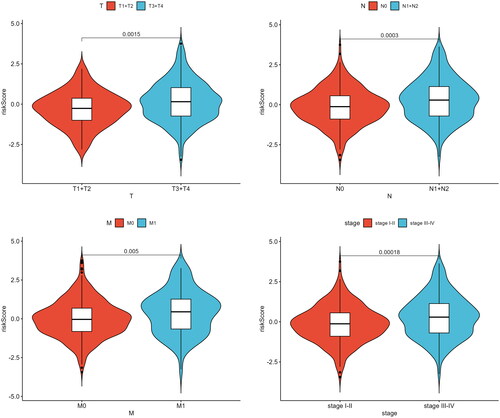
In our previous research, we observed that patients with high Riskscores exhibited lower survival rates. Therefore, we further investigated the association between Riskscore and disease progression parameters (T, N, M, and staging) by conducting a t-test to analyze the differences between different groups. The results showed that Riskscores were significantly higher in advanced-stage patients in comparison to early-stage patients (p < 0.05) (). This demonstrated that Riskscore could reflect the risk level of patients and are associated with the tumor development.
Figure 5. Differences in Riskscore among patients in T, N, M, and different stages. Different clinical features were divided into 2 stages. P < 0.05 represents a significant difference. For example, there is a significant difference in Riskscore between T1 + T2 and T3 + T4 patients.
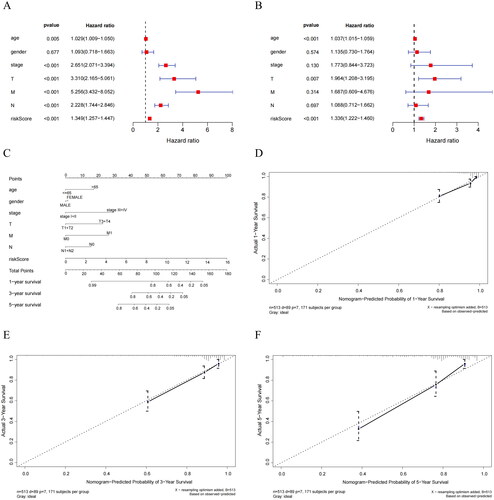
To investigate the independent predictive ability of the Riskscore, we performed univariate and multivariate Cox regression analyses by incorporating Riskscore along with clinical pathological features (T, N, M, age, stage, gender). We found that Riskscore had significant statistical significance (). This indicated that Riskscore possesses independent prognostic value in predicting patient survival, unaffected by other clinical factors. Thus, Riskscore can be considered as an independent prognostic factor. After establishing the predictive capability of Riskscore, we combined it with clinical information and generated nomogram that integrated clinical factors and Riskscore (). Additionally, by creating calibration curves for 1-year, 3-year, and 5-year survival, we validated the high degree of fit between the predicted survival rates from the nomogram and actual survival rates (). These results unequivocally demonstrated that the nomogram exhibited excellent predictive performance and could reliably be used to assess patient prognosis, providing clinicians with a powerful tool for guiding treatment decisions.
Figure 6. Independent prognostic analysis of Riskscore and nomogram assessment. (A) Results of univariate Cox regression analysis for different features. Hazard ratio (HR) > 1, Risk factors; HR < 1, Protective factors. (B) Results of multivariate Cox regression analysis for different features. (C) Nomogram of the prognostic model score combined with clinical information. Column line plots are generated by constructing a multivariable regression model to assess the contribution of various influencing factors (magnitude of regression coefficients) on the outcome variable. Each level of each influencing factor is assigned a score based on its impact within the model, and these scores are then summed to obtain a total score. Finally, using the functional transformation relationship between the total score and the probability of the outcome event, the predicted value for the occurrence of the outcome event for an individual is calculated. (D-F) Calibration curves of the nomogram to predict 1-year, 3-year, and 5-year risk. The calibration curve is a scatter plot of the actual occurrence rate versus the predicted occurrence rate. It is used as an indicator to evaluate the accuracy of the column line plot predictions.
3.5. Significant differences in biological functions and pathways between different risk groups of patients
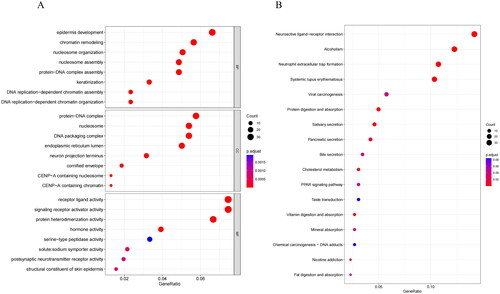
To gain deeper insights into the relationship between Riskscore and biological functions and pathways, we conducted differential gene analysis and identified 639 genes with significant expression differences between two risk groups (Supplementary Table 2). Subsequently, we utilized GO and KEGG analyses on these DEGs to understand their enrichment in biological processes and signaling pathways, helping us better comprehend their functions. GO analysis unmasked that DEGs were primarily concentrated in biological processes like epidermis development, chromatin remodeling, cellular components like protein-DNA complex, nucleosome, and molecular functions like receptor ligand activity, signaling receptor activator activity (). KEGG results indicated that DEGs were mainly enriched in neuroactive ligand-receptor interaction, alcoholism, and neutrophil extracellular trap formation pathways ().
Figure 7. Biological differences analysis between high- and low-risk groups. (A) GO annotations of DEGs between high/low-risk groups. (B) KEGG enrichment analysis of DEGs between high/low-risk groups. The vertical axis represents each function or pathway, the horizontal axis represents the Gene Ratio corresponding to each function or pathway, bubble size indicates the number of genes enriched in the function or pathway, and bubble color represents the P-Value.
3.6. Analysis of differences in the TME and immune cell infiltration between high- and low-risk groups
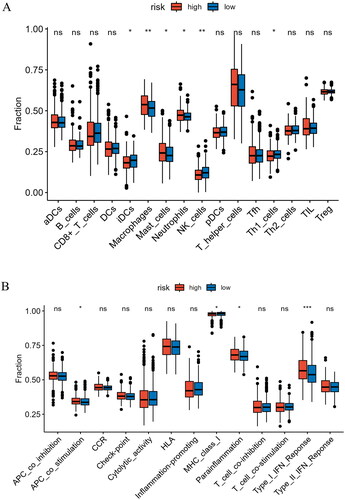
HSP is essential for human immune response [Citation23]. Therefore, we conducted a comprehensive analysis of immune cell infiltration levels and immune functional status in high- and low-risk groups. We observed that in the high-risk group, iDCs, NK cells, and Th1 cells were significantly lower compared to the low-risk group, while Macrophages, Mast cells, and Neutrophils were significantly higher than in the low-risk group (p < 0.05) (). Furthermore, we observed significant differences in immune functional status between the high- and low-risk groups. Specifically, immune functions related to APC co-stimulation, Parainflammation, and Type I IFN Response were notably higher in the high-risk group (p < 0.05) (). These results yielded valuable insights into the immune distinctions between high- and low-risk patients, offering more information and understanding for personalized treatment and prognosis assessment.
Figure 8. Analysis of immune cell abundance and immune function in high- and low-risk groups. (A) Expression levels of immune cells in two groups. (B) Levels of immune function in two groups. *indicates P < 0.05; **indicates P < 0.01; ***indicates P < 0.001; ns indicates P > 0.05.
3.7. Immune checkpoint and immunotherapy analysis
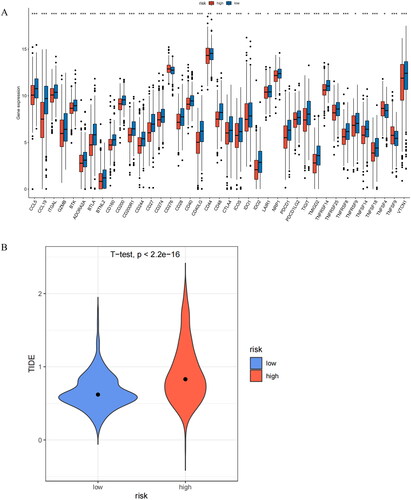
The expression levels of immune checkpoints and patients’ TIDE scores can provide indirect insights into the patients’ response to immune therapy. We conducted an analysis of immune checkpoint expression, with outcomes showing significant differences in the expression of all immune checkpoints between the two risk groups (p < 0.05). Importantly, the expression of immune checkpoints was generally higher in the low-risk group (p < 0.05) (). This finding suggested that patients in the low-risk group were more likely to respond positively to immunotherapy, as high expression of immune checkpoints was typically associated with better immunotherapy responses. To investigate the potential immunotherapy response of patients, we evaluated the TIDE scores for both groups, with results showing that the high-risk group had significantly higher TIDE scores (). This result suggested that the high-risk group might have a higher likelihood of immune evasion, indicating that tumors in the high-risk group may be more resistant to immune surveillance and attack, potentially reducing the effectiveness of immunotherapy.
Figure 9. Analysis of immune checkpoint expression and prediction of immune response to therapy. (A) Levels of immune checkpoint expression between two risk groups. (B) Differential assessment of TIDE scores in two risk groups. *indicates P < 0.05; **indicates P < 0.01; ***indicates P < 0.001; ns indicates P > 0.05.
3.8. Drug sensitivity analysis in two risk groups
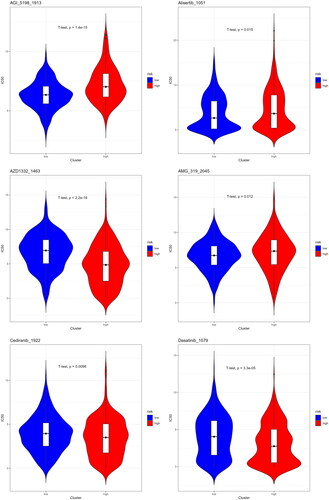
To find drugs with higher sensitivity to different risk populations, we performed a drug prediction analysis using the GDSC database. We observed significant differences in IC50 values for various drugs between high- and low-risk group individuals. Specifically, high-risk group patients had significantly higher IC50 values for AGI_5198_1913, Alisertib_1051, and AMG_319_2045 compared with the low-risk group, while they had significantly lower IC50 values for AZD1332_1463, Cediranib_1922, and Dasatinib_1097 in contrast to the low-risk group (p < 0.05) (). The lower the IC50 value, the better the therapeutic effect of the drug on this risk group. This finding was clinically significant, indicating that CRC patients with different prognoses might exhibit different drug sensitivities to certain medications.
Figure 10. Sensitivity analysis of high- and low-risk groups to different drugs. The lower the IC50 value of a drug, the better its therapeutic efficacy.
4. Discussion
CRC is a prevalent malignancy in the digestive tract, characterized by relatively high incidence and mortality rates [Citation24]. Despite significant progress in CRC screening and treatment, concerns persist regarding the high risk of recurrence and metastasis concerned with this disease, factors that can lead to unfavorable clinical outcomes [Citation25]. Therefore, there is an urgent need for accurate prognostic assessment of CRC patients to provide them with improved treatment strategies. We have developed and validated a stable and effective prognostic gene model ground on 12 HSP genes with prognostic characteristics. This model held potential value in predicting patient survival, immune status, and immune evasion.
The 12 genes identified here have previously been shown to play important roles in various cancers and diseases, including CRC. Taglia et al. [Citation26] demonstrated that Gastrin-Releasing Peptide and its receptor induce the upregulation of HSPA1A (HSPA1A, also known as HSP70 or HSP72, is a member of the HSP1 protein family encoded by the HSPA70A gene. HSPA1A is an inducible HSP70 protein that primarily functions protects cells from heat stressCitation27] through the focal adhesion kinase signaling pathway, promoting binding of CD16+ and CD94+ natural killer cells and ultimately leading to the lysis of colon cancer cells. Additionally, studies have found that heat therapy can induce the synthesis of HSPA1A and enhance telomerase activity [Citation28]. Misawa et al. [Citation29] found that DNAJC5G can distinguish patients with oral and pharyngeal cancer from healthy individuals, and the methylation status of DNAJC5G is tightly linked with the recurrence of oral and pharyngeal cancer. CRYAB is involved in multiple signaling pathways, including apoptosis, inflammation, and oxidative stress [Citation30]. One study suggested that CRYAB promotes cancer stem cell formation in CRC by activating the Wnt/β-catenin pathway, making it a feasible target for therapeutic strategies [Citation31]. Another study reported a significant correlation between CRYAB expression and tumor grade, with lower expression in poorly differentiated tumors (G3) [Citation32]. Mutations in SACS (The SACS gene encodes a large 520-kDa multidomain protein of 4579 amino acids, called sacsin.) and DNAJB2 are associated with neurodegenerative diseases [Citation33, Citation34]. DNAJB12 is located in the endoplasmic reticulum membrane and plays a vital role in maintaining protein stability and correct folding within cells [Citation35]. Its degradation during severe endoplasmic reticulum stress contributes to the accumulation of BOK (Members of the ER-associated BCL-2 family), triggering endoplasmic reticulum stress-induced apoptosis in cancer cells [Citation36]. DNAJC17 (DNAJ protein in group C) belongs to the heat shock protein 40 (HSP40) family and has been identified as a favorable prognostic factor in osteosarcoma patients [Citation37, Citation38]. Studies by Esworthy et al. [Citation39] have also linked the DNAJC17 gene, located in a 119 Mbp region on chromosome 2, to the severity and susceptibility of colitis caused by cytokine defects. Zhou et al. [Citation40] identified five genes, including DNAJC4, as key genes in patients with benign prostatic hyperplasia who were infected with COVID-19. CCT6B (chaperonin containing TCP-1) is a subunit of the TCP1 ring complex, which is involved in protein folding and stability [Citation41]. Yao et al. [Citation42] reported that decreased expression of CCT6B is concerned with lower survival rates in hepatocellular carcinoma patients, suggesting it may be a potential tumor suppressor gene. DNAJA3 is a tumor suppressor that regulates apoptosis signal transduction, B-cell development, and immune function [Citation43, Citation44]. Wang et al. [Citation45] demonstrated that DNAJA3 regulates the migration and invasion of gastric cancer cells and may serve as a poor prognostic factor in gastric cancer. HSPA8 and HSPA9 are mitochondrial members of the HSP70 family, primarily located in mitochondria, and are involved in maintaining the folding and stability of mitochondrial proteins [Citation46]. HSPA8 is upregulated in the early clinical stages of CRC [Citation47], and overexpression of HSPA9 is associated with the occurrence of CRC and poor prognosis [Citation48]. These genes may have crucial roles in determining the different prognoses of CRC patients, and their specific functions and mechanisms warrant further investigation.
GO and KEGG analyses revealed significant disparities between the two risk groups in terms of chromatin remodeling biological processes and the neutrophil extracellular trap formation pathway. Chromatin remodeling is a critical epigenetic mechanism involved in regulating processes such as gene transcription and cellular functions [Citation49]. Research has shown that Bromodomain-containing protein 4 (BRD4, a Bromodomain and Extraterminal (BET) protein family member) phosphorylation induces chromatin remodeling by concurrent binding to enhancers and super-enhancers, facilitating interactions with signal transducer and activator of transcription 3 (STAT3) to promote cancer gene transcription, thereby promoting CRC progression [Citation50]. Additionally, it has been discovered that CRC metastatic cells undergo specific chromatin remodeling in the liver, suggesting that targeting metastasis-specific chromatin remodeling could be a potential therapeutic strategy [Citation51]. Neutrophil extracellular traps (NETs) are extracellular mesh-like fiber structures composed of DNA, histones, granule proteins, and cytoplasmic proteins [Citation52]. The formation of NETs is complexly related to CRC and may feature in the immune response, invasion, and metastasis processes of cancer [Citation53]. Yang et al. [Citation54] found that IL-8 produced by CRC enhances the generation of NETs, thereby promoting CRC liver metastasis. Okamoto et al. [Citation55] demonstrated through experiments that neutrophil elastase released during NET formation accelerates the migration of CRC cells by activating ERK. In summary, the chromatin remodeling biological processes and neutrophil extracellular trap formation pathway may have a promoting role in CRC progression.
In cancer research, immune cell infiltration holds significant importance as it can influence tumor growth, development, and patient prognosis [Citation56]. In this study, we adopted ssGSEA method to analyze the proportion of tumor immune cell infiltration between the two risk groups. The findings revealed that the high-risk group displayed significantly elevated levels of Macrophages, Mast cells, and Neutrophils in comparison to the low-risk group. Research has suggested that tumor-associated M2 macrophages foster the migration and invasion of CRC cells [Citation57]. In line with our findings, Li et al. [Citation58] discovered that high infiltration of activated Mast cells are concerned with poorer survival outcomes in stage II-III CRC patients. Additionally, Wang et al. [Citation59] found that KIAA1199 (also known as CEMIP) drives immune suppression and CRC liver metastasis by regulating neutrophil infiltration. Several studies have emphasized the potential of targeted interventions in modulating immune cell infiltration within tumors as a therapeutic approach for cancer treatment [Citation60–62]. Therefore, targeting specific immune cell populations in patients may aid in preventing tumor progression. Immunotherapy has introduced new possibilities in the management of solid tumors, particularly through immune checkpoint blockade [Citation63]. In our study, we observed that the low-risk group generally exhibited higher expression levels of immune checkpoint molecules in contrast to the high-risk group, which suggested that patients in the low-risk group may be more suitable candidates for immune-based therapies. Our analysis further revealed that the high-risk group had tellingly higher TIDE scores in comparison to the low-risk group, suggesting an increased propensity for immune escape in high-risk group individuals. Taken together, these findings could guide the selection of more appropriate treatment strategies for CRC patients.
Despite developing and validating our model using large-scale case data, it still possesses certain limitations that warrant consideration. Firstly, data from public databases may exhibit selection biases as they are primarily derived from published studies and clinical trials, potentially not representing the entire CRC patient population. Secondly, while the model has undergone internal and external validation, its performance in real clinical settings has yet to be confirmed through prospective clinical trials. Therefore, further clinical research is necessary to validate its accuracy and reliability. Finally, despite the significant potential of HSPs in thermal therapy, further research into the specific mechanisms and clinical applications of HSPs in thermal therapy is required.
Authors’ contributions
Q T contributed to conceptualization, data curation and writing. JC Z contributed to methodology, formal analysis and revising. All authors have reviewed and approved the final manuscript.
Supplemental Material
Download Zip (1.8 MB)Disclosure statement
No potential conflict of interest was reported by the authors.
Data availability statement
The data used to support the findings of this study are available from the corresponding author upon request.
Additional information
Funding
References
- Kocarnik JM, Compton K, Dean FE, et al. Cancer incidence, mortality, years of life lost, years lived with disability, and disability-adjusted life years for 29 cancer groups from 2010 to 2019: a systematic analysis for the global burden of disease study 2019. JAMA Oncol. 2022;8(3):420–444. doi: 10.1001/jamaoncol.2021.6987.
- Siegel RL, Wagle NS, Cercek A, et al. Colorectal cancer statistics, 2023. CA Cancer J Clin. 2023;73(3):233–254. doi: 10.3322/caac.21772.
- Vallis J, Wang PP. The role of diet and lifestyle in colorectal cancer incidence and survival. In: Morgado-Diaz JA, editor. Gastrointestinal cancers. Brisbane (AU): Exon Publications, 2022, Copyright: the Authors. The authors confirm that the materials included in this chapter do not violate copyright laws. Where relevant, appropriate permissions have been obtained from the original copyright holder(s), and all original sources have been appropriately acknowledged or referenced.
- Duan B, Zhao Y, Bai J, et al. Colorectal cancer: an overview. In: Morgado-Diaz JA, editor. Gastrointestinal cancers. Brisbane (AU): Exon Publications, 2022. Copyright: the Authors. The authors confirm that the materials included in this chapter do not violate copyright laws. Where relevant, appropriate permissions have been obtained from the original copyright holder(s), and all original sources have been appropriately acknowledged or referenced.
- Hissong E, Pittman ME. Colorectal carcinoma screening: established methods and emerging technology. Crit Rev Clin Lab Sci. 2020;57(1):22–36. doi: 10.1080/10408363.2019.1670614.
- Wang Q, Shen X, Chen G, et al. Drug resistance in colorectal cancer: from mechanism to clinic. Cancers (Basel). 2022;14(12). doi: 10.3390/cancers14122928.
- Yun CW, Kim HJ, Lim JH, et al. Heat shock proteins: agents of cancer development and therapeutic targets in anti-cancer therapy. Cells. 2019;9(1):60. doi: 10.3390/cells9010060.
- Voellmy R, Zürcher O, Zürcher M, et al. Targeted heat activation of HSP promoters in the skin of mammalian animals and humans. Cell Stress Chaperones. 2018;23(4):455–466. doi: 10.1007/s12192-018-0875-4.
- Xia Y, Li C, Cao J, et al. Liposome-templated gold nanoparticles for precisely temperature-controlled photothermal therapy based on heat shock protein expression. Colloids Surf B Biointerfaces. 2022;217:112686. doi: 10.1016/j.colsurfb.2022.112686.
- Liu W, Di J, Ma Y, et al. Mitochondria-mediated HSP inhibition strategy for enhanced low-temperature photothermal therapy. ACS Appl Mater Interfaces. 2023;15(22):26252–26262. doi: 10.1021/acsami.3c00870.
- Binder RJ. Immunosurveillance of cancer and the heat shock protein-CD91 pathway. Cell Immunol. 2019;343:103814. doi: 10.1016/j.cellimm.2018.05.007.
- Calderwood SK, Gong J. Heat shock proteins promote cancer: it’s a protection racket. Trends Biochem Sci. 2016;41(4):311–323. doi: 10.1016/j.tibs.2016.01.003.
- Karademir D, Özgür A. Small molecule heat shock protein 27 inhibitor J2 decreases ovarian cancer cell proliferation via induction of apoptotic pathways. Med Oncol. 2023;40(9):250. doi: 10.1007/s12032-023-02126-2.
- Abi Zamer B, El-Huneidi W, Eladl MA, et al. Ins and outs of heat shock proteins in colorectal carcinoma: its role in carcinogenesis and therapeutic perspectives. Cells. 2021;10(11):2862. doi: 10.3390/cells10112862.
- Huang M, Dong W, Xie R, et al. HSF1 facilitates the multistep process of lymphatic metastasis in bladder cancer via a novel PRMT5-WDR5-dependent transcriptional program. Cancer Commun (Lond). 2022;42(5):447–470. doi: 10.1002/cac2.12284.
- Parma B, Wurdak H, Ceppi P. Harnessing mitochondrial metabolism and drug resistance in non-small cell lung cancer and beyond by blocking heat-shock proteins. Drug Resist Updat. 2022;65:100888. doi: 10.1016/j.drup.2022.100888.
- Wang Y, Wang X. A pan-cancer analysis of heat-shock protein 90 Beta1(HSP90B1) in human tumours. Biomolecules. 2022;12(10):1377. doi: 10.3390/biom12101377.
- Huang CY, Wei PL, Chen WY, et al. Silencing heat shock protein 27 inhibits the progression and metastasis of colorectal cancer (CRC) by maintaining the stability of stromal interaction molecule 1 (STIM1) proteins. Cells. 2018;7(12):262. doi: 10.3390/cells7120262.
- Guo J, Zhu S, Deng H, et al. HSP60-knockdown suppresses proliferation in colorectal cancer cells via activating the adenine/AMPK/mTOR signaling pathway. Oncol Lett. 2021;22(2):630. doi: 10.3892/ol.2021.12891.
- Klemke L, De Oliveira T, Witt D, et al. Hsp90-stabilized MIF supports tumor progression via macrophage recruitment and angiogenesis in colorectal cancer. Cell Death Dis. 2021;12(2):155. doi: 10.1038/s41419-021-03426-z.
- Kampinga HH, Hageman J, Vos MJ, et al. Guidelines for the nomenclature of the human heat shock proteins. Cell Stress Chaperones. 2009;14(1):105–111. doi: 10.1007/s12192-008-0068-7.
- Guo H, Wang Y, Gou L, et al. A novel prognostic model based on urea cycle-related gene signature for colorectal cancer. Front Surg. 2022;9:1027655. doi: 10.3389/fsurg.2022.1027655.
- Taha EA, Ono K, Eguchi T. Roles of extracellular HSPs as biomarkers in immune surveillance and immune evasion. Int J Mol Sci. 2019;20(18):4588. doi: 10.3390/ijms20184588.
- Siegel RL, Miller KD, Wagle NS, et al. Cancer statistics, 2023. CA Cancer J Clin. 2023;73(1):17–48. doi: 10.3322/caac.21763.
- Zhou JM, Wang L, Mao AR. Value and prognostic factors of repeat hepatectomy for recurrent colorectal liver metastasis. Hepatobiliary Pancreat Dis Int. 2023;22(6):570–576. doi: 10.1016/j.hbpd.2023.02.005.
- Taglia L, Matusiak D, Benya RV. GRP-induced up-regulation of Hsp72 promotes CD16+/94+ natural killer cell binding to Colon cancer cells causing tumor cell cytolysis. Clin Exp Metastasis. 2008;25(4):451–463. doi: 10.1007/s10585-008-9151-9.
- Stankiewicz AR, Lachapelle G, Foo CP, et al. Hsp70 inhibits heat-induced apoptosis upstream of mitochondria by preventing bax translocation. J Biol Chem. 2005;280(46):38729–38739. doi: 10.1074/jbc.M509497200.
- Kaur P, Hurwitz MD, Krishnan S, et al. Combined hyperthermia and radiotherapy for the treatment of cancer. Cancers (Basel). 2011;3(4):3799–3823. doi: 10.3390/cancers3043799.
- Misawa K, Imai A, Matsui H, et al. Identification of novel methylation markers in HPV-associated oropharyngeal cancer: genome-wide discovery, tissue verification and validation testing in ctDNA. Oncogene. 2020;39(24):4741–4755. doi: 10.1038/s41388-020-1327-z.
- Zhang J, Liu J, Wu J, et al. Progression of the role of CRYAB in signaling pathways and cancers. Onco Targets Ther. 2019;12:4129–4139. doi: 10.2147/OTT.S201799.
- Dai A, Guo X, Yang X, et al. Effects of the CRYAB gene on stem cell-like properties of colorectal cancer and its mechanism. J Cancer Res Ther. 2022;18(5):1328–1337. doi: 10.4103/jcrt.jcrt_212_22.
- Pagano C, Navarra G, Gazzerro P, et al. Association of alpha B-crystallin expression with tumor differentiation grade in colorectal cancer patients. Diagnostics (Basel). 2021;11(5):896. doi: 10.3390/diagnostics11050896.
- Bagaria J, Bagyinszky E, An SSA. Genetics of autosomal recessive spastic ataxia of charlevoix-saguenay (ARSACS) and role of sacsin in neurodegeneration. Int J Mol Sci. 2022;23(18):552. doi: 10.3390/ijms231810970.
- Saveri P, Magri S, Maderna E, et al. DNAJB2-related charcot-marie-tooth disease type 2: pathomechanism insights and phenotypic spectrum widening. Eur J Neurol. 2022;29(7):2056–2065. doi: 10.1111/ene.15326.
- Yamamoto YH, Kimura T, Momohara S, et al. A novel ER J-protein DNAJB12 accelerates ER-associated degradation of membrane proteins including CFTR. Cell Struct Funct. 2010;35(2):107–116. doi: 10.1247/csf.10023.
- Sopha P, Ren HY, Grove DE, et al. Endoplasmic reticulum stress-induced degradation of DNAJB12 stimulates BOK accumulation and primes cancer cells for apoptosis. J Biol Chem. 2017;292(28):11792–11803. doi: 10.1074/jbc.M117.785113.
- Pascarella A, Ferrandino G, Credendino SC, et al. DNAJC17 is localized in nuclear speckles and interacts with splicing machinery components. Sci Rep. 2018;8(1):7794. doi: 10.1038/s41598-018-26093-1.
- Chen W, Lin Y, Jiang M, et al. Identification of LARS as an essential gene for osteosarcoma proliferation through large-Scale CRISPR-Cas9 screening database and experimental verification. J Transl Med. 2022;20(1):355. doi: 10.1186/s12967-022-03571-9.
- Esworthy RS, Kim BW, Larson GP, et al. Colitis locus on chromosome 2 impacting the severity of early-onset disease in mice deficient in GPX1 and GPX2. Inflamm Bowel Dis. 2011;17(6):1373–1386. doi: 10.1002/ibd.21479.
- Zhou H, Xu M, Hu P, et al. Identifying hub genes and common biological pathways between COVID-19 and benign prostatic hyperplasia by machine learning algorithms. Front Immunol. 2023;14:1172724. doi: 10.3389/fimmu.2023.1172724.
- Kubota H, Hynes G, Willison K. The chaperonin containing t-complex polypeptide 1 (TCP-1). multisubunit machinery assisting in protein folding and assembly in the eukaryotic cytosol. Eur J Biochem. 1995;230(1):3–16. doi: 10.1111/j.1432-1033.1995.0003i.x.
- Yao L, Zou X, Liu L. The TCP1 ring complex is associated with malignancy and poor prognosis in hepatocellular carcinoma. Int J Clin Exp Pathol. 2019;12(9):3329–3343.
- Syken J, De-Medina T, Münger K. TID1, a human homolog of the Drosophila tumor suppressor l(2)tid, encodes two mitochondrial modulators of apoptosis with opposing functions. Proc Natl Acad Sci U S A. 1999;96(15):8499–8504. doi: 10.1073/pnas.96.15.8499.
- Sayson SL, Fan JN, Ku CL, et al. DNAJA3 regulates B cell development and immune function. Biomed J. 2023;100628. doi: 10.1016/j.bj.2023.100628.
- Wang SF, Huang KH, Tseng WC, et al. DNAJA3/Tid1 is required for mitochondrial DNA maintenance and regulates migration and invasion of human gastric cancer cells. Cancers (Basel). 2020;12(11):3463. doi: 10.3390/cancers12113463.
- Daugaard M, Rohde M, Jäättelä M. The heat shock protein 70 family: highly homologous proteins with overlapping and distinct functions. FEBS Lett. 2007;581(19):3702–3710. doi: 10.1016/j.febslet.2007.05.039.
- Martyna B, Małgorzata MW, Nikola Z, et al. Expression profile of genes associated with the proteins degradation pathways in colorectal adenocarcinoma. Curr Pharm Biotechnol. 2019;20(7):551–561. doi: 10.2174/1389201020666190516090744.
- Dundas SR, Lawrie LC, Rooney PH, et al. Mortalin is over-expressed by colorectal adenocarcinomas and correlates with poor survival. J Pathol. 2005;205(1):74–81. doi: 10.1002/path.1672.
- Clapier CR, Cairns BR. The biology of chromatin remodeling complexes. Annu Rev Biochem. 2009;78(1):273–304. doi: 10.1146/annurev.biochem.77.062706.153223.
- Wang W, Tang YA, Xiao Q, et al. Stromal induction of BRD4 phosphorylation results in chromatin remodeling and BET inhibitor resistance in colorectal cancer. Nat Commun. 2021;12(1):4441. doi: 10.1038/s41467-021-24687-4.
- Wang L, Wang E, Prado Balcazar J, et al. Chromatin remodeling of colorectal cancer liver metastasis is mediated by an HGF-PU.1-DPP4 axis. Adv Sci (Weinh). 2021;8(19):e2004673. doi: 10.1002/advs.202004673.
- Dąbrowska D, Jabłońska E, Garley M, et al. New aspects of the biology of neutrophil extracellular traps. Scand J Immunol. 2016;84(6):317–322. doi: 10.1111/sji.12494.
- Li D, Shao J, Cao B, et al. The significance of neutrophil extracellular traps in colorectal cancer and beyond: from bench to bedside. Front Oncol. 2022;12:848594. doi: 10.3389/fonc.2022.848594.
- Yang L, Liu L, Zhang R, et al. IL-8 mediates a positive loop connecting increased neutrophil extracellular traps (NETs) and colorectal cancer liver metastasis. J Cancer. 2020;11(15):4384–4396. doi: 10.7150/jca.44215.
- Okamoto M, Mizuno R, Kawada K, et al. Neutrophil extracellular traps promote metastases of colorectal cancers through activation of ERK signaling by releasing neutrophil elastase. Int J Mol Sci. 2023;24(2):1118. doi: 10.3390/ijms24021118.
- Mao X, Xu J, Wang W, et al. Crosstalk between cancer-associated fibroblasts and immune cells in the tumor microenvironment: new findings and future perspectives. Mol Cancer. 2021;20(1):131. doi: 10.1186/s12943-021-01428-1.
- Lan J, Sun L, Xu F, et al. M2 macrophage-derived exosomes promote cell migration and invasion in Colon cancer. Cancer Res. 2019;79(1):146–158. doi: 10.1158/0008-5472.CAN-18-0014.
- Li J, Mo Y, Wei Q, et al. High infiltration of CD203c(+) mast cells reflects immunosuppression and hinders prognostic benefit in stage II-III colorectal cancer. J Inflamm Res. 2023;16:723–735. doi: 10.2147/JIR.S400233.
- Wang H, Zhang B, Li R, et al. KIAA1199 drives immune suppression to promote colorectal cancer liver metastasis by modulating neutrophil infiltration. Hepatology. 2022;76(4):967–981. doi: 10.1002/hep.32383.
- Zhang Y, Zhao Y, Li Q, et al. Macrophages, as a promising strategy to targeted treatment for colorectal cancer metastasis in tumor immune microenvironment. Front Immunol. 2021;12:685978. doi: 10.3389/fimmu.2021.685978.
- Tanaka A, Sakaguchi S. Targeting treg cells in cancer immunotherapy. Eur J Immunol. 2019;49(8):1140–1146. doi: 10.1002/eji.201847659.
- Feng M, Zhao Z, Yang M, et al. T-cell-based immunotherapy in colorectal cancer. Cancer Lett. 2021;498:201–209. doi: 10.1016/j.canlet.2020.10.040.
- Talaat IM, Elemam NM, Zaher S, et al. Checkpoint molecules on infiltrating immune cells in colorectal tumor microenvironment. Front Med (Lausanne). 2022;9:955599. doi: 10.3389/fmed.2022.955599.