
 ?Mathematical formulae have been encoded as MathML and are displayed in this HTML version using MathJax in order to improve their display. Uncheck the box to turn MathJax off. This feature requires Javascript. Click on a formula to zoom.
Abstract
Magnetic resonance thermometry (MRT) can measure in-vivo 3D-temperature changes in real-time and noninvasively. However, for the oropharynx region and the entire head and neck, motion potentially introduces large artifacts. Considering long treatment times of 60–90 min, this study aims to evaluate whether MRT around the oropharynx is clinically feasible for hyperthermia treatments and quantify the effects of breathing and swallowing on MRT performance. A 3D-ME-FGRE sequence was used in a phantom cooling down and around the oropharynx of five volunteers over ∼75 min. The imaging protocol consisted of imaging with acceleration (ARC = 2), number of image averages (NEX = 1,2 and 3). For volunteers, the acquisitions included a breath-hold scan and scans with deliberate swallowing. MRT performance was quantified in neck muscle, spinal cord and masseter muscle, using mean average error (MAE), mean error (ME) and spatial standard deviation (SD). In phantom, an increase in NEX leads to a significant decrease in SD, but MAE and ME were unchanged. No significant difference was found in volunteers between the different scans. There was a significant difference between the regions evaluated: neck muscle had the best MAE (=1.96 °C) and SD (=0.82 °C), followed by spinal cord (MAE = 3.17 °C, SD = 0.92 °C) and masseter muscle (MAE = 4.53 °C, SD = 1.16 °C). Concerning the ME, spinal cord did best, then neck muscle and masseter muscle, with values of −0.64 °C, 1.15 °C and −3.05 °C respectively. Breathing, swallowing, and different ways of imaging (acceleration and NEX) do not significantly influence the MRT performance in the oropharynx region. The ROI selected however, leads to significant differences.
1. Introduction
Patients with head and neck cancer often have a poor prognosis. Common risk factors are tobacco and alcohol use (accounting for 72% of cases when combined [Citation1]), but also human papillomavirus (with a large variation globally, but linked to more than 50% of cases in the United Kingdom [Citation2]). Head and neck cancer patients can be difficult to treat, as many important structures are present in a very small region, which limit treatment options and dosage [Citation3].
Hyperthermia therapy is an attractive sensitizer for chemo-, radio- and immunotherapy [Citation4]. This becomes especially relevant for head and neck patients with larger tumors that are inoperable, or in the presence of other limiting factors such as tight dose constraints when re-irradiating or close proximity to critical normal tissues. In order to achieve the maximum effect with the hyperthermia treatment, the temperature of the tumor tissue should lie between 39-43 °C for a duration of at least 60 min [Citation5].
It is important to validate that the temperature achieved lies in the desired range, because if the temperature is too low, the sensitizing effects of the hyperthermia treatment are limited or not existent; and if the temperature is above the desired range, there is an increased risk in permanent tissue damage in surrounding healthy tissue [Citation6,Citation7]. The heating behavior of subjects is highly individual because of the natural variation in tissue properties, such as perfusion, blood flow and energy absorption rate [Citation8], and thus cannot easily be predicted. For these reasons, the temperature needs to be monitored during the treatment, which is usually done using intraluminal or invasive catheters containing temperature probes. However, clinical experience demonstrates that, especially in the head and neck region, it is not without risk or simply impossible to place the probes close to the tumor, especially if the tumor is located in the pharynx or larynx. Moreover, temperature sensors only provide point-like measurements, and thus very limited information, which means that possible hot or cold spots could remain undetected.
Magnetic resonance thermometry (MRT) has as benefit that it can measure three-dimensional (3D) temperature changes non-invasively. The most commonly used method is proton resonance frequency shift (PRFS) [Citation9], which has superior accuracy, linearity with temperature, and tissue independence (except for fat). PRFS MRT is most commonly acquired with gradient-recalled echo (GRE) acquisitions, although other options have been explored [Citation10–12]. Clinically, only double echo gradient-recalled echo (DE-GRE) is currently used for hyperthermia. Clinical ablation treatments usually use single echo GRE. However, 3D multi echo gradient recalled echo (3D-ME-FGRE) was shown to significantly improve mean average error (MAE) and mean error (ME) in the brain [Citation13]. This is most likely due to the increased amount of information supplied by the additional echoes, and hence more accurate measurement of the temperature change. MRT has successfully been demonstrated in sarcomas, pelvis and the brain [Citation13–15]. Recently, an MR-compatible hyperthermia applicator for the head and neck was developed [Citation16,Citation17] at our institution: the MRcollar. At the time of writing, the device is in its final stages of being approved for clinical use and hence creates a need to develop reliable PRFS MRT.
One of the main challenges of PRFS MRT is that the off-resonance frequency changes due to temperature are small, compared to disturbances of the frequency due to motion such as breathing and swallowing [Citation18]. Therefore, temperature feedback during hyperthermia treatments in the head and neck region, currently is very limited [Citation19]. To reduce the effect of intra-scan motion, acceleration of image acquisition is actively researched [Citation20–23], bringing many advantages such as shorter imaging times, less opportunity for anatomy to move during the scan, and the option to increase field of view (FOV) coverage or resolution at the same imaging time.
The only in-vivo MRT evaluation in head and neck for hyperthermia application was performed by Pichardo et al. [Citation24]. The study focused on correcting the breathing motion artifacts in pigs. However, the pigs were immobilized, anesthetized and ventilated, which is not realistic in head and neck patients. A more patient friendly procedure is thus called for, in order to demonstrate the feasibility of MRT in the head and neck in humans.
The objective of this paper is to investigate whether MRT is possible in realistic motion conditions in the region around the oropharynx of healthy unheated volunteers. We aim to identify how MRT performance in the region is affected by swallowing and breathing, as well as pin-point (more) reliable anatomical regions for MRT. Further, we explore possible trends in MRT performance regarding different imaging setting in the form of accelerating the scan and averaging it. All these are important factors to consider in order to advance hyperthermia therapy in the head and neck.
2. Materials and methods
All acquisitions were made using a 22-channel head and neck imaging coil on a 1.5 T magnetic resonance imaging (MRI) scanner (GE Healthcare, Waukesha, WI, USA). A 3D-ME-FGRE sequence with settings given below was used for all acquisitions in both phantom and volunteers.
2.1. Phantom
To evaluate the motion-free baseline performance as well as temperature sensitivity and accuracy of the different acquisitions, we performed an experiment during the cooling down phase of a phantom. The design is described in more detail in Appendix I.
2.1.1. Acquisition settings
MRI acquisition parameters for the phantom experiment are listed in .
Table 1. MRI acquisition parameters for the phantom experiment.
2.1.2. Experimental set-up
In order to investigate the MRT of the phantom it was filled with hot water of about 65 °C, positioned in the MRI, and non-perturbing, electromagnetically insensitive temperature sensors (part of the PYREXAR BSD2000-3D-MRI deep hyperthermia system) with an accuracy of ±0.2 °C over a range of 25 to 52 °C were placed in the catheters. When the temperature in the center vial reached a temperature of 49 °C, imaging commenced, whilst the phantom was slowly cooling down to 36 °C over the course of 140 min. The imaging protocol included scans with different settings of accelerations (ARC) and number of image averages (NEX), all of which are presented in . For ARC we have employed short averaging.
Table 2. Imaging protocol for the phantom experiment, including acceleration settings, number of image averages (NEX) and the resulting acquisition time.
2.1.3. Postprocessing
An outline of the postprocessing can be found in Appendix I; the detailed pipeline is described in [Citation13].
2.2. In-vivo
2.2.1. Subjects
Five volunteers without dental braces or wires were recruited. For the sequence and its settings used here, metal would lead to large artifacts, possibly obscuring the fat and other regions of relevant anatomy for this study. All volunteers signed an informed consent (protocol MEC-2014-096, approved by the Erasmus MC Medical Ethical Committee).
2.2.2. Acquisition settings
The acquisition parameters were chosen such that the acquisition time for the fastest scan (acceleration = 2) was still feasible for a breath hold scan (assumed maximum of 30 s), keeping a resolution >1 mm and as large of an imaging volume as possible in the z-direction, see . For the final volunteer (#5), the anatomy was larger than the original FOV, and hence the FOV was increased as indicated in causing a different in-plane spatial resolution.
Table 3. MRT acquisition parameters for the in-vivo volunteer experiments.
2.2.3 Experimental set-up
For the MRT investigation, the volunteers were placed in the MRI in a supine position inside of the head and neck coil. The imaging protocol included nine different scans with different settings (see ), that were repeated five times each (for a total duration of ∼75 min). also shows the chosen acceleration, resulting acquisition times, as well as the instructions for these respective scans for breath hold and swallowing. For the breath hold scan, the scanner was automatically instructing the volunteers to hold their breath. The breath hold was only investigated for one scan setting, as we were limited by the physical constraints of the volunteers, assuming a maximum breath hold duration of 30 s. For the scans involving swallowing, the volunteers were manually instructed to swallow two times at random.
Table 4. Scan protocol for volunteers, including acquisition times. Acquisition times differed depending on the spatial resolution.
2.2.4 Postprocessing
The DICOM images were imported from the scanner into MATLAB (MATLAB and Statistics Toolbox Release 2021b, The MathWorks, Inc., Natick, Massachusetts, United States). The detailed pipeline used for processing the data is as introduced in [Citation13]. Here we provide a brief outline:
Firstly, b-spline image registration was used to correct for subject motion between time points. Subsequently, the change in off-resonance frequency as well as the water and fat density maps were calculated at each time point independently using the MMT-fitting tool also introduced in [Citation13]. The change in off-resonance was calculated as the difference between the off-resonance at time point i and the reference time point.
To correct for the B0 drift internal body fat was selected using the water and fat density maps. A linear bias field was then fitted to the fat mask. The resulting bias field was subtracted from the change in off-resonance in order to get the B0 drift corrected change in off-resonance.
Finally, the temperature change ΔT was calculated by:
(1)
(1)
where
is the change in off-resonance (rad/s) in voxel
and time point
with respect to the reference time point, B0 is the magnetic field strength of the scanner (=1.5 T),
is the gyromagnetic ratio (=267.513*106rad/s/T), and
is the temperature change coefficient for water PRFS (=−0.01 ppm/°C).
Since water frequency estimated by our method might be biased in the presence of fat, voxels containing more than 20% of fat were excluded.
The robustness was increased further through multiple starting points in the multi-peak multi-echo thermometry with PRFS (MMT-PRFS, also introduced in [Citation13]) to avoid water/fat swaps due to local minima, and through implementing b-spline image registration instead of rigid registration.
Initial results showed some water-fat swaps that corrupted the fat mask. This made us add an extra step to exclude individual scans with water-fat swaps from the analysis. The corrupted scans were identified by visual inspection of the change in off-resonance maps and statistics are reported in the results.
For the quantitative evaluation, three different ROIs were chosen: neck muscle, spinal cord and masseter muscle. This selection covers relevant regions across the FOV. The sizes of the ROIs were picked so that they would stay in the type of tissue aimed for, but also at sufficient distance away from fatty tissue. The ROIs size and positioning are indicated in .
Figure 1. Example of position and size of ROIs selected for volunteer MRT performance analysis. From left to right: (A) neck muscle, (B) spinal cord, and (C) masseter muscle.
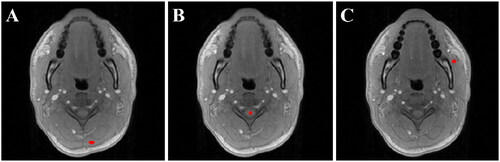
Comparing the ROIs with one another gives us a good indication on which regions (if any) provide us with reliable and stable MRT. Since the ROIs are distributed across the FOV, any difference in MRT performance between them can also indicate likely causes of these, and ideally facilitate a direction for future research.
2.3. Performance calculations
Similar to [Citation8], the quantitative MRT performance analysis was performed on the ROIs introduced above using the MAE, ME and standard deviation (SD). All three performance metrics are important to quantify for different reasons. MAE represents the accuracy of the temperature measurement. ME on the other hand shows the bias and therefore would qualitatively and quantitatively indicate a consistent over- or underestimation of the temperature. The spatial SD gives a good idea on how uniform the temperature readings are within the chosen ROI. This can indicate for instance if there is a temperature gradient present, in which case probably a different and more uniform ROI should be chosen for a reliable temperature measurement. They are defined as:
(2)
(2)
(3)
(3)
(4)
(4)
where
is the MRT measurement at time point
calculated as the mean over the ROI with
voxels,
is the MRT measurement of voxel
at time point
,
is the ground truth measurement at time point
, and
is the total number of time points where we exclude the first (reference) time point from the evaluation as
by construction.
As defined previously [Citation25], we aimed to fulfill the minimum requirements for successful MRT in hyperthermia: ≤ 1 °C MAE, ≤ ̛|0.5|°C ME, and ≤ 0.5 °C SD.
Statistical significance of the results was calculated with SPSS (IBM Corp. Released 2021. IBM SPSS Statistics for Windows, Version 28.0. Armonk, NY: IBM Corp). A two-sided independent samples t-test was performed and statistical significance was assumed at p < 0.05. For the phantom the significance of the differences were tested between all of the four different scans. For the volunteers, the significance of the difference was tested between the normal (NEX = 1, no breath hold, no swallowing) scans and all other 8 remaining scans for each ROI. Additionally, we also investigated the significance of the difference between scans with the same acquisition settings and different instructions to the volunteers (i.e. no instruction vs. breath hold and vs. swallowing) for all three ROIs.
3. Results
3.1. Phantom
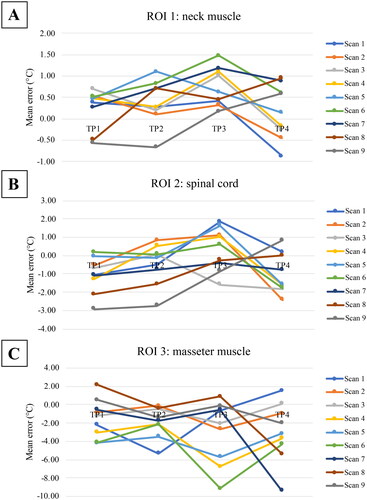
shows the MRT temperature against the temperature sensors, and shows the trends of temperature, expressed as ME, for different ROIs over time.
Figure 2. The MRT temperature plotted against the sensor temperature for the phantom experiment. The horizontal error bars represent a standard error of ±0.2 °C as specified by the vendor. The vertical error bars represent the spatial standard deviation of the ROI.
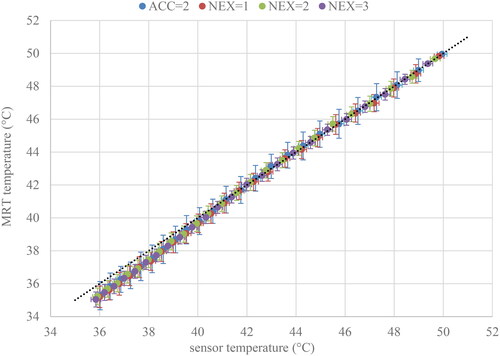
Figure 3. The temperature changes expressed as mean errors for different scan settings (numbered in accordance with ) over time; for A: ROI 1: neck muscle, B: ROI 2: spinal cord and C: ROI 3: masseter muscle.
The results of the performance matrices of the phantom experiment are presented in . Results that are significantly different are presented in bold. All values for MAE and ME, satisfied the minimum requirement for successful MRT [Citation25], as did the SD for NEX = 2 and NEX = 3 scans.
Table 5. Performance of MRT from phantom experiment covering 36–49 °C.
There are no significant differences in MAE and ME when using acceleration, or when increasing the number of NEX. The SD significantly and consistently improves with an increase in NEX. For NEX = 2 and NEX = 3 the improvement is slightly less than the 1/ improvement expected for uncorrelated noise.
3.2. Volunteers
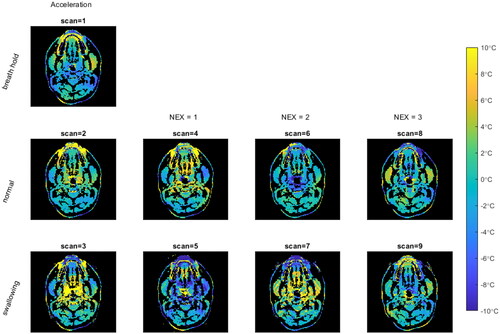
An example of the MRT maps obtained for the different scans is shown in . It can be seen that there are some susceptibility artifacts, especially around the teeth. It can also be seen in the swallowing scans 3, 5, 7 and 9 (bottom row of ), that it seems to lead to larger temperature variations from zero than the other scans.
Figure 4. MRT maps for the temperature change of one unheated subject (volunteer #3, time point = 2) shows the qualitative differences between acquisitions. The rows are (from top to bottom): breath hold, normal free breathing and swallowing. The columns are (from left to right): acceleration, NEX = 1, NEX = 2, and NEX = 3.
The MRT performance per scan is presented in for MAE, ME and SD respectively. The outliers originate from the B0 drift correction not always working perfectly, because we have no substantial fat present in the center of the imaged region (it is mainly located in the back of the neck and the cheeks). Hence, if there is a non-linear change in B0 drift, we cannot correct for that.
Figure 5. MAE across all volunteers, displayed for all ROIs and all different scan. There were no significant differences between the scans (numbered in accordance with ). The minimum requirement for successful MRT [Citation25] is indicated by the grey band.
![Figure 5. MAE across all volunteers, displayed for all ROIs and all different scan. There were no significant differences between the scans (numbered in accordance with Table 4). The minimum requirement for successful MRT [Citation25] is indicated by the grey band.](/cms/asset/ce6d4046-e574-4bf0-a142-72be12592bfd/ihyt_a_2352545_f0005_c.jpg)
Figure 6. ME across all volunteers, displayed for all ROIs and all different scans. There were no significant differences between the scans (numbered in accordance with ). The minimum requirement for successful MRT [Citation25] is indicated by the grey band.
![Figure 6. ME across all volunteers, displayed for all ROIs and all different scans. There were no significant differences between the scans (numbered in accordance with Table 4). The minimum requirement for successful MRT [Citation25] is indicated by the grey band.](/cms/asset/c1232091-6774-4100-918b-ea0366190b46/ihyt_a_2352545_f0006_c.jpg)
Figure 7. SD across all volunteers, displayed for all ROIs and all different scans. There were no significant differences between the scans (numbered in accordance with ). The minimum requirement for successful MRT [Citation25] is indicated by the grey band.
![Figure 7. SD across all volunteers, displayed for all ROIs and all different scans. There were no significant differences between the scans (numbered in accordance with Table 4). The minimum requirement for successful MRT [Citation25] is indicated by the grey band.](/cms/asset/3f9023fe-4a8c-40e3-9c45-ec937dffdc69/ihyt_a_2352545_f0007_c.jpg)
Visual inspection for water/fat swaps lead to the exclusion of 1/5 time points for scans 1-8 for one volunteer. Each bin (scan per ROI) thus includes 19 (scan 1-8) or 20 (scan 9) measures from the 4 different time points and 5 volunteers.
There were no significant differences found between the different scans, when comparing them to scan 4 (NEX = 1, no swallowing). The difference between motion (instruction to swallow) and no motion of the same acquisitions (scan 1-3, 4&5, 6&7, and 8&9) were not significant for any ROI, nor on a whole.
However, when comparing the different anatomical ROIs regarding MAE, ME and SD, the differences were significant for all performance metrics (presented in ). The best performance for MAE and SD was observed for ROI 1: Neck muscle. For ME ROI 2: spinal cord performed best, as it was closest to zero. None of the ROIs investigated in this study achieved the required performance values for successful MRT in hyperthermia [Citation25].
Figure 8. MAE, ME and SD of all scans, shown for the different ROIs. Significant codes are noted as: 0.001=***, 0.01=**, 0.1=*. The minimum requirement for successful MRT [Citation25] is indicated by the grey band.
![Figure 8. MAE, ME and SD of all scans, shown for the different ROIs. Significant codes are noted as: 0.001=***, 0.01=**, 0.1=*. The minimum requirement for successful MRT [Citation25] is indicated by the grey band.](/cms/asset/ec932c46-3d82-40cd-8018-3f6f0cd398ff/ihyt_a_2352545_f0008_c.jpg)
4. Discussion
This paper presents the first study on MRT in the head and neck region in human subjects, a region which is known to be prone to movement related artifacts in imaging.
4.1. Impact of technical measures on MRT
In the volunteer experiments it can be observed that we are not yet achieving acceptable accuracy for the different scans tested. Accelerating the acquisition by parallel imaging (ARC = 2) as well as increasing scan time by increasing NEX are not significantly changing the MRT performance in this region. This is an important result, as it shows that scanning faster or slower does not come at the cost of MRT quality. Consequently, we have the freedom to either design a protocol to be as fast as possible, saving imaging time and potentially improving patient comfort; or going toward longer acquisition times with for example increased imaging resolution or a wider FOV. A sufficiently high resolution in the head and neck is desirable, as there are many different small anatomical structures in close proximity to one another that may heat differently, and a more extensive FOV is beneficial to monitor the anatomy surrounding the tumor target region for hot spots, as well as making corrections, for instance for motion, easier and more robust. Past studies have reported that accelerating the acquisition improved the MRT performance [Citation26], which stands in contrast with the present results. A possible explanation for these discrepancies is that there are different motion patterns in different anatomies.
4.2 Impact of breathing and swallowing on MRT
Another important result was the insignificance of swallowing and breathing on the quality of MRT. With the settings used, neither breath-hold nor instructions to avoid swallowing seem to significantly affect the MRT performance in the regions investigated. Not needing to scan under breath hold improves patient comfort, simplifies the scanning protocol and reduces preparation time. The extra time can in turn be used to improve image resolution or FOV. The fact that swallowing does not significantly impact the quality of MRT might simplify treatments too, as scans where the patient swallowed may not need to be excluded from the analysis. This should be verified for other ROIs and using the treatment set-up in the MRcollar, before generalizing this for the whole anatomy of the head and neck. These results are surprising, as one would have expected swallowing and breathing to be associated with movement-induced artifacts, resulting in greater MRT errors.
4.3. Clinical relevance of MRT in different ROIs
Another important outcome of the study is that there are significant differences in MRT performance among the anatomical ROIs chosen. The neck muscle had the best MAE performance with 1.96 ± 1.89 °C, as well as the smallest SD of 0.82 ± 0.3 °C. However, these measured performance values are still higher than what we aim for and would require to achieve successful MRT [Citation25].
The comparatively better MRT performance of the neck muscle is most likely because of two reasons: Firstly, the neck muscle is at the back of the head, which has lower inter-scan motion because of the supine positioning of the volunteer on the scanner bed; secondly, the neck is relatively far away from internal disturbances such as susceptibility artifacts around deforming air cavities and non-rigid repositioning of the tongue. There are methods available, presented in Wu et al. [Citation27] and Nouwens et al. [Citation28], that improve the susceptibility induced temperature error in the pelvis, and might also prove useful in the head and neck.
The ME was best in the spinal cord. This is the only ROI investigated in this study that satisfies the minimum requirements for ME for successful hyperthermia of <0.5 °C, albeit only for scans 4-8. This is most likely due to the spinal cord having a central location in the imaged anatomy, which means better magnetic field uniformity as well as only small deformations due to the protecting surrounding structures. Additionally, the B0 drift correction is likely most effective there, as the fat mask used for correction is located in a near-equidistant ring around it.
For this study the masseter muscle was of interest, as trismus (extreme tightness of the jaw muscles making it impossible to (fully) open the mouth) has been observed as a side-effect of hyperthermia in the head and neck region [Citation19], and one of the hypotheses is that the occurrence of trismus may be increased by combining radiotherapy with hyperthermia.
The masseter muscle is located toward the anterior part of the volunteers making it more susceptible to inter-scan motion. The results in this ROI indicate the possible influence of head motion with MAE and SD showing the worst performance of 4.53 ± 5.01 °C and 1.16 ± 0.64 °C respectively. The spread of the results, shown by the standard deviation of the mean, can be seen as an indication of the reliability of the ROI for MRT. At this moment, regions with large inter-scan motion do not provide accurate MRT, and unfortunately there are clinically relevant organs at risk in these regions.
It may be an important consideration for monitoring and guiding hyperthermia with MRT, that the tumor can be located in areas where a lot of motion is present, such as the oral cavity. However, before making conclusions in that regard the results of this paper should be expanded by repeating the procedures in the present study in the treatment set-up, once the MRcollar is approved for the use on human subjects. Part of the applicator is a water bolus, which sits snugly between the patient and the antennas used for heating, to cool the skin of the patient and to aid the radiofrequency transmission to the tissues. Because of the restricting water bolus around the head of the patient, we expect that head motion will be reduced. During the experiments in this study no confinement was used on the volunteers, and we observed a lot of motion even when asked to be still. Therefore we hypothesize that when imaged in the treatment set-up, MRT performance may improve, however, this is subject to further research.
For the purpose of improving MRT performance in the future to realize the minimum requirements, especially when employing the MRcollar, one can consider optimizing the acquisition parameters or implementing other technologies that have already been developed. These include advanced filtering techniques [Citation29], explicit modeling of the motion-induced susceptibility field changes [Citation30–32], field monitoring [Citation31], or extrapolating the heating from regions that are reliable.
4.4. Limitations
The volunteers included in this study were not heated, so the physiological reaction of in-vivo tissues that arise as response to hyperthermia, such as increase in flow and diffusion, were not present. Repeating the experiments presented in this study using in-vivo heated conditions could thus influence the MRT measurements.
Furthermore, the volunteers used here were healthy subjects and therefore did not have some of the tissues of interest, such as tumor tissue or pathological lymph nodes. Because of their different composition, these tissues may behave differently than the regions investigated in this study.
In this study, we have covered relevant ROIs across the FOV acquired. In reality, it might be interesting to investigate additional areas, depending on the location of the (expected) tumor or potential hot spots during the hyperthermia treatment.
This work is only focused on a small region in the head and neck and the motion that can arise there. It cannot directly be generalized to other areas with different motion e.g. the pelvis.
The FOV of the acquisitions was limited to allow breath-hold scanning. As the results show breath-hold scanning is not essential for MRT performance. Hence, the strong desire of the clinical staff for a larger FOV can probably be accommodated without excessive loss of resolution.
In its current state, the postprocessing pipeline takes a substantial amount of time to run (on the order of tens of minutes). For clinical use the processing time needs to be improved to the order of a few minutes to be fast enough for real-time monitoring and enabling MRT guided adaptation of clinical hyperthermia treatment. As the current MATLAB and CPU based post-processing pipeline is not optimized for computation time, we expect sufficient time reduction to be possible with a dedicated optimized implementation.
To isolate the effects of scan duration and inevitable subject motion, we only varied a small amount of acquisition settings and confounders. The current results pave the way for further optimization of MRT by for instance refining the acquisition parameters such as resolution, field of view, bandwidth, number of echoes or repetition time. The current study has also only investigated 5 subjects. Therefore the findings of no significant differences that were found here do not mean that there are no differences. Further experiments and larger study sizes are necessary for the conclusions to be generalizable.
5 Conclusion
We have shown that we can map the temperature in a small region of the head and neck with MRT. Acceleration as well as averaging the MRI acquisition does not significantly affect the accuracy of MRT results; nor does performing a scan under breath hold compared to normal breathing or swallowing compared to not swallowing. However, depending on which ROI is selected, the MRT performance is significantly different. Unfortunately, none of the ROIs and scans fulfilled all MRT performance requirements. We indicated relevant research directions to improve MRT, hopefully paving the way toward MRT guided hyperthermia treatment as adjunctive therapy in head and neck cancer patients.
Human subjects
The protocol used was approved by our institutional review board, protocol ‘MRI technology healthy volunteers’ (MEC-2014-096). After having received an explanation of the study, all volunteers signed an informed consent.
Disclosure statement
No potential conflict of interest was reported by the author(s).
Data availability
The data that support the findings of this study are available from the corresponding author, T.V.F., upon reasonable request.
References
- Gormley M, Creaney G, Schache A, et al. Reviewing the epidemiology of head and neck cancer: definitions, trends and risk factors. Br Dent J. 2022;233(9):780–786. doi: 10.1038/s41415-022-5166-x.
- Schache AG, Powell NG, Cuschieri KS, et al. HPV-Related oropharynx cancer in the United Kingdom: an evolution in the understanding of disease EtiologyHPV OPSCC in the UK. Cancer Res. 2016;76(22):6598–6606. doi: 10.1158/0008-5472.CAN-16-0633.
- Corry J, Peters LJ, Costa ID’, et al. The ‘QUAD SHOT’—a phase II study of palliative radiotherapy for incurable head and neck cancer. Radiother Oncol. 2005;77(2):137–142. doi: 10.1016/j.radonc.2005.10.008.
- Yang X, Gao M, Xu R, et al. Hyperthermia combined with immune checkpoint inhibitor therapy in the treatment of primary and metastatic tumors. Front Immunol. 2022;13:969447. doi: 10.3389/fimmu.2022.969447.
- Issels R, Kampmann E, Kanaar R, et al. Hallmarks of hyperthermia in driving the future of clinical hyperthermia as targeted therapy: translation into clinical application. Int J Hyperthermia. 2016;32(1):89–95. doi: 10.3109/02656736.2015.1119317.
- Ong BB. INJURY, FATAL aND NONFATAL | burns and scalds., in Encyclopedia of forensic and legal medicine., J. Payne-James, Editor. 2005, Elsevier: philadelphia, USA. p. 90–98.
- Behrouzkia Z, Joveini Z, Keshavarzi B, et al. Hyperthermia: how can it be used? Oman Med J. 2016;31(2):89–97. doi: 10.5001/omj.2016.19.
- Billard BE, Hynynen K, Roemer RB. Effects of physical parameters on high temperature ultrasound hyperthermia. Ultrasound Med Biol. 1990;16(4):409–420. doi: 10.1016/0301-5629(90)90070-s.
- Ishihara Y, Calderon A, Watanabe H, et al. A precise and fast temperature mapping using water proton chemical shift. Magn Reson Med. 1995;34(6):814–823. doi: 10.1002/mrm.1910340606.
- Wu M, Mulder HT, Zur Y, et al. A phase-cycled temperature-sensitive fast spin echo sequence with conductivity bias correction for monitoring of mild RF hyperthermia with PRFS. MAGMA. 2019;32(3):369–380. doi: 10.1007/s10334-018-0725-5.
- Lechner-Greite SM, et al. Proton density and T1 weighted zero TE MR thermometry. in U.S. Patent no. 10,076.,249. 2018: washington, DC: u.S. Patent and Trademark Office.
- Paliwal V, El-Sharkawy A-M, Du X, et al. SSFP-based MR thermometry. Magn Reson Med. 2004;52(4):704–708. doi: 10.1002/mrm.20231.
- Feddersen TV, et al. Multi-echo gradient echo pulse sequences: which is best for PRFS MR thermometry guided hyperthermia? Int J Hyperthermia. 2023;40(1):2184399.
- VilasBoas-Ribeiro I, Curto S, van Rhoon GC, et al. MR thermometry accuracy and prospective imaging-Based patient selection in MR-guided hyperthermia treatment for locally advanced cervical cancer. Cancers (Basel). 2021;13(14):3503. doi: 10.3390/cancers13143503.
- Gellermann J, Hildebrandt B, Issels R, et al. Noninvasive magnetic resonance thermography of soft tissue sarcomas during regional hyperthermia: correlation with response and direct thermometry. Cancer. 2006;107(6):1373–1382. doi: 10.1002/cncr.22114.
- Drizdal, Tomas, Sumser, Kemal, Bellizzi, Gennaro G, et al., Simulation guided design of the MRcollar: a MR compatible applicator for deep heating in the head and neck region.Int J Hyperthermia, 2021. 38(1): p. 382–392. doi: 10.1080/02656736.2021.1892836.
- Sumser K, Drizdal T, Bellizzi GG, et al. Experimental validation of the MRcollar: an MR compatible applicator for deep heating in the head and neck region. Cancers (Basel). 2021;13(22):5617. doi: 10.3390/cancers13225617.
- Kern AL, Gutberlet M, Rumpel R, et al. Absolute thermometry using hyperpolarized 129Xe free‐induction decay and spin‐echo chemical‐shift imaging in rats. Magn Reson Med. 2023;89(1):54–63. doi: 10.1002/mrm.29455.
- Kroesen M, van Holthe N, Sumser K, et al. Feasibility, SAR distribution, and clinical outcome upon reirradiation and deep hyperthermia using the hypercollar3D in head and neck cancer patients. Cancers (Basel). 2021;13(23):6149. doi: 10.3390/cancers13236149.
- Mei C-S, Panych LP, Yuan J, et al. Combining two-dimensional spatially selective RF excitation, parallel imaging, and UNFOLD for accelerated MR thermometry imaging. Magn Reson Med. 2011;66(1):112–122. doi: 10.1002/mrm.22788.
- Gaur P, Grissom WA. Accelerated MRI thermometry by direct estimation of temperature from undersampled k-space data. Magn Reson Med. 2015;73(5):1914–1925. doi: 10.1002/mrm.25327.
- Leonard P, Chopra R, Nachman A. Compressed sensing for accelerated MR thermometry in MRI-controlled transurethral ultrasound therapy. Proc. 20th Sci. Meet. ISMRM, Melb. Melbourne. 2012;2918.
- Fielden S, et al. Accelerating 3D spiral MR thermometry with Kalman filter. Int. Soc. Magn. Reson. Med. Milan. 2014;22:2346.
- Pichardo S, Köhler M, Lee J, et al. In vivo optimisation study for multi-baseline MR-based thermometry in the context of hyperthermia using MR-guided high intensity focused ultrasound for head and neck applications. Int J Hyperthermia. 2014;30(8):579–592. doi: 10.3109/02656736.2014.981299.
- Feddersen TV, Hernandez-Tamames JA, Franckena M, et al. Clinical performance and future potential of magnetic resonance thermometry in hyperthermia. Cancers (Basel). 2020;13(1):31. doi: 10.3390/cancers13010031.
- Yuan J, et al. Towards fast and accurate temperature mapping with proton resonance frequency-based MR thermometry. Quant Imaging Med Surg. 2012;2(1):21–32.
- Wu M, Mulder HT, Baron P, et al. Correction of motion-induced susceptibility artifacts and B(0) drift during proton resonance frequency shift-based MR thermometry in the pelvis with background field removal methods. Magn Reson Med. 2020;84(5):2495–2511. doi: 10.1002/mrm.28302.
- Nouwens SAN, Paulides MM, Fölker J, et al. Integrated thermal and magnetic susceptibility modeling for air-motion artifact correction in proton resonance frequency shift thermometry. Int J Hyperthermia. 2022;39(1):967–976. doi: 10.1080/02656736.2022.2094475.
- VilasBoas-Ribeiro I, Nouwens SAN, Curto S, et al. POD-Kalman filtering for improving noninvasive 3D temperature monitoring in MR-guided hyperthermia. Med Phys. 2022;49(8):4955–4970. doi: 10.1002/mp.15811.
- Boehm C, Goeger‐Neff M, Mulder HT, et al. Susceptibility artifact correction in MR thermometry for monitoring of mild radiofrequency hyperthermia using total field inversion. Magnetic Resonance in Med. 2022;88(1):120–132. doi: 10.1002/mrm.29191.
- Le Ster C, Mauconduit F, Mirkes C, et al. Measuring radiofrequency field-induced temperature variations in brain MRI exams with motion compensated MR thermometry and field monitoring. Magnetic Resonance in Med. 2022;87(3):1390–1400. doi: 10.1002/mrm.29058.
- Tan J, Mougenot C, Pichardo S, et al. Motion compensation using principal component analysis and projection onto dipole fields for abdominal magnetic resonance thermometry. Magnetic Resonance in Med. 2019;81(1):195–207. doi: 10.1002/mrm.27368.
- Bush EC, Gifford A, Coolbaugh CL, et al. Fat-water phantoms for magnetic resonance imaging validation: a flexible and scalable protocol. J Vis Exp. 2018;7(139):e57704.
Appendix I:
Phantom details
This appendix will describe the phantom used for the experiments in more detail, as this is not novel to the current paper and not the core content.
Build
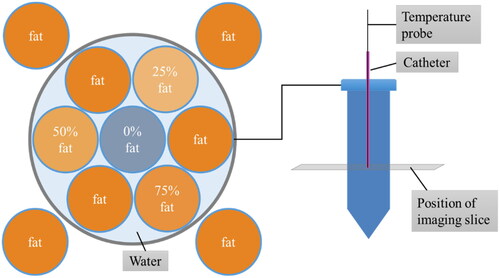
The phantom was made in-house from different mixtures of distilled water, gadolinium, water soluble surfactant, agar, sodium benzoate and peanut oil; following the recipe presented by Bush et al. [Citation33]. The mixtures of different fat percentages were filled into polypropylene vials and placed in a PVC pipe with a lid, see .
Figure 9. Schematic of the home-made phantom used. The outer four fat vials were used to correct the B0 drift, the center vial (0% fat) was used for the MRT analysis.
Post-processing
The post-processing of the phantom data was described in detail before in [Citation13]. The most relevant steps are briefly re-iterated below:
The coil-combined DICOM images were imported from the scanner to MATLAB
The offresonance frequency was calculated for each time point, using a multi-peak multi-echo thermometry with PRFS (MMT-PRFS). Subsequently each offresonance frequency was subtracted from the offresonance at the reference time point (here: time point 1), to obtain the change in offresonance
The external vials of the phantom containing fat were manually selected to create a fat mask
A linear bias field was fitted to the fat mask, and subtracted from the change in offresonance calculated before, in order to correct for the B0 scanner drift
The change in temperature was calculated using the following relationship:
(4)
where γ is the gyromagnetic ratio (= 267.513*106 rad/s/T), α is the change coefficient for PRFS (= −0.01 ppm/°C), and B0 is the magnetic field strength of the MRI scanner (=1.5T)
A ROI was selected in the center vial, containing the water mixture
Parameters of interest were taken and MAE, ME and SD were calculated (see Section 2.3)