
 ?Mathematical formulae have been encoded as MathML and are displayed in this HTML version using MathJax in order to improve their display. Uncheck the box to turn MathJax off. This feature requires Javascript. Click on a formula to zoom.
ABSTRACT
The elastic constants of ϵ-carbide at 0 K and zero pressure have been calculated using first-principle methods. The iron to carbon ratio for the carbide is not established and may, in fact, vary between 3 and 2. As a consequence, the calculations have been conducted as a function of the chemical composition using the special quasi-random structures method. In all cases, the elastic constants obtained are consistent with ϵ-carbide being mechanically stable. The analysis indicates that in comparison with cementite, ϵ-carbide should be more brittle; that when present as a precipitate in steel, it would be less effective in participating in the overall plastic deformation, and that its coherency strain field in the surrounding matrix should be less extensive than cementite.
Introduction
Steels with martensite and/or lower bainite microstructure are widely used to achieve high strength and wear resistance [Citation1–3]. In these steels, nano-sized precipitates generated during the tempering of martensite or bainite transformation play a major role in determining mechanical properties [Citation1,Citation3]. During tempering of martensite or bainite transformation, excess carbon in the lattice may be released and iron-carbides can be formed. The most widely known iron-carbide is cementite, but ϵ-carbide can be observed in the initial stage of tempering or in alloys in which the addition of silicon suppresses the formation of cementite [Citation4,Citation5]. Using transmission electron microscopy, it was found that the ϵ-carbide precipitated with orientation relationship in both tempered martensite and lower bainite [Citation6], indicating that the carbide formed directly from supersaturated ferrite [Citation7]. These ϵ-carbides have been found to play important roles in increasing the hardness, strength and fatigue properties [Citation1,Citation2].
In 1950, Jack identified experimentally the crystal structure of the hexagonal Fe system which had interstitial atoms including carbon and nitrogen [Citation8]. The crystal structure of ϵ-carbide was studied by Nakagura and Dirand [Citation9,Citation10]. In ϵ-carbides, the carbon to iron ratio can vary in the range FeC to Fe
C. The iron atoms are in a hexagonal close-packed array and C occupies some of the resulting octahedral interstitices. Depending on the distribution of the carbon atoms on the interstitial sites, the space group can be a
or
. Since all of the octahedral interstitial sites are equivalent, a random distribution of carbon atoms on these sites leads to the space group
with the unit cell containing two Fe atoms and two octahedral interstitial sites (Figures and ). The structure has the lattice parameters
and
, and Wyckoff position of Fe (
,
,
) and C (0, 0, 0). On the other hand, if the distribution of carbon atoms is ordered as in Figure (a), then the space group is
, corresponding to lattice parameters
and
, and Wyckoff positions of Fe (
, 0, 0), fully occupied C (
,
,
) and partially occupied C (0, 0,
). There are then six Fe atoms, two octahedral interstices fully occupied with C atoms, and two partially occupied.
Figure 1. cell structure-projection on to the basal plane. The iron atoms coloured blue are at height
, those Fe atoms coloured white are at heights 0 and 1; the smaller carbon atoms that are hatched and cross-hatched are at heights
and
, respectively. (a) Space group
with one set of octahedral interstices (2d) occupied by carbon and some further carbon (not illustrated) in the 2b sites which would be 25% occupied to make the overall structure consistent with the formula F
C. (b) The carbon atoms (not illustrated) are now randomly distributed in any of the three kinds of octahedral interstices, so that the overall symmetry becomes
.
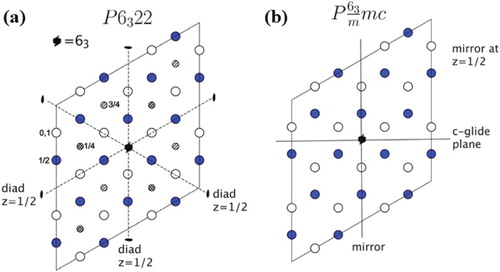
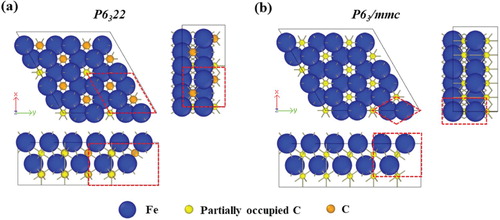
Figure 2. 3D representation of crystal structure of ϵ-carbide (a) analysed as the space group of and (b)
. The red dashed line represents the crystallographic unit cell. The upper left subfigure shows the basal plane projection, the right and bottom show projections in the x–z and y–z directions, respectively.
The primary purpose of the work presented here was to determine the elastic constants of ϵ-carbide. Experimental data for single-crystal modulus of ϵ-carbide do not exist, presumably because it is difficult or perhaps impossible to make samples. Therefore, using first-principles calculations, a study was conducted to obtain single-crystal elastic constants of ϵ-carbide [Citation11–13]. Some calculations indicate that is negative [Citation12,Citation13] implying that the phase is mechanically unstable, but this must be an incorrect because ϵ-carbide is observed to exist in a robust state. The structure assumed in [Citation12] incorrectly has carbon and iron atoms in the same plane. The hexagonal Fe
C structure of [Citation13] has a lattice parameter a = 0.3636 nm, which does not match with the known parameters of ϵ-carbide. The calculations relating to the hexagonal Fe
C structure [Citation13], with lattice parameters a = 0.463 nm and c = 0.430 nm may be representative of the elastic properties of ϵ-carbide (Table ), but further work is needed to express these as a function of the iron to carbon ratio.
Table 1. The calculated single-crystal moduli (GPa) of hexagonal Fe C. The bulk modulus is labelled K.
Calculation method
First-principles calculations
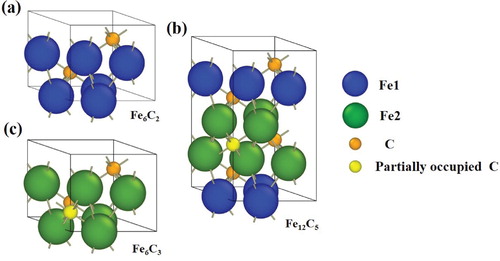
ϵ-carbide with a space group corresponds to a random distribution of carbon atoms on the octahedral interstices. It has been shown that such a distribution can be efficiently represented in atomic simulation by the ‘special quasi-random structures’ (SQS) method [Citation14]. This mimics the physically most relevant radial correlation functions of a truly random structure. This method is applied here to include the carbon atom distributions based on 12 Fe atoms, and 4, 5, or 6 C atoms arranged to satisfy the composition range of ϵ-carbide.
Figure shows the conventional unit cells simulating the ϵ-carbide structure corresponding to the space group, covering the compositions Fe
C
, Fe
C
, and Fe
C
.Footnote1 When C is located at the partially occupied octahedral interstices, additional Fe-C bonds are formed with six nearest Fe atoms. Therefore, the Fe atoms are grouped into atoms without (Fe
) and with (Fe
) nearest bonding to C located at partially occupied positions.
Figure 3. Conventional unit cell of ϵ-carbide with (a) FeC
, (b) Fe
C
, and (c) Fe
C
formula units constructed based on
space group symmetry. The orange and yellow spheres represent carbons located at fully occupied and partially occupied carbon positions, respectively, of the
space group. The green and blue spheres represent Fe atoms with and without nearest bonding from carbon atoms located at partially occupied positions.
First-principles calculations within the framework of density functional theory were conducted using the Vienna ab-initio simulation package [Citation16,Citation17]. Exchange and correlation functionals are described with the generalised gradient approximation in the scheme of Perdew–Burke–Ernzerhof [Citation18]. Calculations in the first irreducible Brillouin zone were conducted with different k-point meshes using the Monkhorst–Pack scheme [Citation19]. We used an mesh of special k-points for the structures with a
space group, and
,
and
special k-points for the structure shown in Figure (a–c). We considered
and
as valence electrons in order to describe the electron–ion interactions for Fe and C, respectively. A plane-wave basis set with a cut-off kinetic energy level of 720 eV was used. Each calculation was considered to converge when total energy changes during the atomic relaxation and geometry optimisation process were smaller than
eV/cell. Spin polarisation was considered for all calculations, and the convergence of these computational parameters was carefully checked. The spin-polarised site projected densities of states were computed using the equilibrium lattice constants and fully relaxed atomic positions.
Elastic constants
Single-crystal elastic constants can be evaluated using energy changes corresponding to the specified deformation of the crystal. The energy E for the elastic strain corresponding to the deformation matrix D of the crystal can be expressed as
(1)
(1) and
are the elastic constants, V is the equilibrium volume, and
is the energy of the stable state [Citation20]. The hexagonal system has five independent elastic constants, so the elastic strain energy change for the strain is given by
(2)
(2) Five types of deformation were applied to obtain the five independent values:
(3)
(3) For each deformation mode, strain energy changes were obtained for seven points at 1% interval in the range of −3% to 3% strain, and the quadratic coefficients
of
were derived by the quadratic function fitting. Each elastic constant was evaluated using the following equations:
(4)
(4) The bulk modulus (B), shear modulus (G), Young's modulus (E) and Poisson's ratio (ν) were calculated using Voigt's averaging method [Citation21].
Results and discussion
Crystal structure stability
The calculated optimised lattice parameters at 0 K and zero pressure, for each structure in Figure are shown in Figure (a). Nakagura's measured values for ambient temperature are and
, which are reasonable for values between Fe
C
and Fe
C
. The difference between the previous results calculated from Jang and Fang for the Fe
C
structure is about 0.5%, which is within the calculation error [Citation15,Citation22]. As the content of C in the ϵ-carbide increases, the lattice parameter in the c-direction changes only a relatively small amount, whereas the lattice parameter in the a-direction increases. Therefore, the aspect ratio decreases and the volume increases. For the same crystal structure, the larger the volume is, the smaller the elastic constant will be. The effect of the volume on the modulus of elasticity will be discussed later.
Figure 4. Calculated results for crystal structure stability of ϵ-carbides. (a) Change of lattice parameter (black rectangles and red dots) and aspect ratio (squares) according to carbon content of ϵ-carbide based on space group structure. (b) Calculated formation energies of ϵ-carbide based on
(black rectangles) and
(red dots) space group structure.
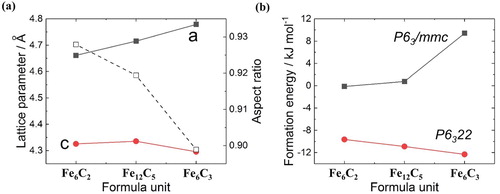
The crystal stability of each structure was compared by evaluating the formation energy, as follows:
(5)
(5) where
) is the total energy of Fe
C
, and
and E(C) are the total energies, respectively, of the Fe and C in the reference states. For iron, the reference state is ferromagnetic bcc Fe. In the case of carbon in solution in the bcc iron, the reference state is evaluated by the difference between pure Fe and fully relaxed body-centred tetragonal 16Fe-C system.
The calculated formation energies of each structure are summarised in Figure (b). In the C ordered structure (Figure ), due to the negative formation energies ( to
kJ mol
), all three structures can be generated in ferrite; structures with higher C content are more stable when the carbide is in isolation.
The C disordered structure (Figure (b)) has a formation energy near 0 kJ mol, which is much more unstable than that of the C ordered structure. For the Fe
C
structure, the energy differences between the disordered and ordered structure were studied in previous work [Citation2,Citation22], in which the ordered structure was found to be much more stable than the disordered structure, and the energy difference between the two was 11.7 kJ mol
, similar to the value (11.5 kJ mol
) in the previous study [Citation2]. In the HCP structure of Fe, when C is located at an octahedral interstitial sites, stress is generated in the direction in which the Fe atoms move away from C atom. In the ideal HCP structure with Fe–Fe bonding length,
, the distance between octahedral interstices and first nearest octahedral interstices is
. In the case of the ordered Fe
C
structure shown in Figure (a), the distance between C and the nearest C is
and the distance from the partially occupied C is
, so C is not located in the first nearest octahedral interstices. On the other hand, in the structure that implements the C disordered structure (Figure (b)), C is located at the first nearest octahedral interstices, and Fe is not fully relaxed due to the presence of nearby C, so that induces unstable structure. As the C content increases, the number of C atoms to be placed in the first nearest octahedral interstices increases, resulting in a more unstable structure. The most stable structure depending on the C content, the structure shown in Figure , benefits from an even distribution.
Electronic structure
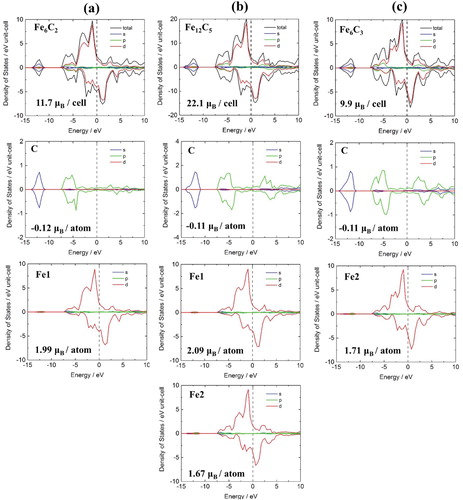
The electronic structure was analysed based on the total density of state (DOS) and partial density of states (PDOS). Site and spin-projected DOS are shown in Figure for FeC
, Fe
C
, and Fe
C
ϵ-carbides based on the
space group structure. In all three structures, total DOS consists of four regions: (1) The lowest valence band between
and
eV, (2) the
to
eV range, (3) the
eV to Fermi level range, and (4) the unoccupied conduction band. The lowest region is symmetric, mostly composed of 2 s states of C. Region (2) is composed of hybridisation of C
and Fe
states. Region (3) is mostly produced by Fe
and shows metallic properties with no energy gap near the Fermi level. In this region, there is an asymmetric distribution in major and minor spins, contributing to the ferromagnetic properties of ϵ-carbides. The higher the carbon content, the higher the density of region (2) and the lower the energy density of region (3). This is indicated by covalent bonding between Fe and C, which is newly created by the added C. As C is added, the density of the major spin does not change much near the Fermi level, whereas the peak of the unoccupied conduction band of the minor spin moves toward the Fermi level, lowering the overall magnetic moment. This is mainly attributed to the change in the density of Fe2 atoms, which induces bonding with added C. The Fe1 type atoms with the two nearest bonds with C have about of
, whereas the Fe2 type atoms with three nearest bonds with C has about
. Therefore, as the carbon content increases, the magnetic moment of the unit cell decreases.
Figure 5. Calculated spin-resolved total- and site-projected partial density of state (DOS) of (a) FeC
, (b) Fe
C
, and (c) Fe
C
crystal structures. The black line represents total density. The blue, green, and red lines represent the densities of the s, p, and d orbitals, respectively. The Fermi levels are set to zero.
Elastic constants
The elastic strain energy values corresponding to the five different deformation modes (,
,
,
, and
) are summarised in Figure as a function of strain (δ). The energy corresponding to the lattice parameter at equilibrium state is shown as a reference, and each set of data can be well described by quadratic function fitting. As the content of C increases, the newly formed Fe–C covalent bonding contributes to the strain energy, making it steeper in the strain vs. energy graph, and thus the elastic constants can be expected to increase.
Figure 6. Elastic strain energy variation as a function of different deformation strains (,
,
,
, and
) for (a) Fe
C
, (b) Fe
C
, and (c) Fe
C
crystal structures. Each energy function was fitted as a second-order polynomial.
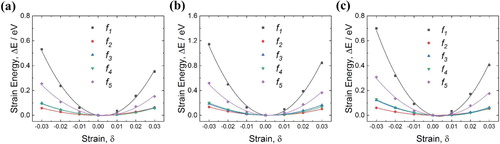
Table summarises the calculated elastic constants.
Table 2. Elastic constants (/GPa) and bulk modulus (B/GPa), shear modulus (G/GPa), Young's modulus (E/GPa) and Poisson's ratio (ν) of ϵ-carbide.
Similar to the previous study, the values for the FeC
structure are consistent, within 5% error, except for
. In the case of the Fe
C
structure, the values were calculated and found to be as large as 5–15% compared to the previous results, except for
[Citation11]. This difference is considered to be due to a constraint that maintains atomic position symmetry in elastic deformation situations. The results for the three structures satisfy the conditions for the mechanical stability of the structure, i.e. For a hexagonal crystal, mechanical stability requires that [Citation24–26]:
Overall, Fe
C
and Fe
C
structures have larger elastic constants than that of the Fe
C
structure. In the case of G/B, associated with ductility of a crystal, there is almost no change with the addition of C, whereas
drastically drop from Fe
C
to Fe
C
, and the structures are expected to be brittle [Citation27].
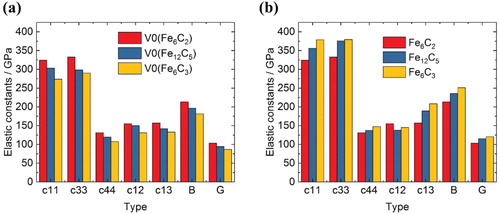
The calculated elastic constants for different lattice parameters based on the FeC
structure are shown in Figure (a). Elastic constants corresponding to the lattice parameter of Fe
C
, and Fe
C
show a tendency to decrease as the volume increases. However, as C is added, the elastic constants increase, as shown in Figure (b), indicating that the contribution of Fe–C bonding made by the addition of C is much greater than the contribution of the volume expansion.
Figure 7. Comparison of calculated elastic constants of ϵ-carbides. (a) Elastic constants of FeC
structure derived from different lattice parameters (lattice parameters of Fe
C
, Fe
C
, and Fe
C
at equilibrium). (b) Elastic constants of Fe
C
, Fe
C
, and Fe
C
structures.
Summary
The full set of elastic constants has been calculated for each of the compositional varieties of ϵ-carbide, i.e. FeC
, Fe
C
, and Fe
C
. The values obtained indicate that all of these are mechanically stable at zero Kelvin and zero pressure. Unlike cementite [Citation28], the Voigt averaged Young's modulus of ϵ-carbide exceeds that of iron. In a mixture of ferrite and carbide, a greater carbide-modulus would make it more difficult for the carbide to participate in plastic deformation [Citation29], whereas the obvious plasticity of cementite in steel is the basis of strong pearlitic-steel ropes.
The ductility of relatively brittle materials is often modelled in terms of the ratio of the shear to bulk modulus (G/B) on the grounds that the resistance to plastic deformation is related to G, whereas the fracture strength is proportional to B [Citation30–32]. A low value of G/B is then an indication of malleability, whereas a high value corresponds to brittleness. For all compositional varieties of ϵ-carbide ratio of the shear modulus to bulk modulus (G/B) is found to be much greater at 0.48 than is the case for cementite at 0.33. In the case of α-iron and nickel, the ratios are 0.331 and 0.343, respectively [Citation31,Citation32]. Therefore, ϵ-carbide is expected to be brittle, more so than cementite which has demonstrated capabilities of plastic deformation either in its pure state [Citation33] or when incorporated in steel [Citation34]. There is no direct experimental evidence on the brittleness of ϵ-carbide, presumably because of the difficulties in synthesising large enough samples. The only evidence is anecdotal, that ϵ-carbide causes a deterioration in the toughness of steel when the maximum carbide-size becomes about 200 nm [Citation35].
Finally, it is noteworthy that Poisson's ratio of ϵ-carbide (0.35) is greater than that of cementite (0.30 [Citation36]), the effect of which would be to partition more of the strain energy associated with the precipitation into the carbide with a smaller portion residing in the surrounding matrix [Citation37, p.469–470]. Therefore, the coherency strain fields associated with ϵ-carbide should have a smaller extent than is the case for cementite.
Disclosure statement
No potential conflict of interest was reported by the author(s).
Additional information
Funding
Notes
1 The structure in Figure (a) was used to calculate the elastic constants in Hui's study [Citation13]. Figure (b) was used to characterise the effects of Si and Mn substitution in ϵ-carbides [Citation15].
References
- Barrow A, Kang J-H, Rivera-Díaz-del Castillo P. The ε-η-θ transition in 100Cr6 and its effect on mechanical properties. Acta Mater. 2012;60(6–7):2805–2815.
- Song W, Von Appen J, Choi P, et al. Atomic-scale investigation of ϵ and θ precipitates in bainite in 100Cr6 bearing steel by atom probe tomography and ab initio calculations. Acta Mater. 2013;61(20):7582–7590.
- Kim B, Celada CD, San Martín D, et al. The effect of silicon on the nanoprecipitation of cementite. Acta Mater. 2013;61(18):6983–6992.
- Garrison W. Ultrahigh-strength steels for aerospace applications. JOM. 1990;42(5):20–24.
- FB P. Physical metallurgy and the design of steels. London: Applied Science Publishers Ltd; 1978.
- Lai G. On the precipitation of epsilon-carbide in lower bainite. Metall Trans A. 1975;6:1469.
- Murphy S, Whiteman A. The precipitation of epsilon-carbide in twinned martensite. Metall Trans. 1970;1(4):843–848.
- Jack K. Results of further X-ray structural investigations of the iron–carbon and iron–nitrogen systems and of related interstitial alloys. Acta Crystallogr. 1950;3(5):392–394.
- Nagakura S. Study of metallic carbides by electron diffraction part III. Iron carbides. J Phys Soc Japan. 1959;14(2):186–195.
- Dirand M, Afqir L. Crystal structure of carbide precipitates in low-Alloy steels at different tempering stages. Precipitation mechanisms. Acta Metall. 1983;31(7):1089–1107.
- Salloom R, Srinivasan S. Elastic constants and structural stability of non-stoichiometric epsilon ε-Fe2.4C carbide. Mater Chem Phys. 2019;228:210–214.
- Lv ZQ, Zhang FC, Sun SH, et al. First-principles study on the mechanical electronic and magnetic properties of Fe3C. Comput Mater Sci. 2008;44:690–694.
- Hui L, Chen Z-Q, Xie Z, et al. Stability, magnetism and hardness of iron carbides from first-principles calculations. J Supercond Nov Magn. 2018;31:353–364.
- Zunger A, Wei SH, Ferreira LG, et al. Special quasirandom structures. Phys Rev Lett. 1990;65:353–356.
- Jang JH, Kim IG, Bhadeshia H. ϵ-Carbide in alloy steels: first-principles assessment. Scr Mater. 2010;63(1):121–123.
- Kresse G, Hafner J. Norm-conserving and ultrasoft pseudopotentials for first-row and transition elements. J Phys Condens Matter. 1994;6(40):8245.
- Kresse G, Furthmüller J. Efficient iterative schemes for ab initio total-energy calculations using a plane-wave basis set. Phys Rev B. 1996;54(16):11169.
- Perdew JP, Burke K, Ernzerhof M. Generalized gradient approximation made simple. Phys Rev Lett. 1996;77(18):3865.
- Monkhorst HJ, Pack JD. Special points for brillouin-zone integrations. Phys Rev B. 1976;13(12):5188.
- Vitos L. Computational quantum mechanics for materials engineers: the EMTO method and applications. London: Springer Science & Business Media; 2007.
- Grimvall G. Thermophysical properties of materials. Amsterdam: Elsevier; 1999.
- Fang C, Van Huis M, Zandbergen H. Structure and stability of Fe2C phases from density-functional theory calculations. Scr Mater. 2010;63(4):418–421.
- Lv Z, Sun S, Jiang P, et al. First-principles study on the structural stability electronic and magnetic properties of Fe2C. Comput Mater Sci. 2008;42(4):692–697.
- Patil SKR, Khare SV, Tuttle BR, et al. Mechanical stability of possible structures of PtN investigated using first-principles calculations. Phys Rev B. 2006;73:104118.
- Beckstein O, Klepeis JE, Hart GLW, et al. First-principles elastic constants and electronic structure of α-Pt2Si and PtSi. Phys Rev B. 2001;63:134112.
- Chen ZQ, Peng YS, Hu M, et al. Elasticity hardness, and thermal properties of ZrBn (n=1,2,12). Ceram Int. 2016;42:6624–6631.
- Niu H, Chen X-Q, Liu P, et al. Extra-electron induced covalent strengthening and generalization of intrinsic ductile-to-brittle criterion. Sci Rep. 2012;2:718.
- Bhadeshia H. Cementite. Inter Mater Rev. 2019;64:1–27.
- Tomota Y, Kuroki K, Mori T, et al. Tensile deformation of two ductile phase alloys: flow curves of α/γ Fe-Cr-Ni alloys. Mater Sci Eng. 1976;24:85–94.
- Pugh SF. Relations between the elastic moduli and the plastic properties of polycrystalline pure metals, the London, Edinburgh, and Dublin. Philos Mag J Sci. 1954;45:823–843.
- Hecker SS, Rohr DL, Stein DF. Brittle fracture in iridium. Metall Mater Trans A. 1978;9:481–488.
- Cottrell AH. Strengths of grain boundaries in pure metals. In: Charles JA, Smith GC, editors. Advances in physical metallurgy. London: The Institute of Metals; 1990. p. 181–187.
- Terashima T, Tomota Y, Isaka M, et al. Strength and deformation behavior of bulky cementite synthesized by mechanical milling and plasma-sintering. Scr Mater. 2006;54:1925–1929.
- Gil-Sevillano J. Room temperature plastic deformation of pearlitic cementite. Mater Sci Eng. 1975;21:221–225.
- Deng XT, Fu TL, Wang ZD, et al. Epsilon carbide precipitation and wear behaviour of low alloy wear resistant steels. Mater Sci Tech. 2016;32:320–327.
- Umemoto M, Kruger SE, Ohtsuka H. Ultrasonic study on the change in elastic properties of cementite with t temperature and mn content using nearly full density polycrystalline bulk samples. Mater Sci Eng A. 2019;742:162–168.
- Christian JW. Theory of transformations in metals and alloys, part I. 3rd ed. Oxford: Pergamon Press; 2003.