
 ?Mathematical formulae have been encoded as MathML and are displayed in this HTML version using MathJax in order to improve their display. Uncheck the box to turn MathJax off. This feature requires Javascript. Click on a formula to zoom.
Abstract
The presence of undesirable microstructural features in additively manufactured components, such as cracks, pores and lack of fusion defects presents a challenge for engineers, particularly if these components are applied in structure-critical applications. Such features might need to be manually classified, counted and their size distributions measured during metallographic evaluation, which is a time-consuming task. In this study, the performance of two supervised machine learning methods (kth-nearest neighbours and decision trees) to automatically classify typical defects found during metallographic examination of additively manufactured nickel alloys is briefly outlined and discussed.
Additive manufacturing is a near-net shape production technology that utilises a high-energy heat source to selectively melt or fuse together metallic powder to produce a three-dimensional part [Citation1]. Notwithstanding the potential benefits of additive manufacturing technologies for near-net shape production, the presence of internal and external defects in additively manufactured components presents a problem for engineers, particularly if these components are applied in structure-critical applications and in situations where a component is subject to a fluctuating load [Citation2,Citation3]. Common types of internal defects found within additively manufactured parts include; lack of fusion defects, gas porosity, solidification cracks, impurities, solid-state cracks and void formation due to key-hole collapse in certain high energy density processes [Citation4]. Due to their size, such defects (anomalous features or undesirable microstructural features) are detected using X-ray computational tomography [Citation5] or, perhaps more commonly, during metallographic inspection using light microscopy. These features might need to be manually classified, counted and their size distributions measured, particularly in the early stages of process development where parameters such as the heat source power, velocity, hatch spacing and layer height are systematically varied to establish an optimised processing window [Citation6]. Clearly, this can be a somewhat laborious and time-consuming task so the aim of this study is to evaluate whether machine learning can be used to automate this process.
Machine learning is a branch of Artificial Intelligence (AI) originating from pattern identification and cognitive acquisition concepts, which uses computational algorithms that effectively adapt an extensive dataset and produce a usable model to generate predictions based on historical evidence [Citation7,Citation8]. Machine learning is becoming an increasingly powerful tool in the field of materials science and engineering, and has been applied in a range of applications from the identification of breakthrough, high-Tc superconductors [Citation9] to the prediction of unexplored hybrid organic–inorganic perovskites for photovoltaics [Citation10]. With regard to additive manufacturing, Snell et al. [Citation11] explored the suitability of unsupervised learning methods (k-means clustering) for rapidly classifying three common types of pores in titanium and nickel alloys observed via x-ray computational tomography and light microscopy, whilst Scime and Beuth [Citation12] used a computer vision algorithm to classify powder-bed anomalies, such as re-coater streaking and incomplete spreading, during a laser powder bed fusion process. Additionally, Nalajam et al. [Citation13] used three machine learning methods (k-means clustering, support vector machines and random forests) for porosity detection in aluminium alloy thin-walled structures produced by wire-arc additive manufacture.
In this study, supervised machine learning and more specifically, classification algorithms (kth-nearest neighbours and decision trees) are employed to automatically classify different types of defect that are sometimes observed in additively manufactured nickel alloys. A discussion about the basic principles of these algorithms is beyond the scope of this paper and the reader is directed to Lantz [Citation14] for an informative introduction to the topic. Classification algorithms are best used when clean, labelled datasets are available for the machine to learn from. For classification problems, the labelled dataset is typically split into a larger training set and a smaller test set. The larger training set is used to ‘teach’ the algorithm, which is then applied to the training set as a predictive model, from which correct and incorrect predictions of defect type can easily be compared.
A labelled dataset of commonly observed defect types in additively manufactured nickel alloys was created via metallographic examination of the following three nickel alloys processed by selective laser melting: CM247LC, LR8 and Alloy 713C. These specimens were fabricated over the course of a range of research programmes at The University of Sheffield [Citation15,Citation16] and example micrographs showing the typical defects observed in these alloys are given in Figure . Data pertaining to the size and morphology of these defects were obtained from the polished cross-sections using a thresholding and particle analysis tool in the image analysis software, ImageJ [Citation17]. For the purpose of this study, the commonly observed defects were labelled as: ‘Pore’, ‘Crack’, ‘Lack of Fusion (LoF) defect’ and ‘Pore with Crack (PwC)’. In total, 590 defects were labelled and quantitative data describing their size and shape were collated in a comma-separated values (CSV) file. Size and shape descriptors include Feret diameter, circularity, roundness and aspect ratio, and the full list of measured defect characteristics, along with some typical values for these geometrical descriptors, are given in Table .
Figure 1. (a) Example micrograph showing typical defects sometimes found in additively manufactured nickel alloys, along with corresponding binary images of (b) cracks, (c) a pore, (d) a connected pore and crack and (e) a lack of fusion defect.
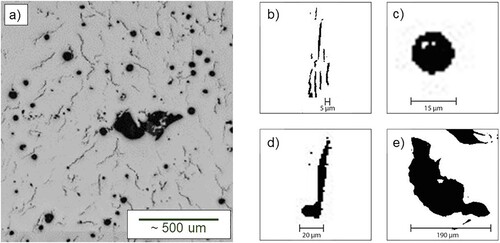
Table 1. Structure of the labelled dataset of defect types observed in additively manufactured Nickel alloys.
Figure is a three-dimensional scatter plot of the 590 defects listed in the labelled dataset in Feret diameter-, circularity- and roundness-space. Pores are characterised by high indices of roundness and circularity and, due to having small Feret diameters, they form a cluster in the top corner of the scatter plot. Cracks are slightly larger than pores and they form a cluster in the left-hand corner of Figure as they are more irregular in shape, although this cluster is considerably more diffuse and is likely to also include ‘Pore with Crack’-type defects. Lack of fusion defects are considerably larger than the other types of defect and, although they are also irregular in shape, they do not fall into a well-defined group in Feret diameter-, circularity and roundness-space.
Figure 2. A normalised 3D scatter plot of the roundness, Feret diameter and circularity of the 590 defects listed in the labelled dataset of defects commonly found in additively manufactured nickel alloys. All feature data were re-scaled to a standard range of 0–1 using Equation (1).
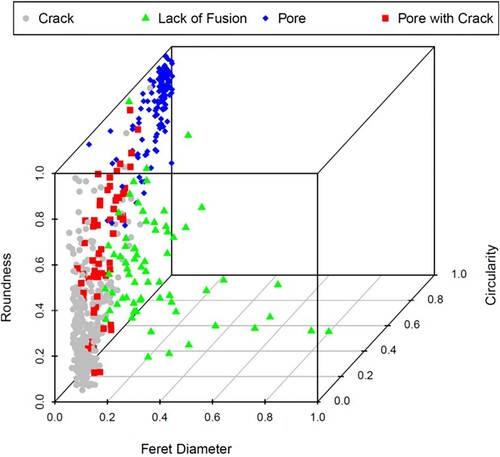
Normalisation of the dataset was performed to ensure that no single size or shape descriptor had a larger influence on the defect classification outcome due to its magnitude. All feature data (x) were re-scaled to a standard range of 0–1 (Xn) using the following minimum-maximum normalisation approach:
(1)
(1) Following this, the normalised dataset was split into a training set (80%) and a test set (20%) using a stratified sampling approach to provide a consistent proportion of each defect type in both sets.
The kth-nearest neighbour (kNN) algorithm used in this study was the ‘Class’ package, which can be embedded into the statistical computing environment, R. The ‘Class’ package uses Euclidean distances to measure the shortest path from a defect in a multi-dimensional plane to the nearest cluster via a straight line and studies have shown that this measurement approach provides the highest classification accuracy if the data are not particularly noisy [Citation18]. With regard to decision trees, various algorithms exist – including classification and regression trees, Iterative Dichotomiser 3, C4.5 and C5.0. Using the ‘divide and conquer strategy’, decision trees find the optimal features within the entire dataset to split recursively into more homogeneous subsets until they are all sufficiently homogeneous. Various splitting criterions exist, such as entropy and information gain, Gini index, Chi-squared statistic and gain ratio. For the classification of defects, the C5.0 algorithm was implemented due to its reported strong performance on ‘out-of-the-box’ problems [Citation14]. The ‘Class’ kNN and the C5.0 decision tree algorithms were selected as these are ‘off the shelf’ packages that can readily be implemented in R.
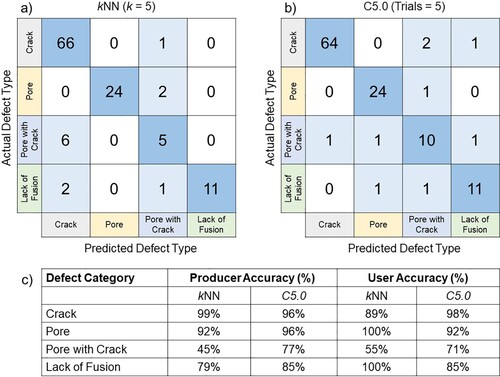
Confusion matrices illustrating the performance of the kNN and C5.0 decision tree algorithms for classifying different types of defect are shown in Figure (a) and (b). For kNN models, the number of nearest neighbours (the k-value) is an important tuning parameter as it determines the bias-variance trade-off within the model, which is crucial for representing its accuracy and ability to generalise towards new unseen data. A range of k-values were therefore tested to monitor its influence on model performance and it was found that k values of 5 and 7 yielded the highest model accuracy by classifying 89.8% of the defects correctly. The C5.0 decision tree performed marginally better than the kNN algorithm, with an overall accuracy of 92% after 5 trials. With an increasing number of trials, model accuracy fluctuated between 90% and 92% and, considering a minimum trial value of 5 provided the maximum classification accuracy while keeping the mean tree size to a minimum, it was deemed to be the optimal trial value for this investigation. The accuracy of the algorithms varied between the different defect categories however, with both performing well when classifying pores and cracks, but accuracy was significantly reduced for the other defect types (in particular, the ‘Pore with Crack’-type defects). The user and producer accuracies of the kNN and C5.0 decision tree algorithms for each defect category are listed in Figure (c).
Figure 3. Confusion matrices illustrating the performance of the (a) kNN and (b) C5.0 decision tree algorithms for classifying different types of defects in the test dataset. The user and producer accuracies of the kNN and C5.0 decision tree algorithms for each defect type are provided in (c). The total number of defects in the test dataset is 118.
It should be noted that only a limited amount of information about classification performance on a broader scale can be drawn from confusion matrices. Additional performance measures such as sensitivity, precision, recall and the kappa (κ) statistic are available to engineers working with machine learning models [Citation14]. For instance, the (κ) statistic provides a metric of how well the predicted and actual examples agree with each other; values of κ < 0.2 suggest poor agreement, whilst values in excess of 0.8 suggest good or very good agreement [Citation14]. Values of κ = 0.81 and 0.88 (2 d.p.) were calculated for the kNN and decision tree models, respectively.
Overall, the nearest neighbour and decision tree algorithms performed well in classifying defect types in the test dataset. Both algorithms were particularly effective in correctly predicting whether a defect was a crack or a pore, but were less effective at correctly classifying lack of fusion features and situations where a pore and crack were connected. The latter is probably because defects labelled as ‘Pore with Crack’ fall somewhere between the clusters of pores and clusters of cracks in Figure . Furthermore, there is a natural bias in the defect type dataset (e.g. cracks and pores are more common that lack of fusion defects) and this may influence the prediction of the machine learning algorithms. Nevertheless, the ‘Class’ kNN and C5.0 decision tree algorithms are straightforward to implement in the statistical computer environment, R, and both undergraduate and postgraduate taught aerospace engineering students at The University of Sheffield have successfully deployed both approaches for classifying defects found via metallography without any prior experience of machine learning. The labelled dataset of 590 defects and the R scripts for importing the dataset and applying the ‘Class’ kNN and C5.0 decision tree algorithms can be made available on request.
Acknowledgements
The authors wish to thank Dr Gavin Baxter for useful comments during the preparation of this article.
Disclosure statement
No potential conflict of interest was reported by the author(s).
References
- Bourell D, Wohlers T. Introduction to additive manufacturing. In: David L. Bourell, William Frazier, Howard Kuhn, editors. ASM handbook, volume 24, additive manufacturing processes. Materials Park: ASM International; 2020. p. 3–10.
- Kaletsch A, Qin S, Herzog S, et al. Influence of high initial porosity introduced by laser powder bed fusion on the fatigue strength of Inconel 718 after post-processing with hot isostatic pressing. Addit Manuf. 2021;47:102331.
- Poulin JR, Kreitcberg A, Terriault P, et al. Fatigue strength prediction of laser powder bed fusion processed inconel 625 specimens with intentionally-seeded porosity: feasibility study. Int J Fatigue. 2020;132:105394.
- Brennan MC, Keist JS, Palmer TA. Defects in metal additive manufacturing processes. In: David L. Bourell, William Frazier, Howard Kuhn, et al., editors. ASM handbook, volume 24, additive manufacturing processes. Materials Park: ASM International; 2020. p. 277–286.
- Tammas-Williams S, Zhao H, Léonard F, et al. XCT analysis of the influence of melt strategies on defect population in Ti–6Al–4 V components manufactured by selective electron beam melting. Mater Charact. 2015;102:47–61.
- Thomas M, Baxter GJ, Todd I. Normalised model-based processing diagrams for additive layer manufacture of engineering alloys. Acta Mater. 2016;108:26–35.
- Edgar TW, Manz D. Machine learning. In: Research methods for cyber securitySyngress; 2017. p. 153–173.
- Talukder MA, Islam MdM, Uddin MdA, et al. Machine learning-based lung and colon cancer detection using deep feature extraction and ensemble learning. Expert Syst Appl. 2022;205:117695.
- Meredig B, Antono E, Church C, et al. Can machine learning identify the next high-temperature superconductor? Examining extrapolation performance for materials discovery. Mol Syst Des & Eng. 2018;3(5):819–825.
- Lu S, Zhou Q, Ouyang Y, et al. Accelerated discovery of stable lead-free hybrid organic-inorganic perovskites via machine learning. Nat Commun. 2018;9(1):3405.
- Snell R, Tammas-Williams S, Chechik L, et al. Methods for rapid pore classification in metal additive manufacturing. JOM. 2020;72(1):101–109.
- Scime L, Beuth J. Anomaly detection and classification in a laser powder bed additive manufacturing process using a trained computer vision algorithm. Addit Manuf. 2018;19:114–126.
- Nalajam PK, V R. Microstructural porosity segmentation using machine learning techniques in wire-based direct energy deposition of AA6061. Micron. 2021;151:103161.
- Lantz B. Machine learning with R. 2nd ed. Birmingham: Packt Publishing; 2015.
- Boig C. The application of additive manufacturing to nickel-base superalloys for turbocharger applications. 2019, University of Sheffield.
- Liu C. Selective laser melting of nickel superalloys for aerospace applications: defect analysis and material property optimisation. 2021, University of Sheffield.
- Rasband WS, Image J. U. S. National Institutes of Health: Maryland, USA, https://imagej.nih.gov/ij/, 1997–2018.
- Khanzadeh M, Chowdhury S, Tschopp MA, et al. In-situ monitoring of melt pool images for porosity prediction in directed energy deposition processes. IISE Trans. 2019;51(5):437–455.