
Abstract
Inclusionary housing is considered a powerful local policy tool that can help address housing affordability and social inclusion issues. This paper draws from empirical research conducted in the City of Santa Monica in California to provide fresh insights on a successful innovative inclusionary housing program, the Affordable Housing Production Program (AHPP). This program was established to increase affordable housing production and enable social integration. Based on the Land Use and Circulation Element (LUCE) of the General Plan, the AHPP seeks to capture some of the increase in land value resulting from planned increases in the intensity of development. Our research shows that the program increased inclusionary housing production by market-rate developers by 15% over the previous inclusionary housing policy. The study finds that land use policies and planning can, through inclusionary housing, help harness the strength of the real estate market to (1) increase affordable housing production, and (2) achieve effective social integration in neighborhoods of opportunity.
1. Introduction
Faced with the reality of the critical importance of housing, many countries continue to formulate and implement policies aimed at increasing the stock of affordable housing. However, according to the World Bank (Citation2017), housing remains largely inaccessible and unaffordable. UN Habitat (Citation2016) argues that the housing policies put in place over the last 20 years have failed to promote adequate affordable housing. Governments have backed away from direct supply without giving sufficient consideration to the markets and to a regulatory framework that would enable other actors in the process to step forward and provide adequate affordable housing. Housing availability and affordability remains a major pillar in pursuing the Sustainable Development Goals (SDGs) as identified by the United Nations in Habitat III (United Nations, Citation2016; Trillo, Citation2019a).
This paper focuses on Inclusionary Housing (IH) which is one of the tools for providing affordable housing and is considered effective in helping to build inclusive communities in many countries worldwide (Jacobus, Citation2015; Schwartz et al., Citation2012; Calavita & Mallach, Citation2010). Many cities in the USA have experimented with reversing the trend of housing unaffordability and exclusion by promoting IH (Thaden & Wang Citation2017). In fact, IH is seen as a solution that may incorporate economic integration when on-site affordable housing is required, resulting in mixed-income developments (Trillo, Citation2019b). There are wide variations in the policy design and implementation of IH across the USA and Thaden & Wang (Citation2017) have provided a taxonomy of these.
According to some scholars IH has promised more than it has delivered (Powell & Stringham, Citation2004a, Citation2004b, Citation2005; Schuetz et al., Citation2011; Hollingshead, Citation2015; Metcalf, Citation2018); however, there is still a robust scholarship that supports the contribution of IH in achieving a higher level of housing affordability and social integration (Sturtevant, Citation2016; Basolo & Calavita, Citation2004; Kautz, Citation2002; Hickey, Citation2014). Hickey et al. (Citation2014) add that there is a need for a better understanding of the characteristics associated with successful programs, particularly in different legal, economic and political climates, and recommend that future research is conducted to rigorously evaluate which models work best.
This paper contributes to help fill a gap in the existing scholarship, i.e. the paucity of studies on the outcomes’ evaluation of extant IH programs at the local scale and, in particular, the evaluation of the level of social integration achieved. Very few studies offer a systematic and comprehensive assessment of a particular IH program in terms of its modifications and associated impacts over a significant timeframe at the local level. Jacobus (Citation2015) observed that empirical research on the scale, scope, and structure of inclusionary programs and their impacts is still limited. It is not clear in the literature how changing a monolithic affordable housing program to include discretionary tier-based density incentives tied to affordable housing requirements motivates developers.
Additionally, Schwartz et al. (Citation2012) observe that little research has been conducted to determine whether inclusionary policies are having the intended inclusionary effect for IH recipients. With respect to these research gaps, this paper offers an original contribution through an in-depth case study of an IH program, assessing its actual outcomes over a significant timeframe. The paper focuses on the Affordable Housing Production Program (AHPP) based on the Land Use and Circulation Element (LUCE) 2010 in the City of Santa Monica in California to understand its characteristics and context under which it was developed and is being implemented. The study answers questions regarding why and how the city’s IH program has changed over time and the effect on program goals of increasing the stock of affordable housing and enabling social integration. In so doing, the paper makes a significant contribution to the IH international debate on what works and why in different contexts.
2. Equity planning & housing tools: Inclusionary housing and land value capture
2.1. Inclusionary housing: an overview
Inclusionary Housing (IH) embraces land use regulations that require developers of market-rate residential developments to set aside a small portion of their units, usually between 10 and 20 percent, for households unable to afford housing in the market. Alternatively, they can choose to pay a fee or donate land in-lieu of providing units (Calavita & Mallach, Citation2009). IH requirements are sometimes in exchange for development rights or zoning variances (Schwartz et al., Citation2012). IH programs vary and, therefore, other narrower or broader definitions of IH can be found in the literature. For this paper, the researchers use the above definition because this study is based on a single-case strategy. There is almost complete consensus in the literature that the main role of IH is to increase housing affordability and increase social and economic integration (Calavita & Mallach, Citation2010; Davison et al., Citation2013; Hickey et al., Citation2014; Schwartz et al., Citation2012; the Urban Institute, Citation2012; Williams et al., Citation2016;). In fact, the reason why these policies are considered “inclusionary” is because they are intended to allow lower- and moderate-income households to buy or rent property in middle- and upper-income communities (Schwartz et al., Citation2012). According to the Urban Institute (Citation2012), IH is seen as attractive to policymakers because it is cost effective since the public sector mainly only bears the administrative costs with construction and financing costs being borne mainly by the private sector. However, this is not always the case, since in some programs, the public sector also bears the cost of tax abatement and the fee waivers granted to developers (Non-Profit Housing Association of Northern California, Citation2007).
2.2. Ih programs in the USA: characteristics and output
2.2.1. Ih program characteristics: an overview
IH programs exhibit varying characteristics in policy and design. They are relatively complex and tailored to local conditions (Hickey et al., Citation2014; Thaden & Wang, Citation2017). Thaden & Wang (Citation2017) argue that very little is known about IH and its characteristics unlike other affordable housing programs. One consequence is that policymakers, city staff, and stakeholders are uncertain about adopting the tool. Just as housing markets across the US vary largely, so do the policies and laws governing IH (Rusk et al., Citation2010). The ways in which IH programs are structured and implemented also vary systematically across states, in response to the amount and type of authority over land use policies granted to local governments by the states, as well as to the differences in the states’ land use programs and initiatives to produce affordable housing (Schuetz et al., Citation2009). As the housing market has changed, IH policies and laws have been enacted, amended and in some cases ended (Rusk et al., Citation2010). Some existing programs have been modified, suspended, or repealed (Wiener & Barton, Citation2014).
IH policies in the USA vary greatly in detail, but share common characteristics (Wiener & Barton, Citation2014). Many IH programs permit onsite or offsite affordable housing production. Wiener & Barton (Citation2014) list alternatives that IH programs offer to private developers in lieu of building below market-rate homes on the same site as the market-rate homes. These alternatives include options to: (1) partner with a non-profit organization that agrees to build the units; (2) build the units offsite or convert existing units under certain conditions; (3) dedicate land to the local government that will accommodate a comparable number of units; (4) pay an ‘in lieu’ fee to the local government to be used for affordable housing; or (5) build more than the required units in exchange for reducing the requirement in another development. Most programs also include incentives that reduce the developer costs of building the below market-rate units. These incentives include density bonuses; flexible design and development standards, such as a reduction in unit square design; parking concessions; fee waivers, reductions, or deferrals; tax abatements; expedited permit processing; financial offsets, such as such as direct subsidies; assistance in application for public funds, such as rent subsidies, bond financing, community development block grants (Calavita & Mallach, Citation2010; Jacobus, Citation2015; Mukhija,Lara & Ashok, Citation2010; Schuetz et al., Citation2009; Wiener & Barton, Citation2014). As Wiener & Barton (Citation2014: 405) indicate, ‘‘these incentives not only mitigate costs, but often make the adoption of IH programs more politically palatable’’. IH ordinances differ in the portion of a development’s units that are required to be affordable, in the income level of the target population, and in the length of time the affordability requirements must be met. There are requirements that affordability remains in place longer for rental units than for ownership units and jurisdictions frequently increase these durations over time (Schuetz et al., Citation2009).
Opinions expressed within the academic and professional literature regarding the IH program characteristics vary. For example, Thaden & Wang (Citation2017) and Calavita & Mallach (Citation2010) support prioritizing on-site affordable housing development, hence placing affordable housing in neighborhoods of opportunity. Rusk et al. (Citation2010) emphasize the importance of not only producing affordable homes, but also of ensuring their long-term affordability. Additionally, Brat (Citation2012) observes that policy makers have begun to recognize the importance of the affordability restriction period. Hickey et al. (Citation2014) argue that, even as IH programs have become more prevalent, there is a lack of information on the successful strategies for facilitating lasting affordability.
2.2.2. Ih programs in the USA: spread and output
IH has spread across many states in the USA. Thaden & Wang (Citation2017) identified 1,379 IH programs within 791 jurisdictions located in 24 states and in the District of Columbia, with the vast majority of the jurisdictions being located in New Jersey (55.11 percent), Massachusetts (26.11 percent), and California (10.44 percent). However, it is important to note that these numbers are influenced by a state mandate requiring affordable housing production in each locality in New Jersey and Massachusetts. In contrast, in California there is no state mandate but instead a number of cities have adopted either voluntary or involuntary IH in their housing elements in attempts to boost affordable housing production (Cotter, Citation2014; Calavita & Grimes, Citation1998, 2007). This spread in adoption of IH in the USA and even in other countries can be described as successful. This success may be understood on many fronts. Ponce (Citation2010) argues that IH may be understood as a new pragmatic approach by governments in their efforts to provide affordable housing after many countries diminished their direct involvement in the provision of affordable housing after neo-liberalism arose. Ponce argues that, from a governmental perspective, IH can also be viewed as an outcome that can be achieved by public-private partnerships. Ponce (Citation2006) observes that, in connection with its goal of achieving social inclusion, IH can also be understood to be a reaction against past social housing practices and urban segregation. According to Calavita (Citation2004), the primary reason behind the spread of inclusionary housing programs in California was high housing costs.
IH programs have produced a considerable number of affordable housing units in the market in the USA although statistics on the overall production are inconclusive and incomplete, with Calavita & Mallach (Citation2010) estimating 129,000 to 160,000 units with half of that number being produced in California. Thaden & Wang (Citation2017) reported a total of 173,707 units of affordable housing and $1.7 billion in impact and in lieu fees produced by some of the 1,379 IH programs identified. However, although their report is the most recent survey, as Thadon & Wang agree, these numbers are substantially underestimated since only a proportion of the programs are represented and some jurisdictions in the survey did not report their production and fees for their programs.
2.2.3. Ih programs in the USA: success, effectiveness and impacts on the housing market
The debate on the success and effectiveness of IH has been alive for a while. Calavita & Grimes (Citation1998) considers that IH in California and New Jersey has enjoyed a certain degree of success. Calavita & Mallach (Citation2010) argue that IH, as one of the tools for addressing affordable housing, promotes social and economic integration when on-site affordable housing is provided. The Urban Institute (Citation2012) examined IH programs in Montgomery County, Maryland, and Fairfax County, Virginia and found that the revision of program requirements, which both counties execute every few years or so, may be a disincentive for a builder to pursue IH units because of the ordinance complexity. They also found that incentives, such as density bonuses, were relatively ineffective in the two cities in motivating developers to produce more affordable units than the minimum percent required by each ordinance. The Urban Institute found that developers in Montgomery (which had the highest output of IH units in the country) had got accustomed to the program’s requirements, viewed it as part of the cost of doing business and believed that the benefits outweighed the costs.
Although their intended goal is to promote housing affordability and socio-economic integration, IH policies have received their fair share of criticism regarding their potential unintended market consequences. As Jacobus (Citation2015) says, their adoption has almost always been controversial. Hollingshead (Citation2015) argues that to the extent that IH policies create opportunity costs for developers and function like a tax on housing supply, they may stifle housing production and increase the price of market-rate units, reducing overall affordability. Hollingshead adds that IH may also increase the supply of affordable housing, which would place downward pressure on prices. This argument awakens a consistent concern in the literature on who should bear, or who actually bears, the cost of IH. The argument seems to ignore the potential of the market to absorb IH costs when developers are compensated through increased density and other incentives. Jacobus (Citation2015) debunks the suggestion that developers pass on the costs of IH to tenants and homebuyers by explaining that local real estate market sets the prices of the market-rate units, and that the developers of one project cannot change the overall market price or rent. Although Jacobus suggests that the costs associated with construction of IH are either absorbed by modest declines in land prices or by reductions in developer profits, or some combination of the two, we find that there is no empirical analysis to find out if the market can adequately be harnessed to ensure that no one bears the cost apart from the market itself.
The effectiveness of an IH program depends critically on how it is designed and on the nature of the local housing market (Sturtevant, Citation2016). Using data on IH in the San Francisco metropolitan area and suburban Boston, Schuetz et al. (Citation2009) analyzed how much affordable housing the programs produced and how IH affects the prices and production of market-rate housing. They found that the amount of affordable housing produced under IH was modest and depended primarily on how long IH was in place. They reported that the results from suburban Boston suggested that IH contributed to increased housing prices and lower rates of production during periods of regional house price appreciation although the estimated effect was relatively small. The results suggested that a 1 per cent increase in the time since IH was adopted was associated with a 0.06 per cent decrease in annual single-family permits, and a 0.014 per cent increase in prices, although weakly statistically significant. In the San Francisco area, IH also appeared to marginally increase housing prices by 0.013 percent in times of regional price appreciation, but to decrease prices during cooler regional markets. However, a more recent study by Hollingshead (Citation2015) which examined the impact of IH using the 2009 Palmer/Sixth Street Properties LP v. City of Los Angeles ruling did not find any evidence that weakening an inclusionary policy is associated with a decrease in the rental price of high-cost housing units. The results also suggested that IH policies, before the Palmer ruling in general, did promote housing affordability in the low-cost market. The Palmer ruling had weakened IH particularly for rental housing as the appellate court ruled that California municipalities could not have mandatory IH ordinances for rental housing development, which was deemed an illegal form of rent control. Further, Schuetz et al. (Citation2009) found no evidence of a statistically significant effect of IH on new housing development in the Bay area. Mukhija et al. (Citation2010) also compared data for communities with and without IH in Southern California and concluded that the adoption of IH policies had no impact on the overall rate of production. Therefore, if IH does not decrease the supply of housing, it cannot lead to price increase particularly when it is accompanied with density bonuses and zoning variances which enable developers to produce more units.
Knaap et al. (Citation2008) found that IH programs had significant effects on housing markets in California from 1988 to 2005. Although cities with existing or new programs during the study period did not experience a significant reduction in the rate of single-family housing starts, they did experience a marginally significant increase in multi-family housing starts. More specifically, they found that, in municipalities with IH programs, the share of multi-family housing starts increased seven (7) percent. The magnitude of this shift varied with the stringency of the inclusionary requirements. They found that housing prices in cities that adopted IH increased about 2-3 percent faster than cities that did not adopt such policies. In addition, they found that housing price effects were greater in higher priced housing markets than in lower priced markets. These findings suggest that housing producers did not in general respond to inclusionary requirements by slowing the rate of single-family housing construction but did pass the increase in production costs on to housing consumers. Further, housing producers were better able to pass on the increase in costs in higher priced housing markets than in lower priced housing markets. Finally, Knap et al. found that the size of market-rate houses in cities that adopted IH increased more slowly than in cities without such programs. Their findings suggested that IH programs caused housing producers to increase the price of more expensive homes in markets where residents were less sensitive to price, and to decrease the size of less expensive homes in markets where residents were more sensitive to price. However, the above study did not specify which IH programs had extended incentives such as density bonuses and seems to ignore the contribution of such incentives in the housing price mechanism. Powell & Stringham, (Citation2004a, Citation2004b, Citation2005) argue that IH is still a price control that leads to a decrease in the amount of housing. Powell & Stringham (Citation2004a) found that in cities with IH policies, permits declined 10 to 30 percent in the seven years after the policies were adopted. However, Basolo & Calavita (Citation2004) criticized these findings and argued that the study could be interpreted only as descriptive, not as proof of a causal relationship between inclusionary housing policies and housing market outcomes as it relied on questionable assumptions and had several technical limitations. In fact, what Powel and Stringham seem to miss in their argument is that where IH requirements are accompanied with increased density or change of zoning, the net effect will be increased overall housing production.
There seems to be persistent criticism that IH could theoretically diminish the supply of housing and therefore increase prices, but there is no agreement about how often this happens or how significant the impact is (Jacobus, Citation2015). Based on the mixed results from scholarship, it is easy to agree with Sturtevant (Citation2016) that IH policy should be considered as one component of a comprehensive affordable housing strategy. As Ziebarth (Citation2013: 369) states, “It remains to be seen whether or not inclusive housing can overcome that negative perception and promote sufficient affordable housing units to meet what seems to be an ever-increasing need as the gap in income widens between the haves and the have-nots”.
2.2.4. Ih programs in the USA: intervening factors and opportunities
In addition to criticism, IH advocates have had to deal with many intervening factors that can, and have, influenced IH outcomes, including NIMBY (Not in My Back Yard) opposition (Calavita & Mallach, Citation2010; Davison et al., Citation2013). Some wealthy communities have mounted extended resistance to allowing any affordable housing in their borders with years of lawsuits, appeals, and countersuits imposing high costs on both local governments and developers (Massey et al., Citation2013). ‘‘Organized neighborhood opposition adds additional, costly delays and can kill projects’’ (Wiener & Barton, Citation2014: 408). However, Wiener & Barton argue that simultaneity can preempt local resistance. When the affordable units are built generally at the same time as the market-rate units, concurrent development can mitigate opposition from existing neighbors. After the 2009 Palmer ruling, many jurisdictions in California rolled back mandatory policies that apply to rental development (Thaden & Wang, Citation2017). But the passage in 2017 of Assembly Bill 1505 (popularly known as “Palmer fix” Bill) gives counties and cities in California power to implement IH on rental projects again. “The success of enabling legislation in California adds major momentum to the fight for IH in the state and beyond” (Murray, Citation2017).
IH has been shifting towards promoting higher density with increased bonuses, floor area ratios, and height and there is strong support in the literature for increasing density in our cities. Lynch (Citation1981) argues that no city can physically reach a point where they cannot (or should not) add population. He observes that a great range of settlement and urban density patterns across the world, and in USA cities, are not especially dense. Metcalf (Citation2018) sees limits to growth in a metropolitan area as political and aesthetic, not physical. Metcalf says that planning decisions make housing for most people vastly more expensive than it has to be by restricting the supply of new units even in the face of growing demand. Furthermore, more and more communities have been consciously seeking to promote mixed-income development (Jacobus, Citation2015).
2.3. Inclusionary housing and land value capture
Land Value Capture is a planning mechanism through which increases in land value resulting from public investments, land-use plan changes and upzonings, are captured for public benefit. This approach is based on the fact that most of these increases in value are the result of a public action, not from landowners’ actions. One of the classical economists, Mill (1848), referred to these increases as the “unearned increment.” When understood in this light, is only fair and equitable for the public to appropriate – capture - a reasonable share of the increased land value in the form of community benefits, including affordable housing. Land Value Capture (LVC) is one tool utilized in some European and South-American countries (Calavita and Mallach, Citation2010), and is now starting to be used in the US as well (Calavita, Citation2015).
Value increases resulting from land use changes can be captured through IH in two ways: (1) when a locality mandates IH the cost of development increases and it is likely that, “in the long run” (Mallach Citation1984), land values will decrease to reflect the additional costs for the developer; i.e., developers will negotiate for lower land prices, or (2) when through upzonings or plan changes possible densities are increased, the value of land increases as well and, through additional IH requirements, a portion of that land value increase is captured for public benefit. As we shall see, it is through this second mechanism that the City of Santa Monica was able to generate more inclusionary units. With this approach then, IH relies on LVC to capture some of the increase in land value (through increased affordable housing requirements) brought by increased density (Nzau & Trillo, Citation2019). With LVC affordable housing is generated “through the planning system” (Monk, Citation2010).
LVC should be distinguished from density bonus approaches in that, at least theoretically, with density bonuses the value of the amenities (such as affordable housing or open space) required from the developer is equivalent to the value of the additional units to be gained from the density increases. Such an exchange, generally voluntary, should leave the value of the land unchanged. If the value of the additional requirements is higher than the value of the density bonus, the project will be made infeasible. If the value of the incentives is higher, the value of the land is likely to increase. Usually, the density bonus is applied to individual projects and not on the basis of a plan. With LVC the locality will capture some of the “enhanced value” resulting from any plan changes with the landowner gaining the rest. Such decisions are based on economic studies, usually referred to as “Residual Land Value Analyses”. How this scenario “plays in real life will depend on the market and circumstances in a given locale” (Calavita, Citation2015: 4). This paper will show how this dynamic unfolded over a period of seven years in the context of Santa Monica.
3. Research methodology
This study is based on a mixed research approach and a single case study strategy. The case of LUCE 2010 program was selected on purpose as it met the main criteria which included: (i) the program being identified as best practice in literature and corroborated through informal interviews with academic experts in the field, and (ii) the program having been in operation for at least five years to enable an evaluation of the results. Thus, firstly, the LUCE 2010 program has been considered best practice in some IH literature (Calavita & Wolfe, Citation2014; Hickey, Citation2014) and, secondly, IH has been implemented in the city for a long time evolving into the present LUCE 2010 based Affordable Housing Production Program (AHPP). This has allowed for the evaluation of the program and an assessment of the impacts of LUCE on AHPP.
Data collection was carried out over a ten (10) months’ period from April 2018 to January 2019. Secondary data were gathered from the city offices and websites while primary data were gathered through interviews, surveys and field observations. The secondary data collected included program characteristics, the number of both market-rate and affordable housing units produced over the years for different programs, and the levels of affordability of the housing units produced. Primary data were gathered through interviews, complemented by surveys and field observations. The authors interviewed planners, city officials, developers, academia, community leaders and affordable housing advocates. Ten (10) persons were purposively selected (including 3 local city officials, 2 academicians, 2 developers and 3 community advocates/leaders), all experienced in the field of IH and affordable housing in the Santa Monica area. The primary data collected from planners and city officials are related to issues on program ordinance including motivation, formulation process, the context of adoption and implementation, affordability enforcement, outcomes, and on the challenges encountered. Developers were interviewed regarding their participation in program formulation and implementation, their knowledge and views on the options available to them, and the construction and management of housing units. Academia, community leaders and affordable housing advocates provided information regarding community participation, their interests and interactions with the planners and city officials.
Interviews were complemented by a survey undertaken among IH residents. Their selection was undertaken through cluster, stratified and simple random sampling techniques to ensure representation of the population. The clusters were based on the location of the households in the city, while the stratification was based on the type of housing occupied (market-rate or affordable), hence two stratums. A list of addresses of all IH projects was obtained from the city’s department of housing and economic development. A grid was prepared covering the whole city and then samples of IH projects picked in each grid (unless none was available in a grid) through simple random sampling. A total of 20 buildings were identified. Subsequently, their property managers were approached and requested to help in serving questionnaires to the residents. According to the city records, there were 135 buildings with IH in Santa Monica as at 2017 and the buildings sampled represents 15% of the total IH building population. In each building, 2-4 questionnaires were administered to the market-rate households and 1-3 questionnaires to the affordable rate households depending on the number of units in the building. The total number of questionnaires administered were 85. Of these, 64 or 75% were returned (39 market-rate occupants and 25 affordable housing occupants). shows the demographics of the sample.
Table 1. Demographics of the survey sample.
Residents were asked questions regarding their demographic and household characteristics (including gender, age, race, number and age of children), period of residence, interaction with neighbors, access to social services and public amenities, and their own views on the level of social and economic integration. Field observations and a photo survey of the extant IH projects were also undertaken during repeated fieldwork sessions.
4. Setting the context for the case study
4.1. The santa monica housing market
Santa Monica is a relatively small coastal city to the west of Los Angeles city within Los Angeles County, California State. and summarize the city’s demographic characteristics.
Table 2. Population & race distribution, Santa Monica citywide.
Table 3. Age and Gender Distribution, Santa Monica citywide.
There is growing concern that housing in the city is becoming increasingly unaffordable for the vast majority of its residents (City of Santa Monica, Citation2013). Demand for affordable housing in the city is high (The Urban Land Institute, Citation2004) and developers are increasingly undertaking high-density multi-family developments. Development has continued to occur by converting lower-intensity land uses to higher density uses. Multi-family developments of five or more units are increasing in dominance, growing from 65% to 67% between 2000 and 2010. Single-family attached and detached homes decreased and stood at 23% in 2010 while smaller two- to four-unit multi-family complexes represented 10% of the housing stock. Mobile homes comprised less than 1% of all Santa Monica residences at the time. (City of Santa Monica, Citation2013). The median value of owner-occupied housing units in the city is higher than the state’s and the nation’s average as shown in .
Table 4. Median value, median gross rent & home ownership in Santa Monica (2013-2017).
It is important to explain at this point how affordable housing is understood in the city. The California state defines affordable housing as housing which is affordable to, and occupied by, households of low and moderate-income paying rent not exceeding 30 percent of the corresponding Area Median Income (AMI) for each income group adjusted for household size appropriate for the unit. AMIs for all areas of the country are published annually by the U.S. department of housing and urban development. For Los Angeles county, the 2017 AMI was $64,300 a year for a family of four. Moderate-income households’ income is between 81 percent and 120 percent of AMI and low-income households’ income does not exceed 80 percent of AMI. The low-income households are further categorized into extremely low-income, very low-income and low-income. The extremely low-income households’ income does not exceed 30 percent of AMI, very low-income households’ income is between 31 and 50 percent of AMI and low-income households’ income is between 51 and 80 percent of AMI.
4.2. Inclusionary housing as a tool for affordable housing provision in the city of santa monica
The City of Santa Monica has implemented various IH programs since the late 1980s. The genesis of IH in the city can be traced to 6th November 1990 when the voters passed proposition R, which required that 30 percent of all new multi-family residential housing units produced in the city annually be affordable to low and moderate-income people with at least fifty percent of the affordable units being for the low-income households.
Since 1990 there have been various implementing ordinances passed by the council. The current Affordable Housing Production Program (AHPP) was implemented in July 1998. According to the city’s municipal code, AHPP (which implements proposition R) allows developers of new multi-family housing to satisfy their affordable housing obligation through a variety of options as listed below:
Including affordable units in the market-rate project,
Developing affordable units at another location in the city,
Paying a fee in-lieu of developing affordable units,
Dedicating land to the city or to a non-profit housing development entity.
The housing requirements under each option are summarized in .
Table 5. Affordable housing production programme options in Santa Monica.
5. Innovation in affordable housing policies and planning: AHPP under the land use and Circulation element (LUCE) 2010
On 6th July 2010, the City of Santa Monica adopted a new Land Use and Circulation Element (“LUCE”) of the General Plan (City of Santa Monica, 2010). Among other objectives, LUCE was designed to encourage additional housing in a sustainable manner where few or none existed. The plan accomplishes this by establishing a maximum ministerial base building height of 32 feet and requiring that projects over the base height incorporate community benefits, with affordable housing identified as a primary community benefit. The program, therefore, allows more Floor Area Ratio (FAR), height and density but captures the resultant gains in land values by requiring additional affordable housing in the development. This is undertaken through three approval tiers or procedural paths which were established to regulate development. The tiers are tied to the type of development, its location and intensity. The program provides for prerequisite ministerial (by-right) approval of projects that meet all the applicable requirements and do not exceed the base height and two optional tiers, both of which would require applicants to provide community benefits (including affordable housing) in order to receive approval to increase the project’s height and/or floor area.
compares the Affordable Housing Production Program (AHPP) Pre-LUCE 2010 and the AHPP Post-LUCE 2010
Table 6. Pre-LUCE & Post-LUCE 2010, Santa Monica.
The LUCE 2010 program required economic analyses during the planning phase to determine ‘enhanced land values’ resulting from higher densities. These analyses indicated that projects would be financially feasible even after providing community benefits. Such analyses are also required for individual projects seeking tier 2 or tier 3 height bonuses and provide context for the city’s decision-making over what level of community benefits is to be required (Hickey et al., Citation2014).
LUCE 2010 established three tiers which are summarized in : Tier 1 is the basic option, which establishes the base height and FAR, with no additional community benefits required. However, under Tier 1, developers are rewarded with additional floor if they provide affordable housing on-site or close to transit corridors (if they choose the off-site option). Under Tier 1, all apartment projects can pay fees in-lieu of including affordable units but for condominium projects, only those of 3 units or less, or projects located in commercial zones, can pay fees in-lieu of including affordable units. For developers who choose to provide affordable units offsite, the location where they develop them should be within a quarter (¼) mile of the market-rate project. An exception to this rule may be granted if the developer provides substantial evidence that the location of the off-site units in a location different from that required better accomplishes the goals of affordable inclusionary housing, that is, maximizing affordable housing production and dispersing affordable housing throughout the city.
Table 7. Tiers under Santa Monica’s LUCE 2010.
Tier 2 allows additional height and FAR through a ministerial approval process. Tier 2 housing projects must provide 50% more affordable units than Tier 1 either onsite or offsite. They cannot pay fees in-lieu of providing affordable units. Tier 3 allows more height and FAR than Tier 2 but requires development agreements to be signed between the city and the developers with a public review. Tier 3 differs substantially from both Tier 1 and Tier 2 mechanisms of implementation because it rests on negotiation whereas Tier 1 and Tier 2 are plan based. Tier 3 is applied only on large projects while Tier 1 and Tier 2 cover small to medium projects. So far, Tier 3 has been applied on a limited number of cases, while Tier 2 represents the most common way of implementing the LUCE plan (Interviews with city officials of the City of Santa Monica, December 2018).
summarizes the LUCE 2010 program and shows how, by progressing from Tier 1 to Tier 3, the public benefits in terms of a higher percentage of affordable housing required to be provided as the developers get more height and FAR.
6. Towards an evaluation of LUCE 2010
We began by seeking to understand what has been pushing the city to seek for innovative ways of financing affordable housing. Interviews with city officials and documents availed revealed several compelling factors. Firstly, the reduced federal support of public housing since the 1970s has resulted in a housing shortage manifested in low vacancy rates and rising rents. Secondly, the dissolution of the Redevelopment Agency (RDA) in 2012 affected the city’s affordable housing production as RDA was the single largest funding source for affordable housing and was instrumental in increasing affordable housing production in the past (Blount et al., Citation2014). Thirdly, the city has been responding to the serious need for affordable housing as reflected in local, state and federal housing regulations and policies (Ordinance No. 2486CCS adopted on 23/06/2015). Fourthly, the city aims to maintain an inclusive diverse community (City Council Special Meeting Minutes of 23/8/2015 - City of Santa Monica, Citation2015). Fifthly, the latest policy (LUCE 2010) was Santa Monica’s innovative way of responding to the Palmer ruling, which prevented a mandatory IH rental policy. A developer can choose to provide rental housing under Tier 2 in exchange for more height and FAR, while under Tier 3 rental inclusionary units can be part of a development agreement. This arrangement makes the requirement for rental housing provision legal, since it is voluntary and enables capture of land value for community benefits possible.
It is extremely important at this point to stress that the Santa Monica program is in addition to, and on top of, existing IH requirements. It is very similar to a density bonus program, but different in that it is based on a land use plan, on economic analyses that ascertain the land value increases due to the density bonus (for land value capture), and on extensive public participation. To evaluate AHPP under LUCE 2010, we sought to understand how the program works and how the city ensures compliance with AHPP requirements by developers. To begin with, as developers get project approvals, they have to sign an agreement with the city which imposes restrictions on their properties. To remove any possible bias and enhance equity, the city requires developers to accept prospective tenants only from the city’s consolidated list of appropriately qualified applicants. Developers are required to submit annual online reports on tenants and their household incomes. Household incomes are allowed to increase to 140% of income limit before tenants are required to move out to allow other deserving households to benefit.
It was found that developers have embraced LUCE 2010 positively as it has brought provisions to the AHPP which enhanced their project’s feasibility compared to the provisions existing before. For instance, the provision giving 25% to 50% discounts on in-lieu fees if offsite development occurs on land in non-residential zones was expensive to exploit before 2010 due to a lengthy costly approval process. This provision which aimed at reducing pressure on residential land and dispersing residential development to commercial and industrial zones was almost redundant and unutilized before 2010. However, LUCE 2010 brought a comprehensive mixed-use policy assuring quick approvals and developers have utilized the provision resulting in developments spreading into these unutilized zones.
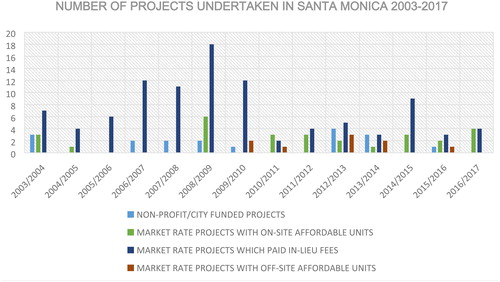
The majority of the projects particularly before LUCE 2010 chose to pay in-lieu fees. Between 2003/2004 and 2009/2010, 70 out of 82 projects (85%) by for-profit developers paid in-lieu fees. Under the LUCE 2010 program, payment of in-lieu fees is not allowed under tier 2 and this together with increased offsite affordable housing construction explains why out of 55 projects by for-profit developers, only 30 of them (55%) paid the fees. illustrates the marked decrease in projects paying the in-lieu fees in post-LUCE 2010 as compared to pre-LUCE 2010. also shows that the number of off-site constructions of affordable units increased after 2010.
Figure 1. Number of Projects in Santa Monica (2003- 2017). Source: Authors’ elaboration on City of Santa Monica data, December 2018.
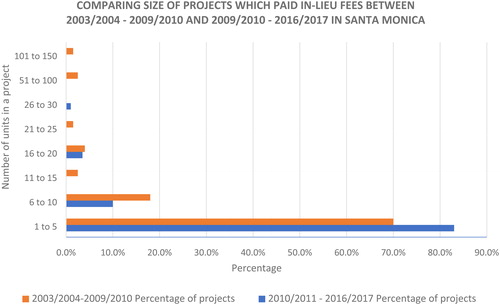
We questioned why, in post-LUCE 2010, still 55% of the projects were taking the option of paying in-lieu fees instead of incorporating more IH on-site, since this high percentage goes against the LUCE 2010 goal of ensuring mixed income neighborhoods. Evidence from the interviews and the quantitative data gathered from the City of Santa Monica planning office clarified that the projects which paid in-lieu fees in the post-LUCE 2010 period were mostly small projects. It is obviously challenging for a small project to identify a suitable percentage of affordable units on-site, and it is expected that small developments would tend to pay the in-lieu fee. Well distributed affordable housing is easier to achieve in large developments, where more flexibility in the allocation of the units is possible. As shown in , in the post-LUCE 2010 period, the majority of the projects that paid in-lieu fees were very small projects. 83% of the projects had a total of 1 to 5 units, 10% had 6 to 10 units, 3.5% had 16 to 20 units and only 1% had 26 to 30 units. In comparison, in the period 2003-2010 (pre-LUCE), larger projects paid in-lieu fees with 70% having 1-5 units, 18% with 6 to 10 units, 2.5% with 11 to 15 units, 4% with 16 to 20 units, 1.5% with 21 to 25 units, 2.5% with 51-100 units and 1.5% with 101 to 150 units. The fact that, in the post-LUCE 2010 period, there were no projects with more than 30 units that paid in-lieu fees, when previously projects with over 100 units took that option, is a manifestation of success in ensuring mixed income developments and ensuring social integration. This finding brings impetus to the intense debate going on within the affordable housing advocates’ community relating to whether IH developers should be allowed to pay in-lieu fees, or be required to build the affordable units within the project they are proposing. In debating this, we need to remind ourselves that IH is not only about producing affordable housing, but also about enabling social and economic integration. With an increase in projects choosing on-site affordable housing provision in Santa Monica after LUCE 2010 we argue that: (1) the low-income households are likely to benefit from living close to higher-income people because social and economic opportunities for low-income families are enhanced by living in the same building as their wealthier next door neighbors, and (2) more affordable units would be built since the in-lieu fee does not usually cover the full cost of building affordable units. Additionally, construction of IH housing units is especially important for Santa Monica because every market-rate project built without affordable units makes it more difficult to build affordable housing projects, because it decreases an already short supply of developable land. And in a region where many neighborhoods are gentrifying, inclusionary units would ensure a minimum of social integration.
Figure 2. Size of projects paying in-lieu fees in Santa Monica (2003 – 2017). Source: Authors’ elaboration on City of Santa Monica data, December 2018.
Interviews with city decision and policy makers indicated that there is a feeling that the in-lieu fees are too low and not commensurate with the loss of affordable units. Information from the housing department indicated that producing an affordable low-income unit costs approximately $500,000. However, looking at , the fees paid falls far below that cost and is also inconsistent with the number of units lost. In the table, we calculated the number of units which projects paying in-lieu fees could have built if they had provided on-site affordable units based on the AHPP requirement of 30% for low-income housing category. The last column showing the average fee per unit illustrates the inconsistency (fluctuations up and down over the years) in the amount of fees compared to the units lost.
Table 8. In-Lieu fees paid in Santa Monica (2010–2017).
It is important to note that, in most cases, in-lieu fees are leveraged to access external funding, such as Federal Low-Income Housing Tax Credits, allocated by the State. When this happens, it results in at least double the number of units constructed. But, as the data in above show, it will require in-lieu fees to be leveraged at least five times to achieve an affordable unit (going by 2016/2017 average fee paid per unit) which is not easy to achieve (interviews with city officials, 2018).
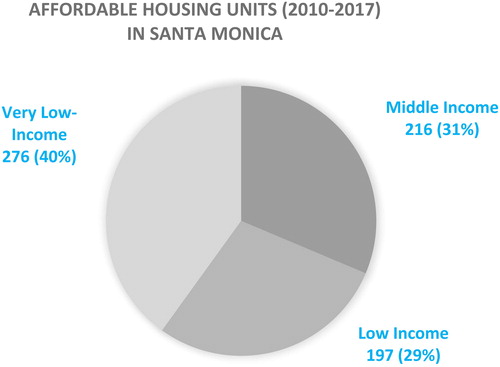
Quantitative results from the LUCE 2010 program show that between the 2010/2011 fiscal year and the 2016/2017 fiscal year, cumulatively 1663 housing units were produced in the city. Of these, 974 units were market-rate units and 689 were affordable units. Therefore, 41% of the housing units produced in the city during this period were affordable. It was found that private developers preferred incorporating very-low income units because the requirements allow them to provide less of these units thus allowing them to get more market-rate units. presents the affordability levels of the 689 affordable units and shows that there were more affordable units provided in the very low-income category.
Figure 3. Affordable housing in Santa Monica (2010- 2017). Source: Authors’ elaboration on City of Santa Monica data, December 2018.
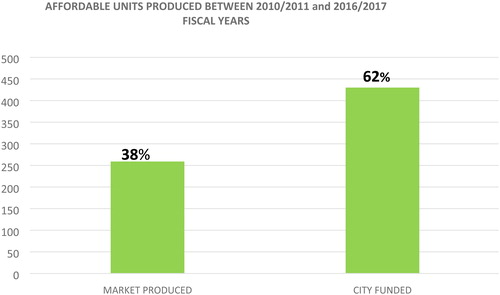
We analyzed the contribution of the market through the inclusionary policy and found that, out of the 689 affordable units, 259 were produced from the market whereas 430 were city-funded produced by non-profit developers (). This means that within the seven years the program has been in place, 38% of all newly produced affordable units in the city were financed by the market, built by market-rate developers through the inclusionary policy with no cost to the city save for administration expenses.
Figure 4. Affordable housing units produced in Santa Monica (2010-2017). Source: Authors’ elaboration on City of Santa Monica data, December 2018.
It is important to note that the above numbers do not include affordable units preserved using federal funds. It is also worth noting that the market contribution under the LUCE 2010 program is even greater than the 38% because the in-lieu fees paid by private developers partly constitute the city funds loaned to not-for profit developers. According to city officials, in-lieu fees constitute about 10% of the total city funds for affordable housing. As noted earlier, when these funds are leveraged, they bring at least double funds hence approximately 20% of the city funded affordable housing units are attributable to in-lieu fees. However, data on the exact number of affordable housing units resulting from in-lieu fees or the exact amount leveraged from the fees was not available since the City of Santa Monica did not closely monitor such data. Therefore, the officials we have interviewed could only give approximations and not actual figures. This is a weakness which we also found in other three cities with IH programs in California which we covered under our larger research project. There is, therefore, a need for stricter data monitoring and further research could be conducted after a reasonable timeframe to assess what in-lieu fees actually achieve in terms of affordable housing production; but our analysis offers a certain amount of evidence that, in the case of Santa Monica, prohibiting payment of in-lieu fees generated more affordable housing from market- rate developers after LUCE 2010. What is clear is that in-lieu fees as part of city funds are used to produce off-site affordable housing units and may not help to disperse affordable housing units and increase social integration across different income groups as on-site affordable housing units do. This is well demonstrated ahead in and the related discussion.
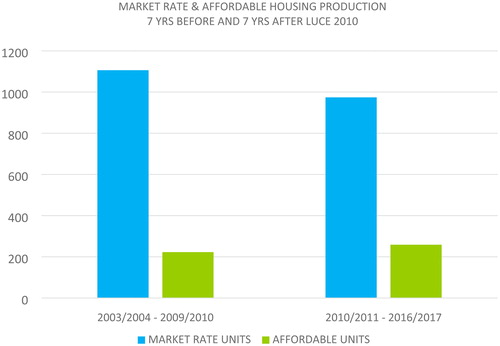
In order to understand the impact of LUCE 2010 on affordable housing production, we analyzed data on the affordable units financed from the market using the inclusionary policy in a temporal perspective. Firstly, we focused on the program itself and compared data for fourteen fiscal years, seven years before and seven years after the LUCE 2010 implementation. Between 2003/2004 and 2009/2010, market rate developers produced 223 affordable units and 1106 market-rate units. Between 2010/2011 and 2016/2017, the production by market developers of affordable units increased to 259 and that of market-rate units decreased to 974 (). This is a 15% increase in affordable units and a 12% decrease in market-rate units. Comparing the proportion of affordable units to total units produced by market-rate developers, we found that whereas 17% of all units produced by market-rate developers between 2003/2004 and 2009/2010 were affordable, this increased to 21% between 2010/2011 and 2016/2017.
Figure 5. Market rate & Affordable units’ production in Santa Monica 2003-2017. Source: Authors’ elaboration on City of Santa Monica data, December 2018.
From the literature and interviews with developers and affordable housing experts, we identified other factors that might impact upon affordable housing production and controlled them in order to isolate the impact of the LUCE 2010, relative to these other factors. The factors identified are: (i) housing demand; (ii) the cost of credit finance; (iii) housing prices/rents; (iv) land prices, and (v) the cost of construction (materials and labor). Measurements were undertaken for all the individual factors over a 14 years’ period (the seven pre-LUCE years and the seven post-LUCE years). summarizes how the factors were measured and lists the data sources.
Table 9. Key factors hypothesized to affect affordable housing production in Santa Monica between 2003 and 2017.
The hypothesis to be tested were formulated as follows: (1) Null hypothesis: There is no correlation between LUCE 2010 and affordable housing production; (2) Alternative hypothesis: There is a positive correlation between LUCE 2010 and affordable housing production.
Using SPSS Statistics, a partial correlation was run to determine the relationship between affordable housing production and the LUCE 2010 policy while controlling for the six other factors identified above. The descriptive statistics () show that we had no missing data since the recorded sample N = 14 is the same as the number of years data was entered. N shows the number of observations and for our case we have 14 observations, each observation representing annual affordable housing production for one year. We can also see that the mean for affordable housing for the 14 years is 34.4286 with a standard deviation of 27.11433. The correlation results are presented in .
Table 10. Results of the descriptive statistics for the key factors hypothesized to affect affordable housing production in Santa Monica between 2003 and 2017. Source: Author’s data analysis.
Table 11. Results of the partial correlation analysis of the key factors hypothesized to affect affordable housing production in Santa Monica between 2003 and 2017.
The above table shows two results – the one at the bottom highlighted by a blue rectangle shows correlation between LUCE 2010 and affordable housing production while controlling for all other variables identified. The results at the top (called zero-order correlations) highlighted by the green rectangle shows correlation between affordable housing production and LUCE 2010 without controlling for the other variables identified. The coefficient of correlation (r) shows the strength and direction of correlation and its value ranges from -1 to +1. Correlations above 0.4 are considered to be relatively strong; correlations between 0.2 and 0.4 are moderate, and those below 0.2 are considered weak. The p-value helps in determining the significance of the correlation results and is a number between 0 and 1. A small p-value (typically ≤ 0.05) indicates strong evidence against the null hypothesis and the null hypothesis is rejected and vice versa.
The above results show a positive moderate partial correlation between affordable housing production and LUCE 2010 while controlling for housing demand, the cost of credit finance, housing prices/rents, land prices and the cost of construction (highlighted by the blue rectangle). This correlation was statistically significant, (r(7) = 0.397, N = 14, p = 0.029). With a p-value of 0.029 (less than 0.05), it means the correlation is significant. The zero-order correlations between affordable housing production and LUCE 2010 without controlling for housing demand, the cost of credit finance, housing prices/rents, land prices and the cost of construction (highlighted by the green rectangle) showed that there was also a statistically significant, positive correlation between affordable housing production and the LUCE 2010 policy (r(12) = 0.298, n = 14, p = 0.007), indicating that the other five variables had very little influence in controlling the relationship between affordable housing production and the LUCE 2010 policy. This is because even when they are not controlled, they do not render the correlation between LUCE 2010 and affordable housing production insignificant. With these results, we reject the null hypothesis and accept the alternative hypothesis that there is a positive correlation between LUCE 2010 and affordable housing production.
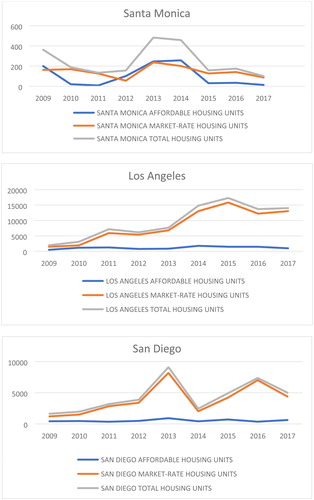
In order to evaluate the ability of LUCE 2010 to harness the market and increase the proportion of affordable housing in relation to the total housing produced in the city, we compared the housing outputs from the LUCE program with outputs in two other southern Californian cities (Los Angeles and San Diego). We selected these two cities because they are the biggest south Californian cities with growing real estate markets and they run IH programs. Unfortunately, we could only get Los Angeles and San Diego’s housing output data for the period 2009 to 2017 and, therefore, our comparative analysis covers this period. We wanted to ascertain if the increase in proportion of affordable housing in relation to the total housing produced was happening in the two big cities. In doing this, we compared the trends in total housing, market-rate housing and affordable housing production in Santa Monica and the two cities. The comparative results in show that the trend in affordable housing production in Santa Monica is different from the other two cities as it increases and decreases with both market-rate and total housing productions. In the other two cities, annual affordable housing production does not follow the pattern of both market-rate and total housing production and is actually almost flat over the years. These results demonstrate that Santa Monica city is harnessing the market for affordable housing production more efficiently than Los Angeles and San Diego cities.
Figure 6. Trends in total, market-rate and affordable housing productions in Santa Monica 2011-2017, benchmarked against San Diego, San Francisco and Los Angeles. Source: Authors’ elaboration on City of Santa Monica, San Diego, San Francisco and Los Angeles data, December 2018.
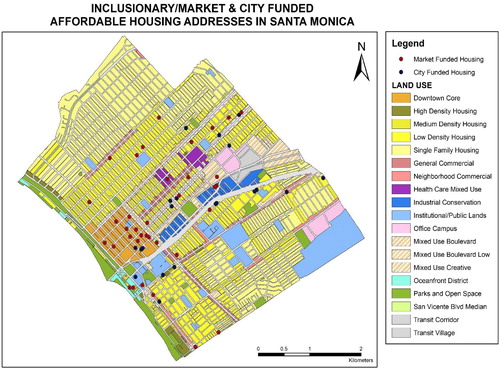
To find out if AHPP has helped to disperse affordable housing across the city, using geo-coded property data for the whole city, we mapped the locations of the for-profit market developments with affordable units and the city funded housing projects (). It can be seen that AHPP through the market developments has dispersed affordable housing across the city better than the city funded program. Of critical importance is the finding that AHPP has enabled low income households to access costly neighborhoods of opportunity including the downtown in a way they could not have if the city relied on its funded projects alone. shows the land use map of Santa Monica City overlaid with location of affordable housing units, produced through both the IH policy (red dots) and the city funds (blue dots). The figure shows a high number of IH units in the downtown area - 12 market-rate buildings were built within the city downtown area (orange color on the map). Only 3 city funded buildings were built in the downtown. Moreover, the 12 IH buildings are well dispersed in the whole downtown area, unlike the 3 city funded buildings which are clustered in a small area of the downtown. Similar situations emerge in the high cost low-density neighborhoods of the city. These areas have better services including quality schools, better walk scores and better access to parks.
Figure 7. Location of Affordable units in Santa Monica. Source: Mapping by authors based on Santa Monica data, December 2018.
We asked city officials if there could be any requirements by the city council placed on the non-profit developers who are funded by the city which could have influenced the location of their projects. It was confirmed that these developers were not subject to any legal or regulatory constraints that could have driven the choice of location of their projects. The location of these projects is mostly determined by land prices hence mostly being located in relatively cheaper and less affluent neighborhoods than market-rate projects.
We sought to find out the quality of services enjoyed by the affordable unit occupants in their neighborhoods. In the survey questionnaires that we administered to them, we asked them to score the quality of various services they enjoy within their neighborhoods on a scale of 1 – 5. The results are shown in .
Table 12. Scoring of access to services by respondents in Santa Monica, December 2018.
The above results show that affordable housing residents rated highly the services in the neighborhoods in which they resided. ‘‘Access to quality schools’’ was best rated with a mean score of 4.84 out of 5 followed by ‘‘access to better walkways’’ and ‘‘access to public parks’’ with mean score of 4.80 and 4.19 out of 5 respectively. This means that the residents are satisfied with the level of services in their neighborhoods.
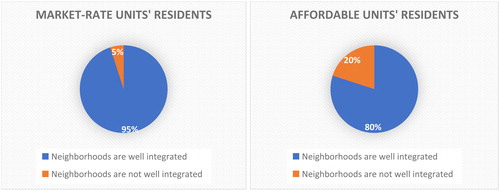
As mentioned earlier, the sample was stratified to reflect the different experiences of the two groups of residents, those occupying market-rate housing and those occupying affordable housing. To find out if social integration had been achieved in the IH developments and the neighborhoods, questionnaires with closed and open-ended questions were served on both stratums of the sample. Residents were asked whether they felt their neighborhoods were socially well integrated and the reason(s) for their answer. The survey results show that the majority of the residents feel that the neighborhoods with IH are socially well integrated. However, there was some disparity in approval of integration among the two groups with higher approval coming from the market-rate residents. As shown in , 95% of market-rate units’ residents and 80% of affordable units’ residents felt that their neighborhoods are well integrated, with 20% of affordable units’ residents indicating that the neighborhoods are not well integrated compared to 5% of market-rate residents who indicated the same. These results suggest that the expectations of affordable units’ residents in terms of what constitutes a well-integrated neighborhood is higher than those of the market-rate residents.
Figure 8. Respondents response to level of integration in their neighborhoods in Santa Monica.
Source: Survey by authors (December 2018)
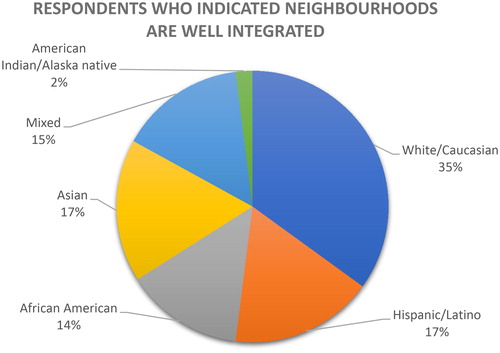
Residents who thought their neighborhoods were well integrated mainly gave two reasons. These are: the presence of different economic groups and the presence of different racial groups within the neighborhoods. Those who thought the neighborhoods are not well integrated observed that there are too few affordable units compared to the number of needy people.
shows the distribution by race of residents who indicated that neighborhoods are well integrated.
Figure 9. Distribution by race of respondents who indicated that neighborhoods are well integrated in Santa Monica. Source: Survey by authors (December 2018).
Asked if they were aware if there are affordable units in their neighborhood, 90% of market-rate occupants replied in the affirmative. But asked if they were aware if there are affordable units within their buildings, only 40% of market-rate occupants replied in the affirmative. 60% of market-rate occupants were not aware of the presence of affordable units within their buildings. We asked those who were aware that there are affordable units within their buildings if they knew the units which are affordable. Only 10% (of the 40% of market-rate occupants) said they knew at least one affordable unit within the building and also knew their occupants and somehow interacted with them. They, therefore, knew of such affordable units from the interaction with their occupants and not from the physical appearance of the units.
From the responses on the open-ended questions, three main drivers for interaction among residents were identified. It was observed that residents, who had interacted, had met either (i) in the common rooms/spaces, (ii) through their children, or (iii) when walking their dogs. The results show that those residents residing in buildings with common rooms and those having children and dogs were more likely to interact with others of different socio-economic groups. As shown in , 50% of both the market-rate and affordable rate residents who interacted with neighbors indicated they did so when using the common rooms within their buildings. 50% of the market-rate and 30% of the affordable rate residents who interacted with neighbors indicated they met their neighbors through their children. Their children often visited or played with their neighbors’ children in the same building and the parents ended up meeting in the process. 20% of affordable units’ residents who had interacted with market-rate units’ residents indicated that they had met their neighbors while walking their dogs into or out of their buildings at the same time.
Table 13. Level of interaction in relation to the main drivers identified through the open-ended questions and by typology of residents in Santa Monica (Source: authors’ survey, December 2018).
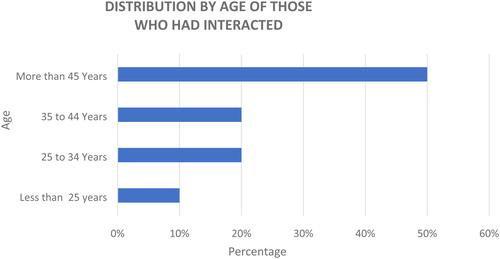
The level of interaction was also found to differ with the demographic characteristics of the respondents and the length of stay in their current residences (). The survey found that residents who have stayed for a long time and who are older are more likely to interact with others. For those who had interacted with others, 70% of them had stayed in their present residences for more than two years. In terms of age, 10% were below 25 years, 20% were between 25 and 34 years, 20% were between 35 and 44 years and 50% were above 45 years.
Figure 10. Distribution by age of those who had interacted in Santa Monica.
Source: Survey by authors (December 2018)
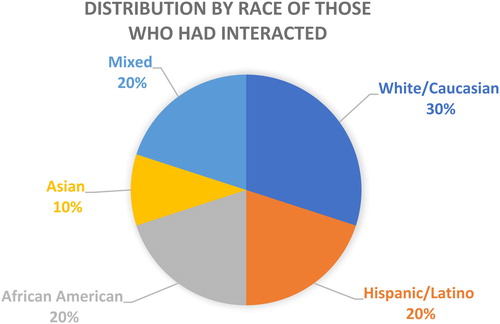
In terms of race, those who interacted were 30% white/Caucasian, 20% Hispanic/Latino, 20% African American, 10% Asian and 20% mixed race. This is shown in :
Figure 11. Distribution by race of those who had interacted in Santa Monica Source: Survey by authors (December 2018).
Residents living in affordable units were asked further closed questions including where they had resided before, whether they thought that moving into the neighborhood had improved their socio- economic status, and whether they had noticed any negative bias associated with their status of residence in an affordable/below market unit. Affordable units’ occupants surveyed indicated they had resided either in low income (50%) or mixed income (50%) neighborhoods before getting their present affordable units. They all indicated that they were happy with their present neighborhoods. 80% of them considered that moving into their present neighborhoods and occupying their present housing units had improved their socio-economic status because of the benefits they enjoy including easy access to work, schools, transport and public facilities. The majority of them (90%) indicated that they had never experienced any bias within their residences. The 10% of the affordable units’ respondents who had experienced some form of bias said mostly that it did not emanate from within their residences but from their needy colleagues who were upset that they did not have access to the affordable units themselves.
Generally, the findings revealed that there is great support for an inclusionary policy among residents. Asked if the presence of low-income people within their buildings undermined the satisfaction they got from their units, all the market-rate occupants said that it did not. Most respondents indicated that IH is a good and a necessary tool with impressive results. Others indicated that more needs to be done to achieve better results. However, some cautioned that IH should not be applied everywhere in the city and zoning should be respected but mixed-use zoning should be promoted. There was a feeling among some of them that the city leaders are too ‘soft’ on developers and need to push them harder.
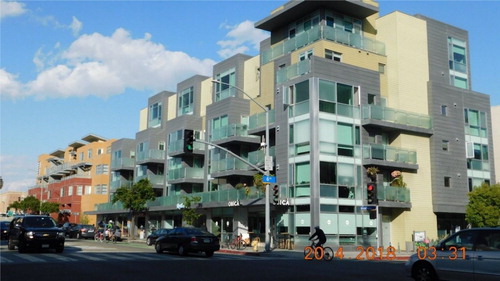
The findings from the survey have been further corroborated by fieldwork and direct observation, which confirmed that buildings following the IH regulations incorporate very-low income units which are not at all recognizable in visual terms. The only way to identify them is through the technical floor plans (), but in terms of the actual built environment, they all look alike ().
Figure 12. Floor plans for typical studio and two bedroomed apartments for a multi-family development (actual building shown in , Santa Monica City, Source: Developer’s website: http://swaysantamonica.com/residences/floorplans, retrieved December 2018.
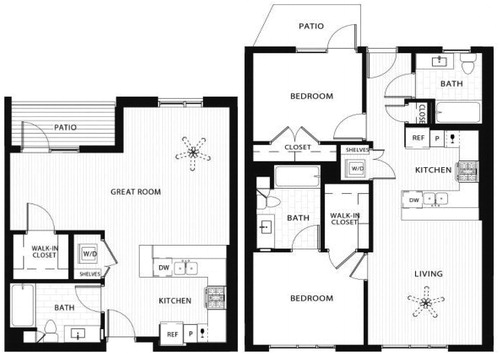
Figure 13. Inclusionary Housing along 6th and Broadway Avenues, Santa Monica. Source: Authors’ photo, April 2018.
Although the program has achieved great success, interviews with planning staff revealed that there are challenges in dealing with Tier 3 development agreements. The communities put the staff under enormous stress during negotiations with endless demands and the city ended up having 40 pending negotiation agreements after the implementation of LUCE 2010. However, most of these projects have now been either approved, withdrawn or given development review permits. Furthermore, interviews with the planning officers suggest that negotiation should be used on complex cases but should not be extended to all planning applications, to avoid overburdening the program implementation.
7. Conclusion
This research focusses on changes brought about by the Land Use and Circulation Element (LUCE) 2010 on the City of Santa Monica’s affordable housing production program and has found that the tiered bonus-based changes served to enhance the program goals of increasing the stock of affordable housing and enabling social integration. LUCE 2010 provided a very comprehensive and a well-structured approach to using the market to provide equitable affordable housing using the principle that allowing incremental increases in the development intensity enhances the value of the property and hence developers have to include affordable housing in their projects. It brought a balance of interests by requiring economic feasibility analyses of the projects so that, as the community obtains its benefits, the developers are also assured of their project’s feasibility. The program was found to have enabled developers to achieve feasibility and provide housing at deeper levels of affordability than there was before.
LUCE 2010 offers a comprehensive policy on mixed use development and demonstrates that land use policies and planning can help encourage greater supply and affordability, as well as influencing the type and location of housing enabling households to access neighborhoods of opportunity. Even as LUCE 2010 brought success to the AHPP, useful lessons have been learned which could be beneficial for implementing IH programs in a similar context.
Although using negotiations and development agreements ensures optimal affordable housing opportunities and gives certainty to developers, they should be limited to large projects. An over-reliance on them might result in an administrative burden on the locality and on additional time taken and resources required for the developer.
Engaging developers helps minimize opposition and increases the success of an IH program. Economic ‘land value enhancement’ analyses undertaken under LUCE 2010 provide the basis for negotiation between landowners/developers and the city.
There is a need to put a cap on the low-income and very-low income units’ percentages. Developers usually choose what is most feasible to them and this may lead to a shortage of one housing category.
There is a need to rethink about giving developers a choice to pay fees in-lieu of developing affordable units because this seems to work against the goals of the program. If in-lieu fees have to be an option, there is a need to revise the fees based on the cost of providing an affordable unit. When considering eliminating in-lieu fees, then, from Santa Monica’s experience, it might be appropriate to consider the size of the project, with developments above a certain size required to build the units on site.
The Santa Monica case confirms that IH can be a powerful tool to achieve effective social integration. This finding was based on the data gathered through the survey and corroborated through direct observation.
The evaluation of the LUCE program offers valuable insights to planners and policy makers internationally. Some limitations of this study should be taken into consideration. The LUCE program has only been in place since 2010. Given its overwhelming approval by the stakeholders, it will be interesting to see its impact over a long period transcending leadership and property market cycles.
There could be limitations to the transferability given that Santa Monica is a contained city in terms of its geographical size and given its favorable conditions in terms of progressive political and local governance. However, Santa Monica’s experience is relevant and applicable to other cities because it shows how planning for accommodating new growth can be harnessed to increase the production of affordable housing and foster integrated communities through IH.
We suggest that cities with less experience or capacity could benefit from shadowing what has been done in such frontrunner cities by means of dedicated programs such as staff exchanges and best practice training. Also, Santa Monica is a wealthy, desirable community enjoying world-famous beaches meaning that there is a sustained housing demand. Cities intending to use a similar model may need to evaluate the soundness of their property market to guarantee the desired demand for the effective implementation of such a program.
Based on the above findings and conclusions and bearing in mind the identified limitations, this research offers valuable lessons on using IH for equitable affordable housing provision applicable to the wider international context and sits within the body of knowledge aimed at understanding how LVC and IH can benefit the wider community.
Further studies could expand on the social inclusion and IH nexus. A possible investigation is the spatial location of affordable IH units against affordable units produced through alternative instruments and analyzing the correlation to socio-economic indicators and the level of accessibility to public services and facilities.
Acknowledgements
This paper builds on the fieldwork conducted by the authors within the H2020 MAPS LED project, Call H2020-EU.1.3.3. - Stimulating innovation by means of cross-fertilization of knowledge, Project ID: 645651. We wish to thank the San Diego State University for the support received during the fieldwork and in particular Professor Nico Calavita for the valuable insights, inspiration and reviews provided. We express our gratitude to the Housing Studies editor Professor Alex Schwartz and the three anonymous reviewers who greatly helped us to improve the quality of the paper and add clarity to the policy recommendations and conclusions. Many thanks to Professor Ali Parsa and Hanneke Van-Dijk for helping in the review process. Finally, this work wouldn't have been possible without the kind and generous availability of many experts who shared ideas and thoughts essential to the development of this paper. We appreciate officials of the city of Santa Monica particularly David Martin-Director of City Planning & Community Development, Jim Kemper- Housing Program Manager and Richard Hilton-Housing Commissioner; academics, community leaders and city residents interviewed for their help. Any possible inaccurancy or omission remain our exclusive responsibility.
Additional information
Notes on contributors
Bernard Nzau
Bernard Nzau is a Land Economist based in Kenya, a PhD candidate at the University of Salford, UK and a former Marie-Curie researcher under the H2020 MAPS LED project at the San Diego State University, USA. His research focuses on affordable housing, with a specific interest in USA’s innovative Inclusionary Housing and Land Value Capture tools.
Claudia Trillo
Claudia Trillo is a Reader at the University of Salford, UK. She has extensive experience in innovative planning practices gained through both academic research and professional practice. As a Fulbrighter and Marie Curie Researcher and UK Principal Investigator under the European Commission’s 7th Framework and Horizon 2020 European Programs, she has gained wide experience on the USA’s innovative planning practices including Smart Growth, Transfer of Development Rights, Innovation Districts and Inclusionary Housing.
References
- Basolo, V. & Calavita, N. (2004) Policy Claims with Weak Evidence: A Critique of the Reason Foundation Study on Inclusionary Housing Policy in the San Francisco Bay Area; http://nonprofithousing.org/wp-content/uploads/Reason_Report_Critique2004.pdf (accessed 21 January 2019)
- Blount, S., Ip, W., Nakano, I. & Ng, E. (2014) Redevelopment Agencies in California: History, Benefits, Excesses, and Closure. Working Paper No. EMAD-2014-01U.S. Department Of Housing And Urban Development. Office of Policy Development and Research, https://www.Huduser.Gov/Portal/Publications/Redevelopment_Whitepaper.Pdf. (accessed 21 January 2019)
- Brat, R.G. (2012) Overcoming Restrictive Zoning for Affordable Housing in Five States: Observations for Massachusetts. Tufts University Medford, Massachusetts. https://www.chapa.org/sites/default/files/BrattOvercomingRestrictiveZoning112012.pdf (Accessed 5 September 2018)
- Calavita, N. & Grimes, K. (1998) Inclusionary Housing in California: The Experience of Two Decades, Journal of the American Planning Association , 64, pp. 150–169.
- Calavita, N. & Wolfe, M. (2014) White Paper on the Theory, Economics and Practice of Public Benefits Zoning. http://ebho.org/wp-content/uploads/2011/09/LVR-White-Paper-Full_141113.pdf. (accessed 21 January 2019).
- Calavita, N. (2015) Value Capture and Community Benefits, Zoning Practise, 32.
- Calavita, N. (2004) Origins and Evolution of Inclusionary Housing in California, “Inclusionary Zoning: The California Experience”; National Housing Conference (NHC) Affordable Housing Policy Review. Volume 3, Issue 1
- Calavita, N. & Mallach, A. (2009) Inclusionary Housing, Incentives, and Land Value Recapture; Land Lines. Washington, DC: Lincoln Institute of Land Policy.
- Calavita, N. & Mallach, A. (2010) Inclusionary Housing in International Perspective: Affordable Housing, Social Inclusion, and Land Value Recapture. Lincoln Institute of Land Policy.
- Cotter, S.L. (2014) Inclusionary zoning policies in California: A cost-benefit analysis from the perspective of local government officials; unpublished Master’s thesis; California State University, Sacramento.
- City of Santa Monica (2010) Land Use and Circulation Element. https://www.smgov.net/uploadedFiles/Departments/PCD/Plans/General-Plan/Revised%20LUCE%207.24.15_web.pdf (accessed 21 January 2019).
- City of Santa Monica (2013) Housing Element. https://www.smgov.net/Departments/PCD/Plans/2013-2021-Housing-Element/ (accessed 4 February 2019).
- City of Santa Monica (2015) Santa Monica City Council Special Meeting Minutes, (accessed 23 September 2015)
- City of Santa Monica (n.d.). Santa Monica Municipal code; http://www.qcode.us/codes/santamonica/view.php?topic=0&frames=on (accessed 20 May 2018).
- Davison, G., Legacy, C., Liu, E., Han, H., Phibbs, P., Nouwelant, R., Darcy, M. & Piracha, A. (2013) Understanding and addressing community opposition to affordable housing development, AHURI Final Report No.211. Melbourne: Australian Housing and Urban Research Institute.
- Federal Housing Finance Agency (2019) Working Paper 19-01: The Price of Residential Land for Counties, ZIP codes, and Census Tracts in the United States https://www.fhfa.gov/PolicyProgramsResearch/Research/Pages/wp1901.aspx (accessed 29 June 2019)
- Freddie Mac’s Primary Mortgage Market Survey (n.d.). http://www.freddiemac.com/pmms/. (accessed 21 January 2019)
- Hickey, R. (2014) Inclusionary Upzoning: Tying Growth to Affordability; Center for Housing Policy, a division of the National Housing Conference, Washington DC
- Hickey, R., Sturtevant, L. & Thaden, E. (2014). Achieving Lasting Affordability through Inclusionary Housing, Lincoln Institute of Land Policy Working Paper.
- Hollingshead, A. (2015) Do Inclusionary Housing Policies Promote Housing Affordability? Evidence from the Palmer Decision in California; Lincoln Institute of Land Policy; Working Paper WP15AH1 https://www.lincolninst.edu/publications/working-papers/do-inclusionary-housing-policies-promote-housing-affordability (accessed 21 January 2019).
- Jacobus, R. (2015) Inclusionary Housing: Creating and Maintaining Equitable Communities. Lincoln Institute of Land Policy. https://www.lincolninst.edu/sites/default/files/pubfiles/inclusionary-housing-full_0.pdf (accessed 2 December 2018).
- Kautz, B.E. (2002) In Defense of Inclusionary Zoning: Successfully Creating Affordable Housing, University of San Francisco Law Review, 36: 971–1032.
- Knaap, G.J., Bento, A. & Lowe, S. (2008) Housing Market Impacts of Inclusionary Zoning. College Park, MD: National Center for Smart Growth Research and Education
- Lynch, K. (1981) A Theory of Good City Form. Cambridge, MA, USA: MIT Press.
- Mallach, A. (1984) Inclusionary Housing Programs: Policies and Practices (New Brunswick, NJ: Center for Urban Policy research, Rutgers University).
- Mallach, A. (2009) A Decent Home: Planning, Building, and Preserving Affordable Housing (Chicago: Chicago Planners Press, University of Chicago Press).
- Massey, D., Albright, L., Casciano, R., Derickson, E. & Kinsey, D. (2013) Climbing Mount Laurel: The Struggle for Affordable Housing and Social Mobility in an American Suburb (Princeton, NJ: Princeton University Press).
- Metcalf, G. (2018) Sand Castles before the Tide? Affordable Housing in Expensive Cities, in, Journal of Economic Perspectives, 32, pp. 59–80. Vol.
- Mill, J.S. (1848, 1909) Principles of Political Economy with Some of Their Applications to Social Philosophy. Edition of 2004 published by Indianapolis, IN: Hackett Publishing Company.
- Monk, S. (2010) England: Affordable Housing through the Planning System: The Role of Section 106, in: N. Calavita and A. Mallach (Eds.), Inclusionary Housing in International Perspective: Affordable housing, social inclusion and Land Value Recapture (Washington, DC: The Lincoln Institute of Land Policy).
- Mukhija, V., Lara, R., Sara, S. & Ashok, D. (2010) Can Inclusionary Zoning Be an Effective and Efficient Housing Policy? Evidence from Los Angeles and Orange Counties”, Journal of Urban Affairs, 32, pp. 229–252.
- Murray, Z. (2017) Shelterforce, in: “California, a Victorious “Fix” for Inclusionary Housing”, November 29; https://shelterforce.org/2017/11/29/california-victory-inclusionary-housing/ (accessed 21 January 2019).
- Non-Profit Housing Association of Northern California (2007) Affordable by choice: Trends in California Inclusionary Housing Programs; http://www.inclusionaryhousing.ca/wp-content/uploads/sites/2/2010/02/NHANC-Survey-2006.pdf (accessed 29 June 2019).
- Nzau, B. & Trillo, C. (2019) Harnessing the Real Estate Market for Equitable Affordable Housing Provision through Land Value Capture: Insights from San Francisco City, California, in: Sustainability, 11(13), 3649, MDPI,Basel, Switzerland
- Ponce Solé, J. (2006) Land use law, housing, and social and territorial cohesion. Denver: Rocky Mountain Land Institute.
- Ponce Solé, J. (2010) Foreword to inclusionary housing. in: N. Calavita & A. Mallach (Eds.) International Perspective: Affordable housing, social inclusion and Land Value Recapture: ix-xiii; (Cambridge, Massachusetts: Lincoln Institute of Land Policy).
- Powell, B. & Stringham, E. (2004a) Housing Supply and Affordability: Do Affordable Housing Mandates Work? Los Angeles: Reason Public Policy Institute, Policy Study No. 318 (Los Angeles, CA: Reason Public Policy Institute).
- Powell, B. & Stringham, E. (2004b) Do Affordable Housing Mandates Work? Evidence from Los Angeles County and Orange County, Los Angeles: Reason Public Policy Institute, Policy Study No. 320 (Los Angeles, CA: Reason Public Policy Institute).
- Powell, B. & Stringham, E. (2005) The Economics of Inclusionary Zoning Reclaimed: How Effective Are Price Controls?, Florida State University Law Review, 33(2), pp. 471–499.
- Rusk, D., Shirey, S. & Abel, B. (2010) Inclusionary Housing Survey: Measures of Effectiveness (Baltimore, MD: Innovative housing Institute).
- Schuetz, J., Meltzer, R. & Been, V. (2009) 31 Flavors of Inclusionary Zoning: Comparing Policies from San Francisco, Washington, DC, and Suburban Boston, Journal of the American Planning Association, 75, pp. 441–456.
- Schuetz, J., Meltzer, R. & Been, V. (2011) Silver Bullet or Trojan Horse? the Effects of Inclusionary Zoning on Local Housing Markets in the United States, Urban Studies, 48, pp. 297–329.
- Schwartz, H.L., Ecola, L., Leuschner, K.J. & Kofner, A. (2012) Is inclusionary zoning inclusionary? Available at https://www.rand.org/content/dam/rand/pubs/technical_reports/2012/RAND_TR1231.pdf (accessed 05 September 2018).
- Sturtevant, L.A. (2016) Separating Fact from Fiction to Design Effective Inclusionary Housing Programs. in: Inclusionary Housing, Research and Policy Brief, Center for Housing Policy, http://media.wix.com/ugd/19cfbe_9a68f933ed6c45bfb5f8b7d2ef49dda0.pdf (accessed 21 January 2019)
- Thaden, E. & Wang, R. (2017) Inclusionary Housing in the United States: Prevalence, Impact, and Practices. Working Paper WP17ET1, Lincoln Institute of Land Policy.
- The Urban Institute (2012) Expanding Housing Opportunities Through Inclusionary Zoning: Lessons from Two Counties: Report prepared for Department of Housing and Urban Development Office of Policy Development and Research; Washington. https://www.huduser.gov/portal/publications/HUD-496_new.pdf (accessed 21 January 2019).
- The Urban Land Institute (2004) ULI development case studies; Colorado Court Santa Monica; https://casestudies.uli.org/wp-content/uploads/sites/98/2015/12/C034023.pdf (accessed 5 August 2018).
- Trillo, C. (2019a) Housing policies and sustainable development. in: Filho, W.L., Azul, A.M., Brandli, L., Ozuyar, P.G. & Wall, T. (eds) Sustainable Cities and Communities, Encyclopedia of UN Sustainable Development Goals, Living Edition: 1-9; Cham, Switzerland: Springer.
- Trillo, C. (2019b) Mixed income housing.in: Filho, W.L., Azul, A.M., Brandli, L., Ozuyar, P.G., & Wall, T. (eds) Sustainable Cities and Communities, Encyclopedia of UN Sustainable Development Goals, Living Edition: 1-8; Cham Switzerland: Springer.
- U.S. Census Bureau’s American Community Survey; https://www.census.gov/programs-surveys/acs/ (accessed 21 January 2019).
- UN Habitat (2016) World Cities Report, Urbanization and Development: Emerging Futures; Nairobi, Kenya
- United Nations (2016) About the Sustainable Development Goals, https://www.un.org/sustainabledevelopment/sustainable-development-goals/ (accessed 8 March 2019).
- US Census Bureau; https://www.census.gov (accessed 5 August 2018).
- Wiener, R.J. & Barton, S.E. (2014) The Underpinnings of Inclusionary Housing in California: current Practice and Emerging Market and Legal Challenges, Journal of Housing and the Built Environment, 29, pp. 403–422. Vol. pg
- Williams, S., Carlton, I., Juntunen, L., Picha, E. & Wilkerson, M. (2016) The Economics of Inclusionary Development (Washington, DC: Urban Land Institute).
- World Bank (2017) Housing: Unavailable and Unaffordable; Kenya Economic Update; Edition No. 15; Washington DC.
- Ziebarth, A. (2013) Book Review: Inclusionary Housing in International Perspective: Affordable Housing, Social Inclusion, and Land Value Recapture, in: Journal of Planning Education and Research, 33, pp. 367–369.
Interviews
- Interviews with the director of the city planning & community development, city of santa monica (29.04.2018 and 15.08.2018)
- Interview with a Housing Commissioner, City of Santa Monica (16.08.2018)
- Interview with a community leader, City of Santa Monica (15.12.2018)
- Interview with a public counsel/community advocate, City of Santa Monica (27.08.2018)
- Interview with a Housing Program Manager, City of Santa Monica; Housing Division (14.08.2018)
- Interview with the Director of the Alliance for community transit organization (13.09.2018)
- Interview with a Developer, Santa Monica (15.08.2018)
- Interview with the Founder and CEO of a real estate development Company in Santa Monica (29.08.2018)
- Interview with a planning professor at the University of Southern California (20.08.2018)
- Interviews with a planning professor at the San Diego State University (28.04.2018; 08.09.2018)