
 ?Mathematical formulae have been encoded as MathML and are displayed in this HTML version using MathJax in order to improve their display. Uncheck the box to turn MathJax off. This feature requires Javascript. Click on a formula to zoom.
Abstract
Social mix through tenure mix is a policy tool to combat segregation in Sweden and elsewhere. We study if new construction of housing in Swedish cities, 1995–2017, has affected tenure mix in neighborhoods, and if this in turn affected social mix. Findings show that housing construction contributes to tenure mix, but effects on social mix are less clear. We show a negative association between new housing production and increased social mix; however, those living in new housing in higher income neighborhoods tend to have lower incomes than those living in older housing and vice versa in lower income neighborhoods. This shows that new housing production is a tool for creating social mix, but other processes may dwarf the effects. We conclude that while housing tenure mix is a blunt tool for creating social mix, there are positive effects of such efforts.
Introduction
Social mix is a policy goal in many national contexts (e.g. for the UK, Kintrea, Citation2013; for Sweden, Bergsten & Holmqvist, Citation2013; for Denmark, Alves, Citation2019). The aim is to mix inhabitants with different social positions in residential neighborhoods in order to combat negative neighborhood effects from concentrated disadvantage (Bergsten & Holmqvist, Citation2013). The policy tools to implement social mix are rather uniform across national contexts – housing tenure mix at the local neighborhood level. Even if there are questions about the effectiveness of the implemented policy and whether there are positive effects (Arthurson, Citation2012), the policies are very important factors in shaping urban planning.
Social mix is argued to promote neighborhood stability, similar opportunities for work, education and amenities, local networks, and role models that improve life chances for members of disadvantaged groups (Arthurson, Citation2012; Goodchild & Cole, Citation2001; Holmqvist & Bergsten, Citation2009; Sarkissian, Citation1976). Lees (Citation2008) criticizes the often one-sided mix strategy that focuses on the inflow of relatively affluent households to neighborhoods with concentrated poverty. To activate dynamics of mixing, it must be possible to move away from poorer neighborhoods, even without a substantial increase in income. The Swedish strategy for mixing population groups differs from many other national strategies (Bergsten & Holmqvist, Citation2013). General policy measures, rather than targeted interventions, have traditionally been implemented at household, neighborhood and urban levels. The policies do not only target disadvantaged neighborhoods, but also aim to increase social mix in all neighborhoods.
In this paper, outcomes of social mixing ambitions are studied. We make use of a rich individual-level register database to study how new housing production, occurring between 1995 and 2017 in all urban municipalities in Sweden, has affected housing tenure mix and, in turn, social mix at the neighborhood level. This research responds to Kleinhans’s (Citation2004) argument that many of the social mix studies conducted to date have too narrow a scope, and are unable to study changes caused by the addition of new housing units in a neighborhood. Our data source and the rather long time scale of the study allow us to investigate short to medium-term effects of urban planning polices across the whole of Sweden.
The paper is structured as follows: a literature review is presented, centered on the relation between social mix policies and outcomes and housing production. Thereafter follows a description of the Swedish case. The methods section describes the data source and our methodological choices. The empirical section presents our findings, and a concluding section answers the overarching research question: To what extent has new housing built in Sweden contributed to the tenure type and social mix in urban neighborhoods?
Social mix and housing availability
In many policy contexts, the ambition of social mix builds on the theory that the neighborhood in which one lives affects a person’s social position later in life, beyond the effect of family background (e.g. van Ham et al., Citation2012). Positive long-term outcomes (such as higher earnings and college attendance rates) have been observed for young children whose families move from higher to lower-poverty neighborhoods (Chetty et al., Citation2016).Footnote1 Social mix should combat negative neighborhood effects through the dispersal of concentrated poverty, thereby improving the future life opportunities of individuals (e.g. Galster & Friedrichs, Citation2015; Graham et al., Citation2009). It is difficult, however, to pinpoint the causal effects of social mix on individuals’ outcomes (Graham et al., Citation2009; Livingston et al., Citation2013; Musterd & Andersson, Citation2005).
Mix policies are primarily implemented in deprived neighborhoods where the negative effects of segregation are more visible (e.g. Andersson, Citation2006; Goodchild & Cole, Citation2001). Critics highlight the gentrification process that may be started by large-scale regeneration (Hedin et al., Citation2012; Hochstenbach, Citation2017). Inflow of middle-class households may push poorer residents out, creating displacement rather than social mix (Atkinson, Citation2004; Lees, Citation2008; for a Swedish example on restructuring of a low-income neighborhood; Bråmå, Citation2012). Even if social mix occurs in neighborhoods, there may be low rates of interaction between population groups; thus, social mix should be understood much more broadly than just as the mix of population groups in housing units close to each other (Livingston et al., Citation2013). Nevertheless, social mix is often discussed in planning as an expected outcome of mixed housing tenure and type.
Mixing is less common in wealthier areas, since owner-occupants often resist new development of housing (especially rental housing) due to expected negative effects on property values (Bergsten & Holmqvist, Citation2013). From a policy perspective, mixing in wealthier areas is also less of a concern since negative effect of segregation are rarely seen in these areas. Thus, one-sided mixing policies could generate higher housing costs in less advantaged neighborhoods, while higher-income neighborhoods are unaffected.
Housing tenure mix can be achieved in a variety of ways: through housing tenure conversions in areas where the tenure composition is one-sided, through demolition of housing units, or through new production of housing. Housing tenure conversions have primarily consisted of privatization of public rental-housing units (in Sweden, e.g. Andersson & Turner, Citation2014; Hedin et al., Citation2012; the right-to-buy policy in the UK, e.g. Murie, Citation2015) and have rarely led to tenure diversification. Simultaneously, housing policies often push for owner occupation by lowering mortgage interest rates and reducing subsidies for rental housing production and housing benefits (e.g. Boterman & Van Gent, Citation2014; Christophers, Citation2013; Rolnik, Citation2013; Smith, Citation2015). In Sweden, this has led to a situation where housing production is mainly driven by the ability of households to take out mortgages, which skews housing production towards owner-occupied housing. Wimark et al. (Citation2020) show that most new production contributes to homogenization of the housing stock, especially in large-scale owner-occupied single family housing areas on the outskirts of larger cities in Sweden.
Some findings regarding effects of social mix policies indicate positive results (e.g. Allen et al., Citation2005; Martin & Watkinson, Citation2003, referenced in Livingston et al., Citation2013), while others show negative results. The negative results include lower social cohesion and the finding that people with the same socioeconomic background may benefit from living among people with similar social status, because of their need for similar public services (Cheshire, Citation2007). Reviews of research on effects of tenure mix on social mix are largely inconclusive (Bond et al., Citation2011), but some positive effects of tenure mix on social mix have been highlighted (Sautkina et al., Citation2012).
When launching plans for social mix, little attention seems to be given to the process of how the concentration of poverty, or wealth, started in the first place. If households with similar income levels live in certain areas because they want to live with people with similar backgrounds and aspirations, then the type of housing (housing tenure) in those neighborhoods might be less important. This is in line with what Schelling (Citation1971) proposes, namely that preferences for certain neighbors or amenities make households with similar such preferences cluster together. If social stratification in the housing market instead depends on households’ varying ability to pay, then a mix of housing types with different prices can be an important policy to promote social mix, which is more in line with the Tiebout hypothesis that differences in public goods will translate into housing costs, effectively sorting the population by purchasing power. The availability of housing units across neighborhoods with different costs and varying barriers to entry then becomes important for social mix ambitions.
Experiences from the USA suggest that owned housing in rental-dominated neighborhoods primarily attracts tenants from the vicinity (Lee, Citation2014), potentially disrupting the process of creating socially mixed neighborhoods with housing tenure mix. However, these differing housing careers in the same neighborhood may be of importance, since the likelihood of out-mobility from poorer neighborhoods increases when households have entered the owned-housing market, as opposed to staying in renting (Fjellborg, Citation2021a; Vogiazides, Citation2018). This is of course in line with research showing that upward social mobility leads to households moving to areas that match their own demographic and economic situation (Hedman et al., Citation2011; van Gent et al., Citation2019), and the sorting of movers according to income has grown stronger over the past 30 years in Sweden (Fjellborg, Citation2021b).
Availability of housing may be a key factor for social mix. In the USA, research findings indicate that housing production may reduce ethnic segregation, since available housing reduces the difference in residential mobility behavior between white and black movers (South & Crowder, Citation1997). South and Crowder call this the housing availability model, which focuses on how availability in the housing stock plays a key role for residential mobility and in turn for the process of desegregation. South & Crowder (Citation1998) show that new housing in ethnic minority dominated areas does not increase ethnic mix, and White et al. (Citation2003) show that this is affected by the initial levels of mix in the metropolitan area. The US context is different from the Swedish, but findings by Asquith et al. (Citation2019) show that new housing construction attracts higher income earners, but that this also has positive effects for lower income earners, as they are not priced out of the neighborhood if additional housing is constructed. Of course, the context in which housing is produced is of importance, and Dwyer (Citation2007) shows that new housing increases isolation of the affluent, perhaps as the process observed in Sweden suggests (Wimark et al., Citation2020). Regardless, it can be argued that the construction of new housing, in line with the housing availability model, could also increase social mix. This would be the case if new production of housing is catered to lower-income households in higher-income neighborhoods and attracts higher-income earners to lower-income neighborhoods, either directly, with people moving to these areas, or indirectly, by keeping socially mobile households in these areas for a longer period.
In the Dutch context Boschman et al. (Citation2013) show that in-movers to new housing in disadvantaged neighborhoods generally have higher levels of income than those who stay in these neighborhoods. However, effects on social mix from new housing are counteracted by out-movers having even higher levels of income. This shows that new housing may have intended effects (e.g. in-movers have higher income levels than those living in these neighborhoods) but selective residential mobility patterns counteract social mix ambitions. In this paper, we differentiate between various forms of tenures in the Swedish housing market in order to highlight how tenure mix and housing production relate to changing levels of social mix at the neighborhood level.
Social mix seems to be dependent on what is built where, and on how much available housing (for different income groups) that new construction adds to neighborhoods. Given that housing tenures tend to attract different population groups, the failure to create social mix through tenure mix could be an effect of residential preferences among population groups seeking similar neighbors.
The Swedish case – the housing market and planning for mix
In the 1960s, Sweden launched the million-homes program, which aimed to build one million new dwellings in a ten-year period. The goal was met, but even before its completion the program faced criticism, because the rather monotonous housing estates that were built gave rise to segregation. The general social mix ambition was formalized in 1975 (Bergsten & Holmqvist, Citation2013). The million-homes program was not only about building multi-family housing units with rental tenure; the outcome was the production of about a third each of the three main tenure forms: ownership housing, almost exclusively in the form of single-family homes; tenant-owned cooperatives (co-ops; bostadsrätt); and rental housing. Co-ops and rental housing are most common in multi-family housing, even if there are examples of detached houses with co-op and rental tenure. A co-op unit is owned by the cooperative; however, tenants have the right to live in an apartment, a right that can be traded on the open market. The ownership of the co-op is indirect, but in practical terms, a co-op is an owned apartment unit (Christophers, Citation2013). Rental housing in Sweden is owned by larger or smaller private or public companies. Municipality-owned public housing (Allmännyttan) was created during the mid-1900s to secure decent dwellings for all and to counteract speculation in the housing market. There are no restrictions on who may enter public rental housing, but income requirements do exist. These have become stricter over the past decade (Grundström & Molina, Citation2016; Magnusson & Turner, Citation2008). To access rental housing, a tenant needs queuing time. This has become a severe problem in the last decades. Borg (Citation2019) shows that residualization in the public rental sector has become a problem in more sparsely populated locations, as opposed to metropolitan areas, where demand is higher than supply. Private rental housing has traditionally been accessed through queues, which are not as transparent as queues for the public rental housing, and the need for sufficient income levels has also been stressed. Sweden does not have designated social housing or any formalized income requirements for rental contracts that the social services provide to households in need. These social rental contracts are most often found in municipal public housing companies.
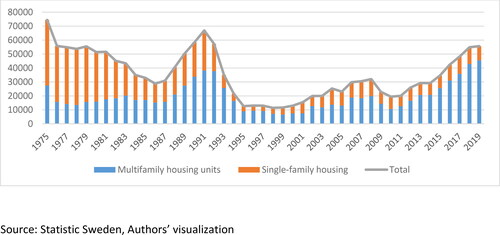
Housing production in Sweden has dropped since the million-homes program. Production rates plummeted after the economic crisis in 1991/92 (see ), but have risen since the early 2000s. During the whole period and especially in recent years, one and two-bedroom apartments are the most common types of apartments in new construction. Spending for housing production rose dramatically in the state budget during the late 1980s, and politicians decided to cut subsidies to housing and housing allowances in order halt budget deficits. More recently, mortgage tax reductions and property taxation have favored owned housing forms. Since the economic crisis in 1991/92, the focus of Swedish housing policy has gradually shifted from general measures to more selective interventions. Prior to the 1990s housing production was mainly driven by rent subsidies to builders, but now it is mainly driven by the ability of households to secure and pay mortgages (Scocco & Andersson, Citation2017).
Figure 1. Housing production rate in Sweden 1975–2019. Source: Statistic Sweden, Authors’ visualization.
Since 1991 it has been legal to convert public housing to private tenant-owned cooperatives and to sell public housing to private rental companies (Andersson & Turner, Citation2014). This has predominantly taken place in larger metropolitan areas, especially Stockholm. Wimark et al. (Citation2020) argue that while many earlier studies on tenure mix in Sweden have emphasized the pivotal role played by tenure conversions, other factors such as new construction, densification and renewal programs are also important to consider. They find that Sweden is generally characterized by rather low rates of mix at smaller spatial scales, but a high degree of tenure mix at a medium-sized geographical scale. This, Wimark et al. (Citation2020) argue, may be a consequence of planning practices where a local center is surrounded by distinct neighborhoods or areas that have similar housing tenures, but exhibit a strong mix when aggregated together. This is argued to be important for acknowledging how mix can be understood and for making informed decisions about housing tenure mix. They identify tenure conversions, newly built dwellings in the major cities, and the densification of owner-occupied areas outside of cities as key drivers of homogenization of housing tenure landscapes in Sweden. However, there are important findings indicating that clusters of specific tenure types at lower geographical scales tend to overlap with a broader range of incomes. Small-scale clusters appearing in areas dominated by other tenure forms may have the potential to increase social or economic mix (Andersson et al., Citation2022).
Bergsten & Holmqvist (Citation2013) argue that the Swedish model of social mix has the potential to avoid unintended effects (e.g. gentrification, displacement) because more wealthy areas are also targets of mixing policies. Tenure mix is an active policy in Swedish cities, but is skewed towards lower-income neighborhoods (Bergsten & Holmqvist, Citation2013). Municipalities have a planning monopoly; they decide what should be built and where. This has led to many new housing developments being planned with the mixed tenure ambition in mind (Andersson & Turner, Citation2014; Bergsten & Holmqvist, Citation2013). The possibility to ensure tenure mix is, of course, affected by land ownership and construction costs for different types of housing units. At the same time, tenure mix only has the potential to lead to social mix if there is a relation between the tenure form and socio-economic position, a relation that has grown stronger in Sweden over time (Holmqvist & Turner, Citation2014).
In this paper, we cover a period (1995–2017) with increasing construction of housing, but also study the development of social mix outside the metropolitan areas (in response to the call from Gibb et al., Citation2019). Following Wimark et al.’s (Citation2020) findings on the importance of new production, this study focuses on the role of new production of housing units, highlighting the impact of housing tenure mix on social mix in urban areas across Sweden.
Data and empirical strategy
To be able to explore how new housing production has affected levels of tenure and social mix, we make use of a unique database – Geosweden. This database is compiled by Statistics Sweden and is located at the Institute for Housing and Urban Research at Uppsala University. It contains individual level data for everyone registered as residing in Sweden each year between 1990 and 2017. The data contains each person’s demographic characteristics, various types of income, household information, country of birth and geocoded information on location, type and form of housing. We make use of a subset of this database. In the following section, we describe which geographies we study, our definition of new housing, and our operationalization of tenure type mix and social mix.
Municipalities and demographic statistical areas in metropolitan areas
In this study, we focus on urbanized parts of the metropolitan areas (Stockholm, Gothenburg and Malmö) and the larger cities in Sweden. We use the Swedish Association of Local Authorities and Regions’ (SKR) municipal typology to identify which municipalities to include in this study. In total this amounts to 67 out of Sweden’s 290 municipalities.
In the analysis, we use what are called demographic statistical areas (Demografiska statistikområden, abbreviated as DeSOs) as our neighborhood proxy. The DeSO system divides Sweden into 5,984 areas, which in 2018 had between 700 and 2,700 inhabitants each. DeSOs have been used in in segregation studies (Bråmå & Andersson, Citation2020) and residential mobility studies (Alm Fjellborg, Citation2018).
DeSOs were officially introduced by Statistics Sweden in 2018, therefore we have retroactively linked all data on individuals and premises to the correct neighborhood. The data on individuals was linked to the locations where they were registered in 1995 and 2017 respectively. Each location was then linked to a DeSO through coordinates.
It is important to note that several DeSOs were almost unpopulated in 1995. This has some advantages and some disadvantages. According to Statistics Sweden, each DeSO had between 700 and 2,700 inhabitants in 2018, and we can therefore conclude that areas with low population numbers in 1995 were associated with extensive production of new housing in 1995–2017. This is demonstrated in the left-hand panel of .
Figure 2. Share of new housing by DeSO-population 1995 (left panel), DeSO-population 1995 and 2017, (DeSO with more than 250 inhabitants in 1995) points colored by share of new housing share of new housing (right panel). Source: Geosweden, Authors’ calculations.
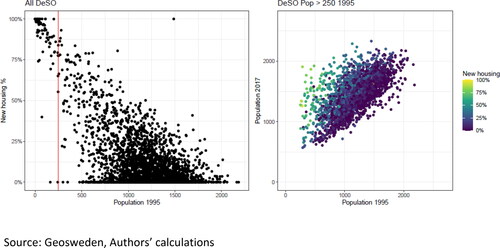
Since we wish to follow neighborhoods over time, we have chosen a threshold population of 250 inhabitants in 1995 for DeSOs to be included in our estimation of the effects of new housing on tenure type and social mix (points to the right of the red line in ). The association between population in 1995 and population in 2017, as well as the share of new housing, for this subset of DeSOs, is shown in the right-hand panel of .
New housing
We identify all housing units as belonging to one of the following categories: Owner-occupied housing units, Co-op housing, Non-public rental housing units, Public rental housing units. All housing units are identified in 2017, and thus we do not examine the composition of housing units in each DeSO in 1995. Units that were built after 1995 are classified as ‘new housing’. We link all individuals (15 years of age and above) to their housing unit of residence in 1995 and 2017. We are thus able to study population composition in the neighborhood (DeSO) before and after new housing units have been added, as well as the population composition for each individual housing unit in 2017. As mentioned in the previous section, only DeSOs above the population threshold will be included in the longitudinal analyses of neighborhoods.
Tenure type mix
We operationalize tenure type mix using the normalized version of the Shannon diversity index. The index (or variations of it) is widely used in the literature (see Musterd & Andersson, Citation2005). The index is calculated as follows,
(1)
(1)
where,
is the diversity index for neighborhood j, pi,j is the proportion of housing units in each tenure type I in neighborhood j, and I is the total number of tenure types. In our case we have used the four distinct tenure types mentioned in the previous section: Owner-occupied housing units, Co-op housing, Non-public rental housing units, Public rental housing units. The index ranges from 0 to 1, where 0 indicates no tenure type mix and 1 maximum variation of tenure types (i.e. the same number of units in each category). The diversity index has been calculated for old and new housing units as well as all the housing units in each DeSO in 2017.
Operationalization of social mix
Our main outcome of interest is social mix. Musterd & Andersson (Citation2005) make use of wage income when analyzing social mix, however their sample consists of a working-age population. Here we will base the definition of social mix on disposable income adjusted for household/family composition.Footnote2 This is because we include the population that has retired (usually those above 65 years) and we argue that since disposable income includes wages after taxes and capital gains and losses, this measure give us a fuller view of families’ consumption capacity. Families/households are the prime unit for decision making when it comes to housing; therefore we argue in favor of the family adjusted disposable income measure when analyzing social mix between neighborhoods. We calculate regional percentiles and place all adult individuals in our sample (18 years of age and above, in 1995 and 2017) in their percentile and use them as inputs to calculate a Theil index using the following formula:
(2)
(2)
where
is the Theil index for neighborhood j,
is the adult population in neighborhood j,
is the income of individual i in neighborhood j (
), and
the mean income in neighborhood j (
). Higher Theil index values indicate more social mix, and lower values indicate less social mix.
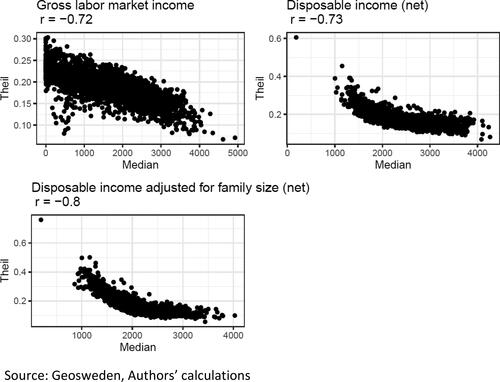
Regardless of the income measure used, we observe a negative correlation between the median income (I) in DeSO (j) and social mix (Theil index calculated for wages, net disposable income or family adjusted disposable income in DeSO j) in 2017; see . Our interpretation is that according to our definition, poorer neighborhoods are more socially diverse concerning income (which is expected, because our income measure is capped at 100). However, we also note that we are able to observe variation in social mix across the DeSOs with similar median income levels.
Figure 3. Correlations, theil-index and various income measures at the DeSO-level 2017. Source: Geosweden, Authors’ calculations.
Empirical strategy
Since the location of new housing production in an urban area is non-random (especially when municipalities use active housing policies), estimating the causal relationship between new housing production, tenure type mix and social mix cannot realistically be done through any natural experiments.Footnote3
We will estimate the association between new housing and tenure type mix, as well as social mix using a traditional regression control framework. Tenure type mix is estimated using the following specification:
(3)
(3)
where
is tenure type mix (calculated using EquationEquation (1)
(1)
(1) ) in DeSO i in 2017,
is the percentage of the housing stock in DeSO i built after 1995, and
is a vector of controls including population in DeSO i in 1995, median disposable income (adjusted for family size) in DeSO i in 1995, the interaction between
and median disposable income (adjusted for family size) as well as municipal controls.
is the parameter of interest.
Change in social mix (the change in the Theil index using family adjusted disposable income deciles as input) is estimated using the following specification:
(4)
(4)
where
is the change in social mix (calculated using EquationEquation (2)
(2)
(2) ) in DeSO i between 1995 and 2017,
is the percentage of the housing stock in DeSO i built after 1995,
is a vector of controls including population in DeSO i in 1995, median disposable income (adjusted for family size) in DeSO i in 1995, social mix in 1995 (
), and tenure type mix in 2017 (
).
is the parameter of interest.
Who lives in new housing units?
The potential link between social mix and new housing is dependent on the households moving into the new housing units. An extensive analysis of this question is outside the scope of the study. We will, however, analyze the relationship between disposable income and residency (new or old housing) and tenure type using the following specification:
(5)
(5)
where
is the natural logarithm of disposable income (adjusted for family size) in 2017 for the individual i in DeSO j,
is a dummy variable indicating whether individual i resides in new or old housing,
is the natural logarithm of median disposable income (adjusted for family size) in DeSO j in 1995,
is the tenure type (Co-op, public rental, private rental or owner occupied) of the housing unit where individual i resides in 2017, and
is a vector of regional dummies. We will exclude the third interaction term from our baseline specification.
We will report the estimated income differences between new and old housing based on the interactions of ,
.
(6)
(6)
If is positive, residents of new housing units have higher incomes than residents of old housing units.
Bespoke neighborhoods
EquationEquations (3)(3)
(3) and Equation(4)
(4)
(4) will be estimated using data for DeSO neighborhoods with populations above a threshold of 250 individuals in 1995 (n = 2,873). We will also do the same estimation for larger geographical units – bespoke neighborhoods – consisting of each DeSO in our sample and its five nearest DeSOs. We use the Euclidean distance between the each DeSO centroid as our distance measure; this results in 2,989 bespoke neighborhoods. The purpose of including the bespoke neighborhood or district estimation is to increase the understanding of how policies for achieving social mix through tenure mix are implemented with a wider geographical scope by planners. Since we use a nearest-neighbor approach, individuals and housing in some DeSO will be included in index calculations and in multiple bespoke neighborhoods. gives a schematic view of the construction and the overlap. The black neighborhood unit is in the center if its own bespoke neighborhood (light grey). These bespoke neighborhoods overlaps with bespoke neighborhoods of other neighborhood units (dark grey). Of course, white and dark grey areas in are also neighborhoods with their own bespoke neighborhood and overlap with other units of analysis.
Figure 4. Schematic description of bespoke neighbourhoods.

Thus, we will answer two separate questions using our estimations:
To what extent has new housing contributed to tenure type mix?
To what extent has new housing contributed to social mix?
Results
We start this results section by investigating the relationship between new housing production and housing tenure mix. We answer the question of whether or not housing mix is implemented and how it affects various types of neighborhoods.
Housing production and housing tenure mix
As shown in , tenure type mix (measured by the Shannon Diversity Index) is higher in areas where more housing was built after 1995. The difference between areas where almost no new housing was built and the other areas is striking. It is notable that regardless of the share, new housing contributes to higher levels of tenure mix across neighborhoods. It is also of interest to note that in areas where a large part of the housing stock is relatively new, this new part of the housing stock is tenure mixed.
Table 1. Mean tenure type mix in DeSO by percentage of new housing.
The findings reported in further indicate that municipalities have been successful in strengthening housing tenure mix through new construction. A one percent increase in new housing is associated with an increase in H’ of approximately five percentage points. The size of estimate is diminished to one percentage point if the same regressions are estimated using our bespoke neighborhoods instead of DeSOs.
Table 2. New housing and tenure type mix.
The results in show a clear positive relationship between new housing construction and tenure type mix in 2017. As shown in , in most neighborhoods, especially those where 50 percent of the housing stock was built in 1995–2017, new housing has mostly come in the form of co-op housing units. This is not surprising, since co-op housing was the dominating tenure type for new housing construction during this period. In our sample, approximately 148,000 new co-op units were built, 110,000 rental housing units, 76,000 owner-occupied housing units and 49,000 public rental housing units.
Table 3. Distribution of new housing units by tenure type in DeSO by share of new housing stock.
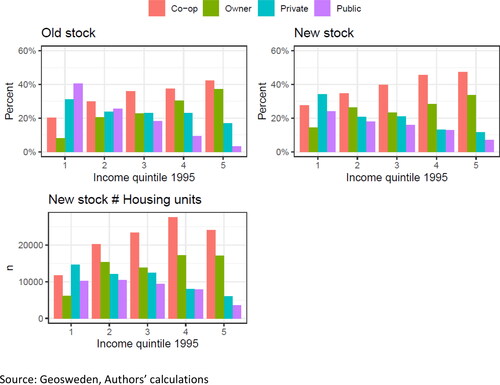
Thus, housing tenure mix has likely been achieved through the addition of co-op and rental housing units in areas previously dominated by a single tenure type. Our results are in line with findings from Bergsten & Holmqvist (Citation2013), who show that tenure mix is an active policy in urban planning across Sweden. displays the share of new production and old housing stock by tenure type and neighborhood income levels in 1995. It is clear that new housing production increased the share of co-ops and private rental housing in neighborhoods with the lowest income levels. In higher income neighborhoods, co-op housing production is substantial, and there is an increase of rental housing units. However, it becomes clear from the levels of housing production that increased production of co-op housing is the main driver of tenure composition change across neighborhoods. The owned part of the housing stock (owner occupancy and co-ops) tends to dominate new production and the older stock in higher income neighborhoods. Additions of rental housing are very small, and the share of public rental housing in new housing is somewhat higher than the share of public rental housing in the older stock. Results from this analysis confirm that the policy tool (tenure type mix) seems to be used. As shown in , we suggest that this is done through construction of rental and, above all, co-op housing units.
Figure 5. Old and new housing (1995–2017) by tenure type and neighborhood income quintile 1995. Source: Geosweden, Authors’ calculations.
The relationship between new housing and social mix
Increased tenure mix is achieved through new housing construction in urban neighborhoods across Sweden. This is not the goal, however, but rather the tool used to achieve social mix. Therefore, we continue to analyze the relationship between new housing construction and social mix.
In , we have calculated the difference in Theil index (wages and disposable incomes adjusted for family size) between individuals in new and old housing by tenure type. All individuals above 18 years of age residing in urban areas are included (n = 4,003,506). As shown, we observe less heterogeneity with regard to income in the new housing stock, regardless of tenure type.
Table 4. Theil index for wages and disposable income in 2017 by new and old housing across DeSO areas in Sweden.
In , we estimated the relationship between the relative size of new housing by neighborhood (DeSO and our bespoke neighborhoods) and social mix using the OLS regressions specified in EquationEquation (4)(4)
(4) .
Table 5. OLS-regression. Dependent variable change in social mix 1995–2017.
Our coefficient of interest (% New housing) is negative and statistically significant in all specifications. This indicates that new housing construction is associated with a homogenization process. DeSOs with more housing construction were less diverse in 2017 than DeSOs with less housing construction, controlling for the covariates specified in EquationEquation (4)(4)
(4) . The point estimate is lower (i.e. a larger negative effect) when estimating the regression on the bespoke neighborhoods. One could discuss whether the size of the point estimate is economically significant; according to our estimates, a one percent increase in new housing is associated with 0.2 percent lower social mix. We also note that the coefficient for tenure type mix is positive when we estimate the coefficients on our bespoke neighborhoods, while the coefficient is negative when we estimate it on DeSOs with more than 250 inhabitants in 1995. These results are in line with Wimark et al.’s (Citation2020) findings that Swedish urban areas are more tenure mixed at an intermediate geographical level. To this we can add that tenure mix at this intermediate geographical level is also associated with an increase in the Theil index.
Higher incomes in new housing, especially in neighborhoods with weak socioeconomic status
According to our results, new housing reduces social mix, at least when social mix is operationalized using a Theil index with disposable income-percentiles adjusted for family size as inputs.Footnote4 This result seems to be the exact opposite of what policy makers want to achieve. In this section, we have analyzed the relationship between new housing and income at the individual level. We thus compare individuals living in new housing and old housing across different neighborhoods, regions and tenure types. In and , we have analyzed the average income differences between new and old housing conditional on the covariates listed in EquationEquation (5)(5)
(5) . The average income difference was calculated according to EquationEquation (6)
(6)
(6) .
Figure 6. Predicted income differences inhabitants in new and old housing 2017, by DeSO income level in 1995. Source: Geosweden, Authors’ calculations.
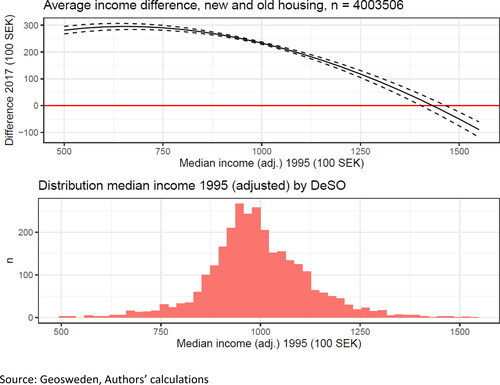
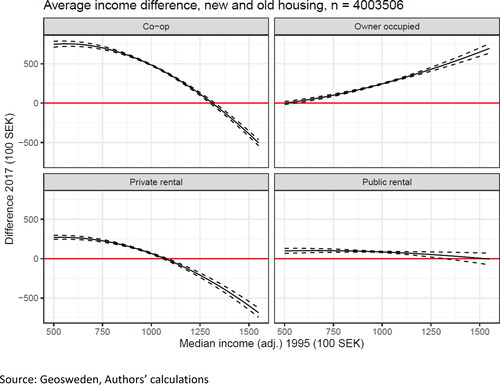
Figure 7. Predicted income differences inhabitants in new and old housing 2017, by DeSO income level in 1995, and tenure type (vs housing of the same tenure type). Source: Geosweden, Authors’ calculations.
As seen in (top panel), individuals living in new housing in neighborhoods with a lower median income in 1995 had an average yearly disposable income adjusted for family size that was approximately 20–30,000 SEK higher than those in old housing units. However, the estimated difference decreases with higher median income in the DeSO in 1995. In the DeSOs with the highest median incomes in 1995, the difference is negative, indicating that the average income of residents in new housing units in these neighborhoods was lower than that of residents in the old housing stock.
In we have included tenure types. The incomes of residents living in new co-op units were on average 50,000–75,000 SEK higher than those of the residents in old co-op housing units in neighborhoods where the median income was below 100,000 SEK in 1995 (The median income in our sample was 97,800 SEK in 1995). In DeSOs where the median income was above 125,000 SEK in 1995, individuals living in new co-op units had lower incomes (on average) than residents in old co-op units.
A similar pattern can be seen for new private rental units. The difference is smaller in areas with lower median incomes in 1995 and higher in areas with higher median incomes (i.e. with even lower incomes than residents of old private rental units). Residents in new public housing units had higher incomes, on average, than residents of old public housing units across all neighborhoods, except for the neighborhoods with the highest median incomes in 1995, where no statistically significant difference could be found. We note the rather small difference between average income levels across neighborhood types in new and old public rental housing.
The curve for new owner-occupied housing units displays a trajectory that is different than the other tenure types. Residents in new owner-occupied housing had higher incomes, on average, across the median income distribution in 1995. In contrast to other tenure types, the income differences between residents of old and new owner-occupied housing increase with higher median neighborhood income in 1995.
We have also analyzed the estimated difference between new housing by tenure types in relation to all housing in the old stock, conditional on median neighborhood income in 1995, municipality type and region; the results are given in .
Figure 8. Predicted income differences inhabitants in new and old housing 2017, by DeSO income level in 1995, and tenure type (vs all other housing). Source: Geosweden, Authors’ calculations.
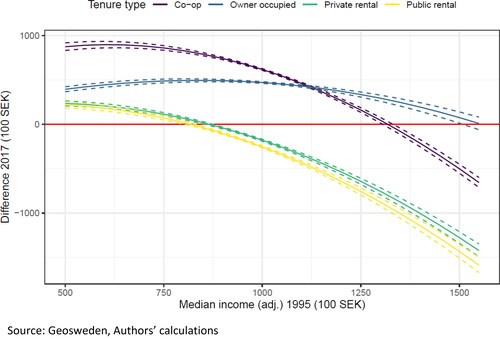
It is clear that all new production tends to attract a population with higher levels of income than in the rest of the housing stock in low-income neighborhoods. The curves for all tenures then fall, showing that new housing tends to attract a population with lower income those living in the older stock in higher income neighborhoods. New co-op housing tends to attract a population with significantly higher levels of income than residents in the rest of the stock in low income neighborhoods; this line drops, and it is only in the neighborhoods with quite high median income that new co-ops attract a population with lower levels of income than in the older stock. New owner-occupied housing tends to attract higher income earners, regardless of which neighborhood it is built in. New rental housing (public and private) attracts a population with slightly higher income levels than others living in low-income neighborhoods, while the difference between new rental tenants in higher income neighborhoods and those living in the older housing stock in these neighborhoods is quite substantial.
thus shows that all new housing production can be expected to have the same effect on social mix; in low-income neighborhoods, new housing attracts a somewhat wealthier population while new housing tends to attract a population with lower average levels of income than those living in the older stock in higher income neighborhoods. However, it is clear that the difference between those living in the older stock and new housing is largest for co-ops in low-income neighborhoods and rentals in high-income neighborhoods. It is worth reiterating here that shows how the addition of private rental housing units and co-ops is increasing housing tenure mix in low income neighborhoods, but since private and public rental housing units make up the bulk of new housing units in these areas, effects on social mix are rather small (see ).
Conclusion and discussion
New production of housing seems to have contributed to housing tenure mix in Swedish urban areas. Our results indicate that smaller additions of new housing increase tenure mix and large additions of new housing increase tenure mix more. This is important to note, since housing tenure mix thus seems to be implemented quite successfully in smaller and larger housing development projects. We find evidence showing that new housing increases tenure mix across all types of neighborhoods (characterized by median income levels in 1995). New housing increases mix in the neighborhood (DeSO) in which it is built, but the tenure setup of the district in which the DeSO is located seems to be a factor as well, since new housing has a positive impact on tenure mix in the bespoke neighborhood (the DeSO and its neighboring DeSO areas). The bulk of new production during the analyzed period was co-ops and rental housing, indicating that tenure mix is achieved mainly through the addition of co-ops in rental-dominated neighborhoods, and vice versa.
The second question was concerned with the extent to which new housing contributed to social mix. According to our results, new housing construction seems to induce a reduction in social mix at the neighborhood level, at least when using our operationalization of social mix. There is no evidence suggesting that this is different across neighborhoods categorized by income levels in 1995.
However, our results also indicate that new housing has had the desirable capacity (if increased neighborhood social mix is the desired outcome) to attract households with relatively higher incomes to lower income areas, and households with relatively lower incomes to higher income areas. Lees (Citation2008) argues that housing mixing strategies are often one-sided, focusing on attracting affluent households to poorer neighborhoods but disregarding the need for lower income households to be able to acquire housing in more wealthy neighborhoods in order for mixing to be achieved. Here we show that tenure mix across neighborhoods can have the desired effect of increasing social mix. Our findings indicate that this, at least to some extent, is the case in Sweden. Since 1995 housing construction in Sweden has attracted more affluent (though middle class is probably a more appropriate characterization) households to lower income areas. We find that the population living in new housing in wealthier neighborhoods has a lower average income than residents in the older housing stock. However, there have been higher levels of addition of co-op housing in low-income neighborhoods than additions of rental housing to wealthier neighborhoods. This indicates that the Swedish ambition of achieving mixing in all types of neighborhoods is being implemented and having the desired effects, but there are still clear tendencies toward the one-sided mixing strategy that Lees (Citation2008) discusses. This result is worth stressing, since tenure type mix has increased in most areas due to housing production.
According to our results, social mix at the neighborhood level is not achieved even if new housing could have the intended outcome, that is, increasing tenure type mix and attracting a population with different income levels than those already living in the neighborhood. The negative association between social mix and new housing could be a result of other processes related to selective residential mobility. Out-movers from low-income neighborhoods probably have higher levels of income than those entering new housing, as found in the Netherlands (Boschman et al., Citation2013). The high rates of production of co-ops in mid- to high-income neighborhoods could potentially dwarf the contribution to social mix of the addition of rental housing in these areas.
The sorting of movers according to income has also grown stronger in Sweden during the last 30 years (Fjellborg, Citation2021b). Though outside the scope of this paper, a careful analysis of the characteristics of in-movers and out-movers to new and old housing units in different neighborhoods could shed more light on these questions. From a policy and planning perspective, tenure type mix in new housing at the neighborhood level seems to be a blunt tool, if the objective is to achieve higher levels of social mix in the same neighborhood. This is especially the case because residents in new housing (regardless of tenure type) seem to be more homogeneous with regard to income than residents in old housing units. However, it is worth stressing that building rental housing in higher income areas and co-op housing in lower income areas attracts populations with levels of income that should lead to stronger social mix.
Large-scale development of private or public rental units in middle to upper-middle class areas would probably have an impact on the social mix in these areas. However, since many residents are aware of problems associated with the earlier large-scale development of housing estates in Sweden, and have paid a premium to distance themselves from these areas, implementing such plans is likely to be very difficult. Planners and policymakers should probably focus on dealing with the negative aspects associated with areas dominated by private and public rental housing, continue with tenure mix ambitions in infill development projects, and be more selective about where and how much tenure conversion is allowed.
Acknowledgments
We would like to thank the three anonymous reviewers for useful comments and suggestions on an earlier draft of this paper. We are also grateful for the discussions on planning and implementation of social mix ambitions with colleagues at the department of planning at Uppsala municipality, especially Elin Blume and Örjan Trapp.
Disclosure statement
No potential conflict of interest was reported by the author(s).
Notes
1 However, Chetty et al. (Citation2016) found negative effects on older youth and little impact on adults’ economic outcomes.
2 Family adjusted disposable income is derived from the household’s total disposable income, adjusted according to number of children and adults in the household. See SCB 2019, https://scb.se/contentassets/894d4afa900f4123aece341cd10e59e2/he0110_kd2_2019_jl_210127.pdf
3 During our period of study, urban (and suburban) municipalities in Sweden fortunately suffered no exogenous shocks (such as natural disasters or city fires) that prompted large interventions resulting in a completely new housing stock in an already established neighborhood. Instead, larger projects have mainly been concentrated to non-residential neighborhoods within cities, densification of existing residential areas, and the establishment of new neighborhoods on the outskirts of cities.
4 We obtain similar results if we use wages or other income measures.
References
- Allen, C., Camina, M., Casey, R., & Wood, M. (2005) Mixed Tenure, Twenty Years On - Nothing Out of the Ordinary (York/Coventry: Joseph Rowntree Foundation/Charted Institute for Housing).
- Alm Fjellborg, A. (2018) Housing tenure and residential mobility in Stockholm 1990–2014 (Doctoral dissertation, Department of Social and Economic Geography).
- Alves, S. (2019) Nuancing the international debate on social mix: Evidence from Copenhagen, Housing Studies, doi: 10.1080/02673037.2018.1556785
- Andersson, E., Wimark, T., & Malmberg, B. (2022) Tenure type mixing and segregation, Housing Studies, 37, pp. 26–49.
- Andersson, R. (2006) Breaking segregation’—Rhetorical construct or effective policy? The case of the metropolitan development initiative in Sweden, Urban Studies, 43, pp. 787–799.
- Andersson, R. & Turner, L. M. (2014) Segregation, gentrification, and residualisation: From public housing to market-driven housing allocation in inner city Stockholm, International Journal of Housing Policy, 14, pp. 3–29.
- Arthurson, K. (2012) Social Mix and the City: Challenging the Mixed Communities Consensus in Housing and Urban Planning Policies, p. 152 (Collingwood, Australia: CSIRO Publishing).
- Asquith, B., Mast, E., & Reed, D. (2019) Supply shock versus demand shock: The local effects of new housing in low-income areas. Available at SSRN 3507532.
- Atkinson, R. (2004) The evidence on the impact of gentrification: New lessons for the urban renaissance?, European Journal of Housing Policy, 4, pp. 107–131.
- Bergsten, Z. & Holmqvist, E. (2013) Possibilities of building a mixed city – Evidence from Swedish cities, International Journal of Housing Policy, 13, pp. 288–311.
- Bond, L., Sautkina, E., & Kearns, A. (2011) Mixed messages about mixed tenure: Do reviews tell the real story?, Housing Studies, 26, pp. 69–94.
- Borg, I. (2019) Universalism lost? The magnitude and spatial pattern of residualisation in the public housing sector in Sweden 1993–2012, Journal of Housing and the Built Environment, 34, pp. 405–424.
- Boschman, S., Bolt, G., Van Kempen, R., & Van Dam, F. (2013) Mixed neighbourhoods: Effects of urban restructuring and new housing development, Tijdschrift Voor Economische en Sociale Geografie, 104, pp. 233–242.
- Boterman, W. R. & Van Gent, W. P. (2014) Housing liberalisation and gentrification: The social effects of tenure conversions in Amsterdam, Tijdschrift voor economische en sociale geografie, 105, pp. 140–160.
- Bråmå, Å. (2012) The effects of neighborhood regeneration on the neighborhood hierarchy of the city: A case study in Sweden, in: M. van Ham, D. Manley, N. Bailey, L. Simpson, & D. Maclennan (Eds) Understanding Neighborhood Dynamics, pp. 111–138 (Dordrecht: Springer).
- Bråmå, Å. & Andersson, R. (2020) Change and persistence in the third dimension: Residential segregation by age and family type in Stockholm, 1990 and 2014, in: S. Musterd (Ed) Handbook of Urban Segregation, pp. 219–238 (Cheltenham: Edward Elgar Publishing).
- Cheshire, P. C. (2007). Segregated neighbourhoods and mixed communities: A critical analysis. Joseph Rowntree Foundation, York. ISBN: 978 1 85935 585 5
- Chetty, R., Hendren, N., & Katz, L. F. (2016) The effects of exposure to better neighborhoods on children: New evidence from the Moving to Opportunity experiment, American Economic Review, 106, pp. 855–902.
- Christophers, B. (2013) A monstrous hybrid: The political economy of housing in early twenty-first century Sweden, New Political Economy, 18, pp. 885–911.
- Dwyer, R. E. (2007) Expanding homes and increasing inequalities: US housing development and the residential segregation of the affluent, Social Problems, 54, pp. 23–46.
- Fjellborg, A. A. (2021a) Leaving poor neighbourhoods: The role of income and housing tenure, Housing Studies, 36, pp. 1122–1142.
- Fjellborg, A. A. (2021b) Residential mobility and spatial sorting in Stockholm 1990–2014: The changing importance of housing tenure and income, International Journal of Housing Policy, pp. 1–21. doi: 10.1080/19491247.2021.1893117
- Galster, G. C. & Friedrichs, J. (2015) The dialectic of neighborhood social mix: Editors’ introduction to the special issue, Housing Studies, 30, pp. 175–191.
- Gibb, K., Meen, G., & Nygaard, C. (2019) Long-run urban dynamics: Understanding local housing market change in London, Housing Studies, 34, pp. 338–322.
- Goodchild, B. & Cole, I. (2001) Social balance and mixed neighborhoods in Britain since 1979: A review of discourse and practice in social housing, Environment and Planning D: Society and Space, 19, pp. 103–121.
- Graham, E., Manley, D., Hiscock, R., Boyle, P., & Doherty, J. (2009) Mixing housing tenures: Is it good for social well-being?, Urban Studies, 46, pp. 139–165.
- Grundström, K. & Molina, I. (2016) From Folkhem to lifestyle housing in Sweden: Segregation and urban form, 1930s–2010s, International Journal of Housing Policy, 16, pp. 316–336.
- Hedin, K., Clark, E., Lundholm, E., & Malmberg, G. (2012) Neoliberalization of housing in Sweden: Gentrification, filtering, and social polarization, Annals of the Association of American Geographers, 102, pp. 443–463.
- Hedman, L., Van Ham, M., & Manley, D. (2011) Neighborhood choice and neighborhood reproduction, Environment and Planning A: Economy and Space, 43, pp. 1381–1399.
- Hochstenbach, C. (2017) State-led gentrification and the changing geography of market-oriented housing policies, Housing, Theory and Society, 34, pp. 399–419.
- Holmqvist, E. & Bergsten, Z. (2009) Swedish social mix policy: A general policy without an explicit ethnic focus, Journal of Housing and the Built Environment, 24, pp. 477–490.
- Holmqvist, E. & Turner, L. M. (2014) Swedish welfare state and housing markets: Under economic and political pressure, Journal of Housing and the Built Environment, 29, pp. 237–254.
- Kintrea, K. (2013) Social mix: International policy approaches, in: D. Manley, et al (Eds.) Neighborhood Effects or Neighborhood Based Problems?: A Policy Context, pp. 133–155 (Dordrecht: Springer Science and Business).
- Kleinhans, R. (2004) Social implications of housing diversification in urban renewal: A review of recent literature, Journal of Housing and the Built Environment, 19, pp. 367–390.
- Lee, K. O. (2014) Why do renters stay in or leave certain neighborhoods? The role of neighborhood characteristics, housing tenure transitions, and race, Journal of Regional Science, 54, pp. 755–787.
- Lees, L. (2008) Gentrification and social mixing: Towards an inclusive urban renaissance?, Urban Studies, 45, pp. 2449–2470.
- Livingston, M., Kearns, A., & Bailey, N. (2013) Delivering mixed communities: The relationship between housing tenure mix and social mix in England’s neighborhoods, Housing Studies, 28, pp. 1056–1080.
- Magnusson, L. & Turner, B. (2008) Municipal housing companies in Sweden – social by default, Housing, Theory and Society, 25, pp. 275–296.
- Martin, G. & Watkinson, J. (2003) Rebalancing Communities: Introducing Mixed Incomes into Existing Rented Housing Estates (York: Joseph Rowntree Foundation).
- Murie, A. (2015) The right to buy, history and prospects. History & Policy. Available at http://www.historyandpolicy.org/policy-papers/papers/the-right-to-buy-history-and-prospect (accessed 09 October 2020).
- Musterd, S. & Andersson, R. (2005) Housing mix, social mix, and social opportunities, Urban Affairs Review, 40, pp. 761–790.
- Rolnik, R. (2013) Late neoliberalism: The financialization of homeownership and housing rights, International Journal of Urban and Regional Research, 37, pp. 1058–1066.
- Sarkissian, W. (1976) The idea of social mix in town planning: An historical review, Urban Studies, 13, pp. 231–246.
- Sautkina, E., Bond, L., & Kearns, A. (2012) Mixed evidence on mixed tenure effects: Findings from a systematic review of UK studies, 1995–2009, Housing Studies, 27, pp. 748–782.
- Schelling, T. C. (1971) Dynamic models of segregation, The Journal of Mathematical Sociology, 1, pp. 143–186.
- Scocco, S. & Andersson, L.-F. (2017) Hushållens skulder och framtidens bostadsfinansiering. Hushållens, statens och finansiella sektorns roll för att finansiera bostadsbyggandet. Rapport 2, Bostad 2030.
- Smith, S. J. (2015) Owner occupation: At home in a spatial, financial paradox, International Journal of Housing Policy, 15, pp. 61–83.
- South, S. J. & Crowder, K. D. (1997) Escaping distressed neighborhoods: Individual, community, and metropolitan influences, American Journal of Sociology, 102, pp. 1040–1084.
- South, S. J. & Crowder, K. D. (1998) Leaving the ‘hood’: Residential mobility between black, white, and integrated neighborhoods, American Sociological Review, 63, pp. 17–26.
- van Gent, W., Das, M., & Musterd, S. (2019) Sociocultural, economic and ethnic homogeneity in residential mobility and spatial sorting among couples, Environment and Planning A: Economy and Space, 51, pp. 891–912.
- van Ham, M., Manley, D., Bailey, N., Simpson, L., & Maclennan, D. (2012) Understanding neighbourhood dynamics: new insights for neighbourhood effects research. In: van Ham, M., D. Manley, N. Bailey, L. Simpson, & D. Maclennan (Eds.) Understanding Neighbourhood Dynamics (Dordrecht: Springer).
- Vogiazides, L. (2018) Exiting distressed neighbourhoods: The timing of spatial assimilation among international migrants in Sweden, Population, Space and Place, 24, pp. e2169.
- White, M. J., Fong, E., & Cai, Q. (2003) The segregation of Asian-origin groups in the United States and Canada, Social Science Research, 32, pp. 148–167.
- Wimark, T., Andersson, E. K., & Malmberg, B. (2020) Tenure type landscapes and housing market change: A geographical perspective on neo-liberalization in Sweden, Housing Studies, 35, pp. 214–237.