
 ?Mathematical formulae have been encoded as MathML and are displayed in this HTML version using MathJax in order to improve their display. Uncheck the box to turn MathJax off. This feature requires Javascript. Click on a formula to zoom.
ABSTRACT
The ‘flexoelastic ratio’ is commonly used to characterise the electro-optic behaviour of chiral nematic liquid crystal (LC) devices that exhibit flexoelectro-optic switching. There has been renewed interest in this electro-optic effect of late as new LC materials and mixtures have been developed that exhibit large tilt angles, Ø, of the optic axis (Ø ≥ 45°) whilst maintaining a fast response time (< 1 ms). In this study, we compare the different flexoelastic ratios that are obtained for fixed and variable-pitch chiral nematic LCs for materials with a tilt of the optic axis as large as Ø = ± 45°. We show that for large tilt angles of the optic axis the values for the two different flexoelastic ratios measurably diverge. Of the two ratios, we propose that for large tilt-angle mixtures it is more appropriate to use the flexoelastic ratio that is derived for the case when the pitch of the helix is constrained. In addition, a simple way of determining the ‘pitch-constrained’ flexoelastic ratio is presented that involves identifying the electric field amplitude at the point for which the transmission levels are the same for both positive and negative electric field polarities.
GRAPHICAL ABSTRACT
Introduction
Flexoelectricity in nematic liquid crystals (LCs) was first considered by Meyer in 1969 and is a phenomenon that involves the direct coupling between the electric polarisation and director curvature distortions [Citation1,Citation2]. This flexoelectric polarisation, Pflexo, can be induced through a combination of splay and bend deformations of the director profile and can be expressed mathematically as:
where is a unit vector that represents the director of the LC whereas
and
are the splay and bend flexoelectric coefficients, respectively. In chiral nematic LCs, the coupling between an electric field and flexoelectricity leads to a macroscopic rotation of the optic axis, which may be as fast as 100 μs when the pitch of the helix is small (< 300 nm) [Citation3–Citation5]. This electro-optic behaviour is known as the flexoelectro-optic effect and is observed when an electric field is applied orthogonal to the helical axis. The most commonly studied configuration involves a uniform lying helix (ULH) alignment of the chiral nematic LC whereby the helical axis is aligned parallel to the device substrates [Citation3–Citation20].
To understand the helical flexoelectro-optic behaviour it is necessary to consider the total flexoelastic energy density for a chiral nematic LC, which can be expressed as a sum of the Frank elastic energy terms and the terms that describe the coupling between the flexoelectric polarisation, given by Equation (1), and the electric field, which is applied perpendicular to the helical axis [Citation3–Citation5]. Minimising this free-energy with respect to the helical pitch and the electric field induced tilt (the rotation of the optic axis about the field direction) leads to the familiar relationships:
and
where Ø is the tilt angle of the optic axis, and
are the splay and bend elastic coefficients of the LC, respectively,
is the natural wavenumber (
where
is the natural pitch), q is the actual (electric field-dependent) wavenumber, and E is the applied electric field amplitude [Citation3].
Equation (2) is often quoted as the relationship for the flexoelectro-optic tilt angle in terms of the flexoelastic ratio, , which is considered to be an important parameter as it represents a figure-of-merit in terms of the performance of the device. The tilt angle,
, changes the sign on the reversal of the applied electric field and for small tilt angles (
) its magnitude increases linearly with the applied field. By virtue of this linear dependence, and provided that the pitch of the helix is known, the flexoelastic ratio can then be determined by measuring the electro-optic tilt angle, Ø, over a range of applied electric field amplitudes and then extracting the gradient [in accordance with Equation (2)]. Importantly, it can also be seen from Equation (3) that as the tilt angle increases, the field-induced wavenumber, q, of the helix increases corresponding to a decrease in the helical pitch. Therefore, this model is only relevant when the pitch is free to change on the application of an electric field.
An alternative flexoelastic ratio
Even though it is possible for the pitch to change, in practice it is quite common for the pitch to be fixed. For example, a polymer network may be included in order to ‘lock-in’ a chosen alignment and to prevent the helix from unwinding under high electric field amplitudes [Citation11,Citation16,Citation20]. In addition, for the ULH alignment, surface interactions, imperfections in the alignment, and trapped defects also tend to inhibit changes in the pitch when an electric field is applied. Therefore, it is perhaps more realistic to consider the case when the pitch is fixed by boundary conditions. To deal with the case of a fixed pitch, an alternative model was proposed by Lee et al. [Citation5], which involved constraining the wavevector to be fixed when minimising the flexoelastic energy in the presence of an electric fielde. This gives the result:
where is the twist elastic coefficient. We can see that Equations (2) and (4) are identical provided that
or when the tilt angle is small so that
.
The flexoelastic ratio presented in Equation (2), which is the form most commonly employed and is determined using an unconstrained pitch model, may not be suitable for characterising devices that exhibit large tilt angles (where Equations (2) and (4) can significantly diverge) [Citation10,Citation16]. We can see this clearly if we consider the case when the tilt angle, Ø, of the optic axis is 45°, in which case Equation (2) can then be re-written to give the flexoelastic ratio as:
Incidentally, Equation (5) shows that determining the electric field amplitude at which the tilt angle is Ø = 45° directly yields the flexoelastic ratio, provided that the pitch of the chiral nematic LC is known. Alternatively, Equation (4) under the same conditions (i.e. Ø = 45°), instead becomes:
In this case, we can see that the flexoelastic ratio is rather different to the conventional form that is employed (Equation (5)) and is, instead, given by . It is considered that this flexoelastic ratio, obtained from (4), is more appropriate for characterizing and optimizing materials that exhibit large tilt angles in devices for which the helical pitch is constrained. Comparing the two flexoelastic ratios, again we see that they are identical provided that
. However, for the same flexoelectric coefficients, the two ratios can differ substantially if the sum
is different from
.
Simulations of the tilt angle
In order to investigate the behaviour further, we now consider the response of a flexoelectro-optic device to an applied electric field in the form of a square-wave when operated in the ULH configuration between crossed polarizers. The induced flexoelectric tilt angle can be studied through simulations [Citation21], and exemplar results are shown in ) for the case where the values of the elastic coefficients, ,
,
, are the same as those of the well-studied nematic LC mixture, E7, at a temperature of 20°C [Citation22]. The figure shows three separate plots for values of
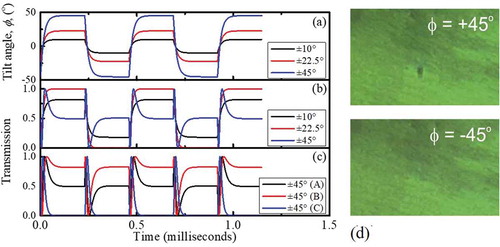
that have been adjusted to give tilt angles of Ø = ± 10°, ± 22.5° and ± 45°. The corresponding optical transmissions are shown in ), where the flexoelectro-optic LC device is placed between crossed polarizers such that the helix axis is at 22.5° to the input polarisation, and the maximum transmission is normalised to unity. In ), we can see that the flexoelectro-optic tilt angle results in a change in the transmission around an equilibrium level of T = 0.5. It can also be seen that when the electric field amplitude is sufficient to induce a tilt of the optic axis of Ø = ± 45°, the transmissions for the two switched states are identical to one another and approach the same value of T = 0.5.
Figure 1. (Colour online) (a) Simulations of the tilt angle of the optic axis as a function of time for values of set to give tilt angles, Ø, of ± 10°, ± 22.5° and ± 45°. The values of the elastic coefficients that were used in the simulation were
,
, and
. (b) Normalised transmission of the flexoelectro-optic device between crossed polarizers as a function of time with the helix axis aligned at 22.5° to the input polarisation. (c) Normalised transmission plots as a function of time for the case when the tilt angle is Ø = ± 45° for three arbitrary orientations (denoted (A), (B), and (C) in the figure legend) of the mean optic axis in the plane of the device.
) shows transmission plots for flexoelectro-optic switching when Ø = ± 45° and when the device is aligned such that the helical axis is at three different, arbitrary orientations in the plane of the device. In each case, it is shown that for the Ø = ± 45° switched states they approach the same transmission level after some initial response. We can also see from ,c) that when the tilt angle is at Ø = ± 45°, the transmission levels corresponding to these states will always tend to the same value irrespective of the orientation of the helical axis with respect to the input polarisation.
The equivalence in the transmission plots for the case when Ø = ± 45° as seen in the simulations presented in is interesting to investigate experimentally. For a flexoelectro-optic device aligned in the ULH configuration, adjusting the amplitude of an applied electric field (square wave) until the transmission of the device for the positive and negative polarities are the same, allows for the direct determination of the amplitude required for a tilt angle of Ø = ± 45°. This observation does not require: (1) any knowledge of the precise orientation of the helix axis; (2) any prior knowledge of the birefringence of the device under study; and (3) the measured transmission does not need to be normalised. Provided that the pitch of the helix is known, observation of the point at which the transmissions for positive and negative polarity electric fields are equal leads to the direct determination of the combination of coefficients in Equation (6), which is the more appropriate flexoelastic ratio for large switching angle materials.
Experimental results and discussion
For an experimental demonstration, an LC mixture was prepared to consist of the dimer (bimesogen) 4ʹ,4”-(Heptane-1,7-diyl)dibiphenyl-4-carbonitrile (CBC7CB) [Citation23] with a low concentration (~ 3 wt%) of a high twisting power chiral dopant (R5011, Merck). This mixture was capillary filled into a 5 μm-thick cell with antiparallel rubbed polyimide alignment layers and indium tin oxide electrodes coated onto the inner surfaces of each substrate. The mixture was found to exhibit a chiral nematic phase upon cooling from the isotropic liquid phase and assumed a Grandjean texture due to boundary conditions imposed by the glass cell. The pitch for this mixture was found to be approximately 245 nm at 108°C, which was estimated by measuring the optical rotary power using a polarising optical microscope in combination with the expression for the rotary power provided in Ref. [Citation24] and the values of the refractive indices obtained from Ref. [Citation25]. The device was then cooled from the isotropic phase to the chiral nematic phase in the presence of a 1 kHz square wave electric field of amplitude ± 6 Vμm−1. A small shear-flow was also induced within the device to promote the formation of the ULH configuration. All subsequent experiments were performed at a temperature of 108°C in the chiral nematic phase.
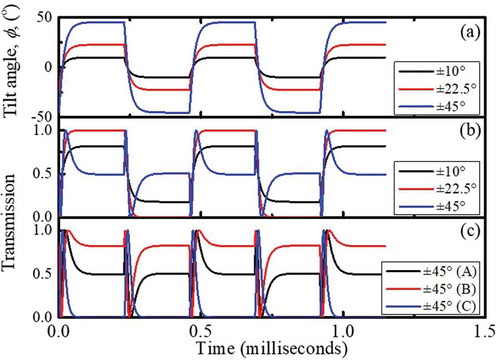
) shows the transmission of light as a function of time for the LC device placed between the crossed polarizers of an optical polarising microscope with the helical axis oriented at 22.5° with respect to the polarizer axis. The applied signal was a square wave with frequency 1 kHz and the amplitudes required were found to be E = ± 1.3 Vμm−1, ± 3.1 Vμm−1 and ± 6.12 Vμm−1 to give tilt angles of approximately ± 10°, ± 22.5° and ± 45°, respectively. Some relaxation in the tilt angle over the duration of one polarity of the applied electric field is noticeable, especially for the case of the Ø = ± 45°. It is believed that this behaviour is due to the presence of ions in the LC material. The relaxation behaviour seen in ) was not reproduced in the model used to obtain the theoretical results shown in . However, if a voltage-dependent decay term is added to the internal electric field to represent the effect of the movement and internal field-screening effect of the ions within the LC device, it is then possible to model more realistically the experimental results, as shown in ). The parameters used here have been adjusted to ensure that the model better represents the experimental situation.
Figure 2. (Colour online) (a) Experimental results of the normalised transmission of white light through the flexoelectro-optic device between crossed polarizers as a function of time for flexoelectro-optic tilt angles, Ø, of approximately ± 10°, ± 22.5° and ± 45°. Results are presented for a chiral nematic mixture consisting of CBC7CB and 3 wt% chiral dopant (R5011, Merck) in a 5 μm-thick planar-aligned device. (b) Simulation results for the transmission as a function of time for tilt angles of approximately Ø = ± 10°, ± 22.5° and ± 45° with the inclusion of a voltage-dependent decay term that has been added to the internal electric field. (c) Experimental results of the normalised transmission of white light for the CBC7CB+ 3 wt% R5011 flexoelectro-optic device as a function of time for the Ø = ± 45° switched states for a range of orientations of the helical axis (mean optic axis).
Even though the relaxation in the tilt angle caused by the ionic content inevitably influences the resulting flexoelectro-optic behaviour, the Ø = ± 45° switching point is still apparent in in both the experimental and the theoretical results. The expected equivalence in the transmission levels for the Ø = ± 45° switched states for all orientations of the helical axis (shown in the model in )) can also be investigated experimentally. ) shows the transmission data obtained for a range of device orientations. It is evident that in each case, the response to the positive and negative electric field polarities are equivalent, as expected. This point is relatively easy and convenient to identify as it does not require any calibration/normalisation of the transmission measurement, as explained previously, and does not require precise knowledge of the device orientation. For the device used here, this point was found to occur at an applied voltage of ± 30.7V, which corresponds to an electric field strength of E = ± 6.12Vμm−1.
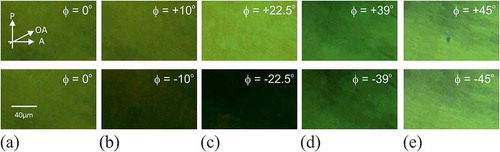
The behaviour observed in ) is also illustrated in the sequence of optical polarising microscope images for the responses to the positive and negative electric field polarities as the amplitude is increased. These results are shown in , where the device is oriented with the helical axis at 22.5° to the polarizer axis and the images were obtained stroboscopically, with the illumination synchronised to either the positive or negative switching voltage. The sequence starts from the un-switched (0V) state and is followed by pairs of images for the responses to both positive and negative voltage polarities for a range of tilt angles. For the un-switched (0V) state, there is no difference in the pair of images as no electric field is applied to the sample. As the voltage is increased, differences between the positive and negative switched states appear and the contrast between the images increases with the field amplitude. The contrast between images was determined by extracting a measure of the ‘brightness’ of the bright image divided by that for the dark image, where the brightness of each image was calculated using MATLAB. Since the light leakage through the cross-polarizer arrangement in the absence of the LC device was not measured, the actual contrast ratio might be larger than the value obtained using this method. Nevertheless, the approach employed here provides a good indication of the trend in terms of the change in the optical contrast. As the tilt angle of the optic axis increases, the contrast becomes largest when Ø = ± 22.5° ()). However, a further increase in the field amplitude, and consequently the tilt angle, results in a decrease in the contrast between the pairs of images ()). At the point where the electric field amplitude is such that the tilt angle reaches Ø = ± 45°, the contrast between the images for positive and negative polarity electric fields vanishes and the two images are almost the same ()). This is exactly as expected from the transmission data presented in ), because the transmission through the positive and negative switched states are equivalent to one another when Ø = ± 45°.
Figure 3. (Colour online) Microscope images for the positive and negative electric field polarities for (a) the unswitched (0V) state, and with tilt angles of (approximately) (b) ± 10°, (c) ± 22.5° degrees, (d) ± 39°, and (e) ± 45°. The changes in brightness are caused by the different electric field amplitudes and quantified by the optical contrast (OC) ((a) 1:1, (b) 2.71:1, (c) 5.77:1, (d) 2.05:1 and (e) 1.18:1). P, A and OA represent the orientations of the transmission axes of the polarizer, analyser and the helix axis, respectively.
Using Equation (6) in combination with the pitch and the value of the electric field amplitude required to obtain a tilt angle of Ø = ± 45°, the alternative (constrained-pitch) flexoelastic ratio is then found to be,
This value for the ratio can be compared to the result obtained for small tilt angles, where a tilt angle of Ø = ± 10° is observed at an applied voltage of ± 6.5 V (equivalent to an electric field strength of E = ± 1.3Vμm−1), leading to a value for the more commonly-applied, unconstrained-pitch flexoelastic ratio (Equation (2)) of
This is comparable to the previously reported value of 3.67 V−1 for a chiral nematic mixture consisting of the same nematic host, CBC7CB [Citation16]. As demonstrated, the pitch-constrained flexoelastic ratio that is given by Equation (6), with a value quoted here of 4.15 V−1, is a more useful measure of the flexoelectro-optic capabilities of a large tilt-angle mixture and that the conventional flexoelastic ratio described by Equation (2) is only suitable for describing small tilt angle flexoelectro-optic switching when the pitch is free to change.
Conclusions
In summary, we propose that the flexoelastic ratio, given by the combination of coefficients in Equation (6), is a more appropriate expression for the characterization of liquid crystalline devices that exhibit a large tilt-angle of the optical axis in flexoelectro-optic switching. Moreover, we have proposed a simple method for determining this ratio by simply recording the electric field amplitude at the point whereby the transmission properties become equivalent allowing for a rapid and precise measure of the flexoelectro-optic performance of chiral nematic LC devices.
Acknowledgments
The authors gratefully acknowledge the financial support from the Engineering and Physical Sciences Research Council (UK) through the project EP/M017923/1.
Disclosure statement
No potential conflict of interest was reported by the authors.
Additional information
Funding
Related Research Data
References
- Meyer RB. Piezoelectric effects in liquid crystals. Phys Rev Lett. 1969;22:918–921.
- Buka A, Eber M. Flexoelectricity in liquid crystals. Singapore: World Scientific; 2013.
- Patel JS, Meyer RB. Flexoelectric electro-optics of a cholesteric liquid crystal. Phys Rev Lett. 1987;58:1538–1540.
- Patel JS, Lee SD. Fast linear electro‐optic effect based on cholesteric liquid crystals. J Appl Phys. 1989;66:1879–1881.
- Lee SD, Patel JS, Meyer RB. Effect of flexoelectric coupling on helix distortions in cholesteric liquid crystals. J Appl Phys. 1990;67:1293–1297.
- Rudquist P, Buivydas M, Komitov L, et al. Linear electro‐optic effect based on flexoelectricity in a cholesteric with sign change of dielectric anisotropy. J Appl Phys. 1994;76:7778–7783.
- Rudquist P, Komitov L, Lagerwall S. Linear electro-optic effect in a cholesteric liquid crystal. Phys Rev E. 1994;50:4735–4743.
- Rudquist P, Carlsson T, Komitov L, et al. The flexoelectro-optic effect in cholesterics. Liq Crys. 1997;22:445–449.
- Rudquist P, Komitov L, Lagerwall S. Volume-stabilized ULH structure for the flexoelectro-optic effect and the phase-shift effect in cholesterics. Liq Crys. 1998;24:329–334.
- Coles HJ, Clarke MJ, Morris SM, et al. Strong flexoelectric behavior in bimesogenic liquid crystals. J Appl Phys. 2006;99:034104.
- Broughton BJ, Clarke MJ, Morris SM, et al. Effect of polymer concentration on stabilized large-tilt-angle flexoelectro-optic switching. J Appl Phys. 2006;99:023511.
- Morris SM, Clarke MJ, Blatch AE, et al. Structure-flexoelastic properties of bimesogenic liquid crystals. Phys Rev E. 2007;75:041701.
- Morris SM, Cho YI, Pivnenko MN, et al. The influence of fluorosurfactants on the flexoelectro-optic properties of a chiral nematic liquid crystal. J Appl Phys. 2007;101:114109.
- Atkinson KL, Morris SM, Castles F, et al. Flexoelectric and elastic coefficients of odd and even homologous bimesogens. Phys Rev E. 2012;85:012701.
- Atkinson KL, Morris SM, Qasim MM, et al. Increasing the flexoelastic ratio of liquid crystals using highly fluorinated ester-linked bimesogens. Phys Chem Chem Phys. 2012;14:16377–16385.
- Varanytsia A, Chien LC. Giant flexoelectro-optic effect with liquid crystal dimer CB7CB. Sci Rep. 2017;7:41333.
- Varanytsia A,K, Kim J, Hwang J-L, et al. Fast Flexoelectro?Optic Liquid Crystal Device Operating at Room Temperature. SID international symposium. 2015;46:1567.
- Outram BI, Elston SJ. Spontaneous and stable uniform lying helix liquid-crystal alignment. J Appl Phys. 2013;113:043103.
- Park KS, Baek JH, Lee YH, et al. Effects of pretilt angle and anchoring energy on alignment of uniformly lying helix mode. Liq Crys. 2016;43:1184–1189.
- Varanytsia A, Chien LC. Bimesogen-enhanced flexoelectro-optic behavior of polymer stabilized cholesteric liquid crystal. J Appl Phys. 2016;119:014502.
- Corbett DR, Elston SJ. Modeling the helical flexoelectro-optic effect. Phys Rev E. 2011;84:041706.
- Chen H, Zhu R, Zhu J, et al. A simple method to measure the twist elastic constant of a nematic liquid crystal. Liq Crys. 2015;42:1738–1742.
- Cestari M, Diez-Berart S, Dunmur DA, et al. Phase behavior and properties of the liquid-crystal dimer 1′′,7′′-bis(4-cyanobiphenyl-4′-yl) heptane: A twist-bend nematic liquid crystal. Phys Rev E. 2011;84(3):031704.
- de Vries H. Rotatory power and other optical properties of certain liquid crystals. Acta Crystallogr. 1951;4:219–226.
- Babakahnova G, Parsouzi Z, Paladugu S, et al. Elastic and viscous properties of the nematic dimer CB7CB. Phys Rev E. 2017;96:062704.