
 ?Mathematical formulae have been encoded as MathML and are displayed in this HTML version using MathJax in order to improve their display. Uncheck the box to turn MathJax off. This feature requires Javascript. Click on a formula to zoom.
ABSTRACT
This review outlines the recent theoretical and computational developments for the prediction of motional electron paramagnetic resonance spectra with introduced spin probes from molecular dynamics simulations. The methodology is illustrated with applications to thermotropic and lyotropic liquid crystals at different phases and aggregate states.
Graphical Abstract
Introduction
Electron paramagnetic resonance (EPR) spectroscopy with paramagnetic spin probes offers several advantages in the studies of soft matter systems such as liquid crystals (LCs). First, because of high sensitivity of EPR, only a small amount of introduced spin probes is required (typically 1–2 mol %), making it generally a non-invasive technique. Second, EPR signals vary strongly with the orientation of the spin probe relative to the external magnetic field, making it an ideal technique to study the motions and orientations of the host LC mesogens on different temporal and spatial scales. Application of continuous-wave (CW) EPR with spin probes to LCs has been pioneered in the group of Professor Geoffrey Luckhurst from the University of Southampton with the prominent contributions by Professor Claudio Zannoni who was the group member at the time. Their early papers established theoretical foundations for the analysis of the angular variation of EPR line shapes and spin relaxation of spin probes in anisotropic environments with applications to radical, biradical and triradical spin probes in LCs [Citation1–Citation3]. Later at the University of Bologna, Claudio continued to unravel the potential of EPR spectroscopy in LC research alongside other spectroscopic techniques. Claudio’s theoretical interests and mathematical vigour in the use of 3D rotation group theory and the associated algebra of rotational operators for the analysis of EPR made these and his proceeding papers an instrumental and inspiring tool for later developments in the field by other researchers. Over the years, Claudio Zannoni’s group has produced eminent contributions to the study of various LC phenomena by EPR. Examples of applications include the study of poly-liquid crystalline states [Citation4], determination of the helix pitch and handedness of induced cholesteric mesophases, including the ones induced by a chiral probe [Citation5,Citation6], analysis of the effects of dispersed hydrophobic aerosol particles and solutes such as azobenzene on the order and dynamics of nematic LCs [Citation7,Citation8] and determination of director configuration in the twist-bend nematic phase [Citation9] as well as applications to lyotropic LCs [Citation10,Citation11].
(a) shows two nitroxide spin probes commonly used in LC studies, namely 3-DOXYL-5-cholestane (CSL) and 5-DOXYL stearic acid (5DSA) alongside two nematic 4-cyano-4-n-pentylbiphenyl (nCB) LC mesogens. In the probes, the unpaired electron is largely localised within the π-orbital of the N-O bond. The states of the system are described by the following spin Hamiltonian (SH) [Citation12]:
Figure 1. (Colour online) (a) Structures of 5CB and 8CB LC molecules and CLS and 5DSA nitroxide spin probes employed in the studies of nematic LCs. Magnetic axes of the nitroxide head group of the probes are shown. (b) Schematic representation of the three EPR hyperfine coupling resonance lines in the absence of motions with the orientations of the nitroxide moiety corresponding to different resonance positions. (c) and (d) Illustrate the sensitivity of X-band EPR line shapes to the motions and orientational constraints of the nitroxide spin probe for isotropic rotation with different correlation times and anisotropic rotations along different magnetic axes, respectively.
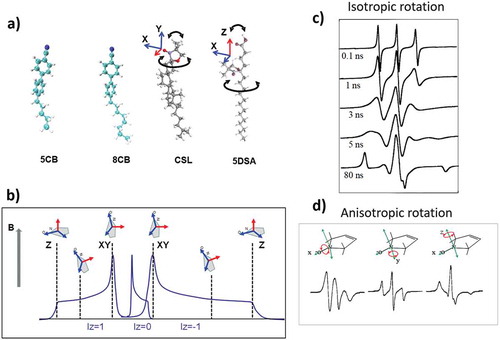
where g and A are the magnetic tensors, with g defining the interaction of the spin (S = 1/2) with the external magnetic field (B) and A the hyperfine coupling to the single 14N nuclear spin I = 1, respectively (β is the Bohr’s magneton). Both tensors are anisotropic, leading to a strong dependence of the EPR resonances on the direction of magnetic field relative to the principle magnetic axes of the probe. (b) shows schematically the distribution of the resonance positions for different orientations of the nitroxide plane relative to the external magnetic field. As a result, the EPR line shapes are highly sensitive to both the dynamics and orientation of the probe (see examples with simple rotational motions in ). Note that in EPR measurements, the first derivative of microwave absorption is reordered.
An important feature of EPR is that it is a ‘fast’ spectroscopy able to resolve the details of molecular re-orientational dynamics over time scales between 10−11 and 10−7 s [Citation13]. CW EPR at X-band frequency (9.5 GHz) is particularly sensitive to the nanosecond molecular motions that are characteristic to a wide range of LC systems. The lines are sensitive to both local dynamics and the order of the probe, and their shapes can range from completely motionally averaged three sharp lines in the case of fast isotropic motion to broad asymmetric features in the case of the ‘frozen’ limit ((c))). As such, when spin probes are doped inside LCs, the following pieces of information can be extracted from the analysis of EPR line shapes: (i) rotational diffusion of the probe, (ii) motional restrictions imposed on the probe by the surrounding host mesogens and (iii) global order imposed by the LC state.
Although motional EPR spectra of LCs are potentially highly informative, they require careful analysis in order to extract reliably the information about molecular motions and local order as well as director distribution. A typical strategy is the fitting of EPR line shapes using a model of a rigid rod undergoing a stochastic rotation in the asymmetric restricted environment combined with a stochastic Liouville equation (SLE)-based EPR simulation approach pioneered by Freed and co-workers [Citation14–Citation17]. Although being a highly successful approach, the requirement of using multiple adjustable parameters in many cases prevents it from reaching a unique fitting and unambiguous interpretations of the results. With the recent advances in computer power and the increasing accuracy of molecular dynamics (MD) simulations, it becomes certainly desirable to be able to predict EPR spectra directly and completely from MD simulations of actual structures of LC aggregates. This review outlines the most recent theoretical developments and application of the our EPR simulation methodology to different types of LCs.
MD-EPR simulation methodology
Trajectory-based approach using Liouville von Neumann equation
The trajectory-based approach employed for EPR simulations employs the Liouville von Neumann equation in the semi-classical approximation, often called the Langevin form of the SLE [Citation12,Citation18]. In this approach, the SLE is transformed into a system of coupled stochastic differential equations with explicit time dependence of the Liouvillian:
Here ρ is a spin density matrix whose evolution in time is described by Equation (2) and is a superoperator of the interaction Hamiltonian (1), expressed in the units of ℏ, defined by its action on the density matrix ρ as:
. In the case of the nitroxide spin label of the electron spin coupled to a nuclear spin of 14N, the SLE in the Langevin form is reduced to a system of nine coupled differential equations. The form (2) requires an explicit computational model for the stochastic process to define the time propagation of the spin density matrix. This is achieved by the use of stochastic dynamical trajectories (DT) required for the explicit time variation of
A DT can be generated by different means and level of modelling. For instance, using an appropriate Langevin dynamical equation [19,Citation20] applied to a rigid rod undergoing rotational tumbling in an ordering potential, a Brownian dynamics (BD) trajectories can be generated. From direct integration of the Langevin equation, the stochastic trajectory of the orientations of the magnetic axes of the probe defined by three Euler angles
is obtained and employed in Equation (2). Alternatively, DTs can be generated from MD simulations of actual molecular structures at either fully atomistic (FA) or coarse-grained (CG) levels. Once propagation of the spin density matrix is completed, EPR line shapes are obtained by applying a Fourier-Laplace transform to the time-dependent averaged transverse magnetisation into the frequency of field domain according to the following equation:
In Equation (3), and Tr is the trace of the matrix product. Equation (2) for the propagation of spin density matrix has the following formal solution:
where angle brackets indicate the ensemble average and is the density matrix at the thermal equilibrium. For an appropriately short discrete time step
, the propagation is achieved numerically and recursively using the following approximation:
In Hilbert space, Equation (5) is equivalent to the following unitary transformation of the density matrix occurring during time interval:
According to the properties of the Laplace-Fourier transform for an accurate spectral simulation, the following two conditions, known as Nyquist criteria, should be satisfied: and
, where
and
are resolutions in the frequency and time domains, respectively.
is the width of the entire spectrum in the frequency domain and T is the total propagation (sampling) time. To achieve a reasonable resolution of, say,
~0.1 Gauss (0.28 MHz between frequency points) after Fourier transformation, a trajectory should be T >3 μs [Citation21]. On the other hand, the second condition of the Fourier transformation imposes the limit on the discrete propagation time step
used in Equation (5), namely,
. The need for the application of relatively short incremental times and numerical calculation of matrix exponential in Equations (5–6) represents a significant computational challenge for a numerical propagation of the density matrix when the propagation is carried out for the entire sampling time T and when a large number of trajectories are required for statistical averaging of Equation (4). Generally, for relatively small intervals, the matrix exponential can be estimated by either the use of Chebyshev polynomial expansion [Citation22] or decomposing stochastic Liouvillian into a finite sum of matrices followed by the application of a symmetrised version of Trotter’s formula [Citation23]. Such methods, however, are prompt to accumulated numerical errors, particularly for long propagations. An alternative to numerical propagation of the full Liouvillian is to employ simplified forms of the SH (1) where certain terms (mainly non-secular) are neglected allowing analytical solutions. Several reports have utilised approximations to the SH (1), taking into account that the hyperfine coupling of the electron with the nuclear spin is much smaller compared to its interaction with the magnetic field [Citation19,Citation24,Citation25]. The electron spin is, therefore, mainly quantitised along the z axis, whereas the x- and y-contributions of
can be neglected (so-called intermediate field [IF] treatment). The Hamiltonian is then given by:
For each orientation , the appropriate elements of the g- and A-tensors are determined from:
where gd and Ad are the tensors diagonalised in the frame of the nitroxide and is the Euler matrix for the rotation from the nitroxide to laboratory frame [Citation26]. According to Steinhoff and Hubbell under this approximation, the Liouvillian in Equation (2) can be effectively presented in a diagonal form, leading to three uncoupled hyperfine coupling lines [Citation19]:
As shown in [Citation19] in the slow motional limit, Equation (9) takes into account for the effects of pseudo-secular terms by introducing additional correlation function into the expression for the eigenvalues in ad hoc manner. The transverse magnetisation is then just a sum of three independent scalar contributions:
In Equation (10), the term i\bar \omega t comes from rotation invariant contributions to the SH (7) [Citation21,Citation27]. This approach speeds up the propagation of the density matrix employed in the EPR simulation programmes. Another approach is to use explicit analytical expressions for both the eigenvalues and eigenvectors of the SH (7) [Citation24]. In such a case, analytical propagation is achieved by using:
where and
are the matrix of the eigenvector columns and diagonal matrix of the eigenvalues, respectively, of SH (7) for orientations
. Although the IF approximation does not include terms
that contribute to T1 relaxation effects, overall the simulation results confirm that in most cases it is an adequate approach for the simulation of CW EPR spectra of nitroxide spin probes at X-band and higher frequencies. In MD-EPR simulation methodology, the EPR spectral line shapes of nitroxide spin probes are determined entirely by the variation with time of the angles that define the orientation of the applied magnetic field to the principal axis of the nitroxide group. Therefore, the orientational history of the magnetic axes in the fixed frame of the MD simulation box is calculated and processed. The z axis of the nitroxide ring (coincident with the direction of the pz-orbital of N) is calculated from the cross-product of the unit vectors of two N-C bonds of the ring (see (a)). The x axis is calculated as a projection vector of the N-O bond on the nitroxide plane (defined by the C-N-C atoms) and the y axis is taken as a cross-product of the z and x vectors [Citation24,Citation27].
Simulation of EPR spectra completely from truncated MD trajectories
In many cases, the rotational dynamics associated with nitroxide spin labels and probes falls within the 0.1–100 ns interval. Also, EPR line shapes of a widely used X-band are not sensitive to a slower dynamics. This timescale, however, is much shorter compared to the sampling time of T >3 μs required to the propagation of the density matrix in EPR spectral simulations. Oganesyan has shown [Citation27,Citation28] that, in fact, the propagation of the density matrix along the entire sampling time T is not strictly necessary, and an accurate simulation can be achieved from a truncated MD trajectory until the point when the autocorrelation function of the re-orientational motion of a spin probe has completely relaxed. The evolution of the spin density matrix for the remaining working length can then be predicted from the truncated trajectory [Citation27,Citation28]. The reported simulation method employs the following: (i) the propagation of the spin density matrix in the Liouville space for this initial time interval (, where τ is the effective correlation time for the re-orientational motion of the spin probe) is carried out numerically according to Equations (5–6); (ii) after the autocorrelation function of the spin probe motions has completely relaxed, the rest of the magnetisation trajectory (
) for the sampling time is calculated using well-defined parameters (see for details [Citation12,Citation27,Citation28]). For example, when the calculation of transverse magnetisation based on Equation (10) is justifiable, calculation of only two parameters for each of the three hyperfine coupling lines, namely
and
, is required. Here,
are three autocorrelation functions of
. The de-phasing of magnetisations is caused by the modulation of
due to the re-orientational dynamics of the spin probe. The rest of the evolution of the transverse magnetisation curve can be calculated with high accuracy using the following Equation (12) [Citation27]:
The autocorrelation functions can be readily used to provide an estimate of the initial propagation time. This methodology is applicable to DTs of any kind (e.g. generated from either BD or MD calculations). The simulation approach does not require numerical propagation of the spin density matrix for the significant part of the sampling time T and thus relies on relatively short single DTs. This offers two major advantages. First, this substantially reduces the amount of computational time for the simulation of EPR spectra. Second, the method relies on the EPR simulation from relatively short DT trajectories over timescales that are within the reach of current MD computational methods [Citation27,Citation28]. This approach has paved the way for the first-time prediction of motional EPR spectra directly and completely from MD trajectories of actual molecular structures. It has been successfully applied to proteins [Citation29,Citation30], DNA [Citation31], lipid bilayers [Citation32] and also LCs [Citation33–Citation35]. A computer code developed by the author [Citation27,Citation28], which includes both options, namely the propagation of the trajectories along the entire sampling time and the use of truncated trajectories combined with autocorrelation function method, has been employed for the simulation of EPR spectra of LC systems reported in this review.
Simulation of EPR spectra indirectly from MD trajectories using SLE in the Fokker-Planck (F-P) form
An alternative approach for the calculation of EPR spectra from the outputs of MD simulations is to solve the SLE in the F-P form using parameters for diffusional tensor and ordering potential extracted from MD outputs [Citation12,Citation36–Citation38]. The application of the SLE in the F-P form has been originally developed by Kubo in the early 1960s [Citation39] and adapted for the simulation EPR spectra by Freed and co-workers using fitting routines with adjustable parameters [Citation14,Citation16,Citation17,Citation40]. SLE in the F-P employs the stochastic generalised diffusional operator describing stochastic motion of the probe:
Equation (13) describes the time evolution of the density matrix, , in the spin-space basis [Citation14,Citation39–Citation41]. The Quantum Mechanical (QM) part of Equation (13) is represented by the Liouville superoperator
of the system which does not depend explicitly on time in the F-P formulation. The space states of the system are defined by stochastic rotational coordinates,
, that evolve in space under the action of
. The stochastic diffusive operator can be presented in the following form [Citation26,Citation42]:
which is expressed in terms of a diffusion tensor D and , the orientational equilibrium distribution.
is the angular momentum operator with the components defined in the molecular frame. For instance, in the case of a single rotational diffusion,
reduces to the following well-known form
, where
are the principle values of the rotational diffusion tensor describing this motion and
are the components of
.
in Equation (14) is predetermined by the probe’s ordering potentials [Citation42]. In many cases of LCs, the restriction of the motion can be well approximated by the axially symmetric potential in the Maier–Saupe form, namely:
with representing the azimuthal angle of the potential. The strength of the potential
is directly related to the order parameter S of the spin probe [Citation43]. EPR spectrum is then obtained by Fourier-Laplace transform of the SLE F-P equation:
where and
are the sweep and Larmour frequencies, respectively,
defines the QM spin transition states in the Liouville space [Citation15,Citation17,Citation42] and angular brackets represent the ensemble average over the classical degrees of freedom which in our case are the Euler angles
. As have been recently shown by Prior and Oganesyan [Citation38], the parameters describing rotational diffusion motion of the spin probe in LCs can be readily extracted from MD trajectories using the Model-Free (MF) approach of Lipari and Szabo [Citation44]. A detailed analysis has been reported to different aggregate states of lyotropic LCs sodium dodecyl sulphate (SDS) and dodecyltrimethylammonium chloride (DTAC) [Citation38]. In addition, it has been demonstrated that the simulation of motional EPR line shapes can be considerably simplified if the fast internal motion of the probe falls within fast motional regime with correlation times below 1 ns. In such cases, the effects of fast local motions can be accounted for prior to solving the SLE by partial averaging of the magnetic parameters A and g in the local frame. Then, the solution of the SLE equation requires only the motional parameters describing the global dynamics of the molecular system.
Calculation of magnetic tensors g and A
In the last decade, accurate Density Functional Theory (DFT) methods for the calculation of the principle values and directions of both A and g tensors have been developed. Among them, DFT calculations with the N07D [Citation45,Citation46] basis set developed by Barone and co-workers, as implemented in the Gaussian 09 software package, are particularly popular choice[Citation47]. Structures are normally first optimised in the gas phase followed by further optimisation in water using implicit continuum solvent schemes. Calculation of magnetic parameters from first principles makes the entire MD-EPR simulation protocol fully predictive.
Experimental measurements
All experimental EPR spectra reported in this review were measured using an X-band Bruker EMX spectrometer equipped with the digital temperature control system (ER4131VT) for high-temperature measurements using a heated flow of nitrogen gas. For each temperature, samples were equilibrated for several minutes before taking the measurement. The following conditions were used: microwave frequency of 9.55 GHz; microwave power of 2 mW; modulation frequency of 100 kHz; and modulation amplitude of 1.0 G.
Application to LC systems
Thermotropic nematic LCs
Our MD-EPR simulation methodology has been applied for the first time to 5CB LC system doped with CSL probe using truncated MD trajectories with autocorrelation function-based method (Equations 5–6 and 12) [Citation33]. A hybrid MD simulation model was used where the spin probe was represented at FA level and the host LCs molecules were treated at a CG level. Simulations of EPR spectra were performed directly and entirely from generated MD trajectories and were found in excellent agreement with the experimental spectra, showing strong sensitivity to both the local order parameter of the probe and director distribution.
The first prediction of EPR spectra for a nematic LC with a doped spin probe from MD simulations at the FA level has been reported in [Citation35]. MD simulations were performed on a system of 5CB consisting of c.a. 140 randomly arranged (head to tail) molecules in a cubic box of 4.5 nm dimensions with cubic periodic boundary conditions.
The EPR predictions and analysis focused particularly on the LC states along the nematic–isotropic (N-I) phase transition region and tested against the measured EPR spectra.
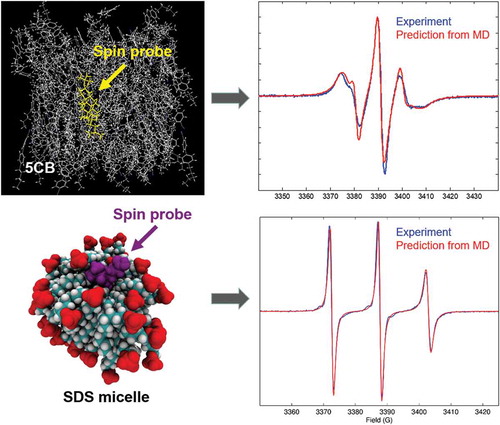
MD simulations were carried out using GROMACS suite [Citation48] with Optimized Potentials for Liquid Simulations - All atom (OPLS-AA) force field. Force field parameters for the spin probe have been developed using a combination of the OPLSS-AA force field and density functional theory calculations at the B3LYP/6-31G** level using Gaussian 03 software [Citation47]. For each temperature, the system, initially composed of 5CB molecules, was equilibrated for 50 ns followed by the doping of the probe at the central position of the box. The system was further equilibrated for another 30 ns followed by production runs of ~100 ns for EPR simulations. EPR spectra were simulated from MD using a direct propagation method combined with autocorrelation function approach. The simulation snapshot of the 5CB with doped CSL is shown in the right top corner of . As mentioned above, at X-band, the sensitivity of EPR line shape is predetermined mainly by the anisotropy of hyperfine coupling of 14N with strong dependence of the resonances on the orientation of magnetic field relative to the principle axes of the hyperfine coupling tensor. In EPR experiment, the magnetic field is set along the orientation of the director of 5CB. ) shows the comparison between predicted and experimental EPR spectra for a pure nematic (N) phase. It is characterised by three closely positioned narrow lines. In the N phase, the magnetic field on average is lying in the plane of nitroxide ring. For such orientations of the field, the distance between the outer resonance field positions is approaching 2Axx/yy. In addition, the axial director distribution around the direction of magnetic field in this state was only ~15° consistent with the observed narrow shapes of the lines. Upon increasing the temperature, the system gradually becomes less ordered with the distances between the hyperfine lines increasing and the shapes broadening (see comparison between predicted and experimental spectra in (b)). Drastic changes of the shape of EPR spectrum were observed at the phase transition () indicating increasing contributions to the resonance field positions from off-plane orientations of the magnetic field. EPR measurements have shown that this characteristic shape maintains only for a very narrow temperature interval (∆T = 1 K). An associated MD trajectory is shown in the bottom left corner of as a red line. One can see that at the start of the MD run, the system is partially ordered with the order parameter SLC ~0.6. At approximate time, t = 15 ns, the system clears to the isotropic state with an order parameter, SLC ~0.15, and at t = 70 ns, a nematic phase is re-grown. Thus, the system is meta-stable and is characterised by a slow dynamical exchange between two distinct phases I and II highlighted in ). This observation was in full agreement with the bi-modal distribution of instantaneous values of the order parameter P2 calculated for a range of nCB (n = 5–8) LCs as reported by Zannoni and co-workers [Citation49]. This dynamical exchange process of approximately two events per 100 ns is, however, too slow on the EPR timescale, resulting in the total EPR spectra being a superposition of the line shapes associated with the partially ordered (I) and disordered (II) meta-states. An excellent agreement with the experimental spectrum at the critical point confirms a relatively slow exchange rate between the meta-states. The fluctuations between partially ordered and disordered states can be rationalised based on the use of Isothermal–isobaric (NPT) ensemble employed in MD simulations. NPT represent the state variables of the Gibbs’s free energy whose variation is determined by both the heat exchange () and the entropy change (
) according to:
Figure 2. (Colour online) Subplots a)–e) show comparison between simulated (solid lines) and measured (dash-dotted lines) EPR spectra at different temperatures. In a)-d) T-TNI values are indicated in each subplot. Top right corner: Atomistic snapshot of 5CB with the doped CSL spin probe (yellow) positioned in the middle of the simulation box. Bottom left corner: time evolution of the LC order parameter at simulation temperatures T = 380K (blue line) and 385 K (red line). Experimental and simulated spectra are reproduced from [Citation35] with permission from WILEY.
![Figure 2. (Colour online) Subplots a)–e) show comparison between simulated (solid lines) and measured (dash-dotted lines) EPR spectra at different temperatures. In a)-d) T-TNI values are indicated in each subplot. Top right corner: Atomistic snapshot of 5CB with the doped CSL spin probe (yellow) positioned in the middle of the simulation box. Bottom left corner: time evolution of the LC order parameter at simulation temperatures T = 380K (blue line) and 385 K (red line). Experimental and simulated spectra are reproduced from [Citation35] with permission from WILEY.](/cms/asset/a4fe68bb-b5bb-4f85-a515-6c22fbe9936c/tlct_a_1508767_f0002_oc.jpg)
Under the equilibrium condition , the absorption of the heat from the surrounding LC domains leads to the increase of the entropy, while the loss of heat leads to the decrease of the entropy. Decreases and increases in the entropy are associated with the changes in the order parameter clearly seen in . For each LC domain, the frequency of such an exchange would depend on its size and the temperature [Citation50].
At simulation temperature 387 K, both the observed and calculated from MD trajectories EPR spectra have a specific shape which is explained as being a result of a partially restricted local motion of the probe (). The local alignment of the probe is strongly averaged out by slow diffusional dynamics of the surrounding LC molecules. Also, at this temperature, the order parameter of the LC is substantially reduced and the director distribution function becomes almost isotropic. When the system reaches completely isotropic state at T ~ 395 K ((d)), the fast dynamics of the probe averages out the hyperfine coupling almost completely, and the distance between the lines reaches its maximal values.
FA MD simulations and EPR spectroscopic studies have been performed also on 8CB LC [Citation34]. In this work, AMBER MD simulation suite [Citation51] was used in combination with the General AMBER Force Field (GAFF), and partial charges from CM4 scheme led to the improvement of the predicted value of TN-I transition temperature as well as observation of both nematic and smectic-A LCs and reproduction of experimental layer spacing in Sm-A [Citation34]. Overall, this study confirmed that the behaviour of 8CB in terms of MD and order in the phase transition region was fully consistent with the one reported earlier for 5CB. Spectra predicted for CSL spin probe doped in 8CB are compared with experimental ones in top panels of . As expected, MD simulations reveal the behaviour of CSL in 8CB being similar to the one observed in 5CB across the phase transition region including the dynamical fluctuations at the critical point. This is confirmed by the similarity of the EPR line shapes observed between 5CB and 8CB. It is beneficial to apply structurally different spin probes to the same LC systems with anticipation that their EPR spectra would be different but provide highly complementary information about molecular motions and order. For that reason, 8CB was also doped with 5DSA spin probes and experimental spectra measured at the same temperatures. The predicted EPR spectra are compared to experimental ones in bottom panels and are significantly different from the ones corresponding to CSL probe. In the case of 5DSA probe in the nematic state of 8CB, the averaged orientation of the magnetic z-axis lies along the director (see (a)), leading to the shift of resonances towards the outer peak positions of the left and right hyperfine coupling lines (B ~ 3366 Gauss and B ~ 3415 Gauss, respectively). This results in a significant broadening of the spectrum (line a) in the bottom panels of ). At the same time, the intensity of the inner peaks, which are dominant in the case of CLS probe, is significantly reduced. The slow tilting motions of the z-axis of 5DSA lead to a wide spread of resonances across the hyperfine coupling lines. The resulting EPR line shape is, therefore, a sensitive measure of such motions of the z-axis of 5DSA probe imposed by the alignment of the surrounding host 8CB molecules in the nematic phase. Upon the temperature increase, one would expect the correlation times and the amplitude of this motion to become faster and wider, respectively, causing the EPR spectrum to change significantly. Indeed, at T = 370 K, the line shapes of each of the hyperfine coupling lines become much narrower (line b) in the bottom panels of ), in agreement with the experiment. The observation of two meta-states I and II at the critical point of the phase transition was much less pronounced in the case of 5DSA (line c)) compared to CSL. Indeed, the line shapes corresponding to the partially ordered (I) and partially disordered (II) states are expected to be close to the ones just above and below line c) (lines b) and d), respectively). Contrary to the case of CLS spin probe, where these two line shapes are drastically different, in the case of 5DSA, the difference between them is less pronounced, leading to a much uniform EPR spectrum observed at T = 375K (lines c)). Heating of the system up to 400 K (lines e)) results in a completely isotropic state of the 8CB system with the fast dynamics of 5DSA averaging out almost completely the hyperfine coupling. As such, the resulting spectrum is very close in the shape to the one observed for CSL probe at the same temperature.
Figure 3. (Colour online) Comparison between experimental and predicted EPR spectra at different values of T-TNI. a) T-TNI = −15 K, b) T-TNI = −5 K, c) T-TNI = 0 K, d) T-TNI = 5 K and e) T-TNI = 25 K for CSL (left panels) and 5DSA (right panels) spin probes in 8CB. Spectra for CSL are reproduced from [Citation34] with permission from the Royal Society of Chemistry. Spectra for 5DSA were calculated from MD simulations of F. Chami and V. S. Oganesyan (unpublished). Contributions from meta-stable states I and II are indicated.
![Figure 3. (Colour online) Comparison between experimental and predicted EPR spectra at different values of T-TNI. a) T-TNI = −15 K, b) T-TNI = −5 K, c) T-TNI = 0 K, d) T-TNI = 5 K and e) T-TNI = 25 K for CSL (left panels) and 5DSA (right panels) spin probes in 8CB. Spectra for CSL are reproduced from [Citation34] with permission from the Royal Society of Chemistry. Spectra for 5DSA were calculated from MD simulations of F. Chami and V. S. Oganesyan (unpublished). Contributions from meta-stable states I and II are indicated.](/cms/asset/0f749663-5a9f-4173-8c4c-cef3403b4706/tlct_a_1508767_f0003_oc.jpg)
The autocorrelation function of each magnetic axis is calculated from an MD trajectory according to the following expression:
where is the second-order Legendre polynomial and the bracket denotes the average taken over the orientation distribution, time and the number of available molecules. A ‘sliding time window’ approach is conventionally used for time averaging [Citation27]. The effective correlation times are then calculated by time integration of the associated correlation function in accordance with:
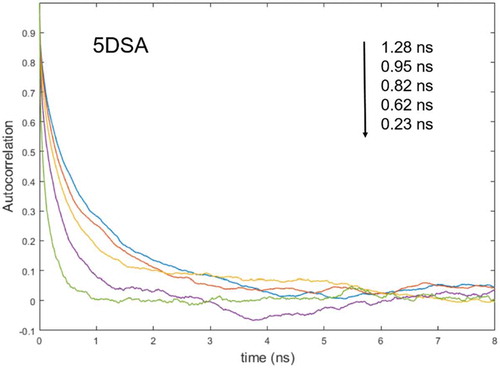
With the increasing temperature, both the order parameter and the correlation time of the z-magnetic axis of 5DSA are progressively reduced. In particular, the order parameter is reduced from 0.11 to 0.03, while the correlation time τz is reduced from 1.28 to 0.23 ns at T = 360 K and T = 400 K, respectively.
compares the variation with temperature of the calculated order parameters and effective correlation times among 8CB, CSL and 5DSA. Parameters for the main molecular axis of 8CB, y magnetic axis of CSL probe and z magnetic axis of 5DSA probe are shown by black, red and blue circles, respectively. Also, for illustration, the autocorrelation functions of 5DSA spin probe calculated from single MD trajectories at different temperatures are presented in . Strong correlation among all three order parameters is observed with SLC being the largest since it is related to the core vector of the 8CB molecules, while Sy and Sz are associated with the flexible nitroxide head group of the CLS and 5DSA spin probes, respectively. The effective rotational correlation times of 8CB and both probes are distinctly different at the lowest simulation temperature 320 K but become comparable upon approaching the phase transition temperature and above it.
Figure 4. (Colour online) Panels (a) and (b) show the variation with temperature of the calculated order parameters and effective correlation times, respectively, of 8CB, CSL and 5DSA. Parameters for the main axis of 8CB, y magnetic axis of CSL probe and z magnetic axis of 5DSA probe are shown by black, red and blue circles, respectively.
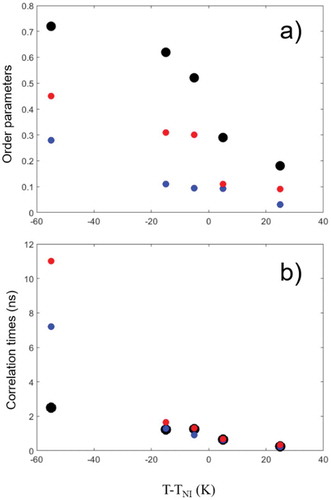
Figure 5. (Colour online) Variation with temperature of autocorrelation functions of 5DSA spin probe in 8CB calculated from single MD trajectories with calculated effective correlation times indicated.
Application to discotic LCs using BD trajectories
Columnar discotic LCs (DLCs) currently attract considerable interest for their potential technological applications as one-dimensional conductors and in sensors, field-effect transistors and photovoltaic solar cells [Citation52,Citation53]. The stacked poly-aromatic cores provide an efficient structure for charge transport along the columns and considered as one-dimensional pathways for an efficient charge and energy transfer. Thus, understanding the dynamics and microscopic phase behaviour of columnar discotics at the molecular scale is crucial for designing devices with desired functionalities. Hexakis(n-hexyloxy)triphenylene (HAT6) is the most commonly known columnar LC based on hexasubstituted triphenylenes. A purpose-designed novel spin probe has been synthesised to study HAT6 [Citation54] (see ). The design of the probe was based on two important conditions: (i) the probe should resemble the host matrix molecules as closely as possible to favour intercalation and cause minimal disruption and (ii) the nitroxide fragment must be rigid with respect to the discotic core. HAT6 can adopt three phases, namely the isotropic (I), hexagonal columnar (Col) and crystalline (Cr), with temperatures ~373 and ~335 K corresponding to I–Col and Col–Cr phase transitions, respectively.
Figure 6. (Colour online) Top: Structures of HAT6 and discotic rigid core nitroxide spin probe. Bottom: Schematic diagrams representing isotropic, columnar and crystalline domain distributions of HAT6 molecules. Spin probes are shown in red.
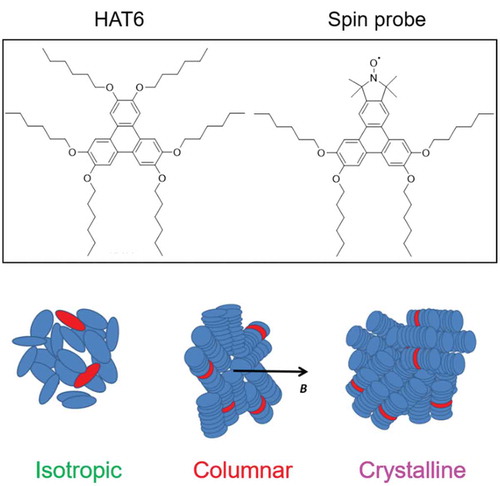
Experimental EPR spectra of HAT6, doped with the discotic spin probe between 420 and 360 K, are presented in . EPR spectra demonstrate high sensitivity of EPR line shapes to the states of HAT6 with prominent changes observed. The outer right peak position (inset) is particularly indicative of all four states of HAT6, namely I, Mixed, Col and Cr. For temperatures 378 K < T < 420 K of the isotropic phase, EPR spectra have characteristic line shapes corresponding to slow anisotropic rotational diffusion. Upon approaching the critical point, the spectra undergo dramatic change showing contribution from the Col phase in the sample. In the presence of magnetic field, the columns of this LC phase are oriented perpendicular to the field as schematically shown in .
Figure 7. (Colour online) Panel (a) shows experimental VT EPR spectra of HAT6 doped with discotic rigid core probe recorded every 3 K between 420 and 360 K on cooling. Inset shows a magnified image of the high-field edge of EPR spectra. Vertical lines indicate the features in EPR spectra corresponding either to I or to Col states of HAT6. ‘Mix’ in the inset indicates the high-field feature associated with the mixed state. Panel (b) shows EPR spectra between 360 and 320 K on cooling. Inset indicates a magnified image of the high-field edge of EPR spectra. Vertical lines indicate the features in EPR spectra corresponding either to Col or to Cr phases of HAT6. Panels (c) and (d) correspond to the simulated EPR spectra for selected temperatures representing most characteristic line shapes. I, Col and Cr shapes are shown by green, red and purple lines. The I–Col phase transition critical point is shown by blue line. Figures are reproduced from [Citation54] with some modification and permission from WILEY.
![Figure 7. (Colour online) Panel (a) shows experimental VT EPR spectra of HAT6 doped with discotic rigid core probe recorded every 3 K between 420 and 360 K on cooling. Inset shows a magnified image of the high-field edge of EPR spectra. Vertical lines indicate the features in EPR spectra corresponding either to I or to Col states of HAT6. ‘Mix’ in the inset indicates the high-field feature associated with the mixed state. Panel (b) shows EPR spectra between 360 and 320 K on cooling. Inset indicates a magnified image of the high-field edge of EPR spectra. Vertical lines indicate the features in EPR spectra corresponding either to Col or to Cr phases of HAT6. Panels (c) and (d) correspond to the simulated EPR spectra for selected temperatures representing most characteristic line shapes. I, Col and Cr shapes are shown by green, red and purple lines. The I–Col phase transition critical point is shown by blue line. Figures are reproduced from [Citation54] with some modification and permission from WILEY.](/cms/asset/1d676523-986c-459b-ab99-23bfc2168bb7/tlct_a_1508767_f0007_oc.jpg)
Spectra measured upon further cooling of the sample through the Col–Cr phase transition are shown in ). The Col–Cr transition is characterised by an abrupt change of the EPR line shape which occurs within a narrow temperature interval (<3 K).
Relatively slow re-orientational dynamics of HAT6 molecules would require generation of long MD trajectories, making the application of all-atom MD simulations at the time too computationally expensive and therefore impractical. Instead, EPR simulations were performed using BD trajectories generated from the solution of Langevin equation for the rotational diffusion of the spin probe in the presence of an ordering potential described by Equation (15). The results presented in bottom panels of demonstrated good agreement with experiment for all phases. The adjusted values of rotational diffusion coefficients and
for the Col phase were in good agreement with those reported previously [Citation55]. Also, EPR simulations have provided the estimation of the director distribution of the columnar axes from their average plane of alignment which was calculated using a normal distribution with a bandwidth of ~42°. Importantly, the sensitivity of variable temperature EPR spectra to the order and rotational diffusion of the probe molecule in different states has confirmed the columnar domain distribution of HAT6 molecules in the presence of a magnetic field. In the Col phase, the magnetic field on average is lying in the plane of the nitroxide ring (see schematic diagram in ). As a result, the line shape of a pure Col phase (at 360 K) is characterised by a substantial increase of the resonance intensity corresponding to the orientation of the magnetic field in the xy-plane (inner edges of hyperfine coupling lines at 3377 Gauss and 3392 Gauss, respectively). If the columns would be oriented along the applied magnetic field, the field would be oriented perpendicular to the nitroxide plane, resulting in significantly increased resonance intensity at the outer edge positions of the spectra (3361 Gauss and 3422 Gauss, respectively). This was not observed experimentally. An abrupt change in the line shape upon going from Col to powder Cr is also easily understood from the view point of the changes in the averaged orientational distribution of the spin probe. Cr phase is associated with the even distribution, resulting in the decreased number of resonances in the xy-plane and increased ones in the z orientations (outer edges of the lines) with the noticeable broadening of the total spectrum (, right panels). Overall, the Variable Temperature (VT) EPR spectra showed high sensitivity to the HAT6 phase composition, molecular rotational dynamics and columnar order as well as the director distribution. Simulations of the EPR line shapes using a BD simulation model provided accurate estimate of the motional and order parameters at different temperatures along both I–Col and Col–Cr phase transitions.
Application to lyotropic LCs
Surfactant–water systems are highly important in both nature’s (cell membranes) and industrial (e.g. detergents, lubricants, colloidal agents and drug delivery systems) processes and applications and have been the subject of intense study for many years [Citation56,Citation57]. SDS and DTAC are classical examples of anionic and cationic surfactants, respectively.
Recently, Prior and Oganesyan have reported the first simulation of CW EPR spectra of lyotropic LCs at different aggregate states doped with 5DSA spin probe from the results of all-atom MD modelling [Citation38]. Large-scale MD simulations using the GAFF with AMBER suite have been performed on pre-micellar, micellar, rod and lamellar aggregates of SDS and DTAC LCs. The resulting MD trajectories were used to predict and interpret the EPR spectra [Citation38]. A comparative analysis between the results for SDS and DTAC has been undertaken. The purpose of this work was twofold. First, simulation of EPR line shapes from the results of FA MD modelling and comparing them to experiment provided an ultimate test bed for the force fields currently employed to model lyotropic systems. Second, and of equal importance, such a combined MD-EPR methodology allowed the authors to test the validity of the application of the MF approach. MF approach aims to parameterise the time autocorrelation functions of molecular rotations without specific assumptions of the models employed [Citation44]. The approach first introduced by Lipari and Szabo has been used widely in the interpretation of Nuclear Magnetic Resonance (NMR) relaxation data [Citation58–Citation60] and is popular due to the ease of use and clarity of parameters estimated and interpreted. Its formulation is based on the assumption that local and global motions are statistically independent from each other. It was shown in [Citation38] that both the rotational diffusion coefficients and the order parameters associated with the restricted motion of the spin probe can be extracted from the autocorrelation functions and subsequently employed in the SLE-FP EPR simulation procedure using Equations (13–16) in combination with the available computer software [Citation43,Citation61]. In the case when two motional contributions, namely the local restricted dynamics of the probe and the global dynamics of the environment of the LC aggregation, are well separated on the motional timescale, a useful simplification can be employed. Provided that the local motions of the probe are within the so-called motional narrowing limit (τ ≤ 1 ns), the magnetic tensors associated with the nitroxide moiety can be partially averaged prior to the application of the SLE-FP procedure. Then, only the global diffusion of an appropriate symmetry and restriction is taken into consideration by the SLE-FP simulation through the use of an appropriate rotational operator. Importantly, the advantage of the MF-based MD-EPR simulation approach is that its application is relatively straightforward and fast. This is because the simulation parameters estimated by the fitting of autocorrelation curves generated from MD trajectories using the MF approach usually require much shorter trajectory lengths compared to the ones used in the direct propagation methods that require long sampling times [Citation38].
The results of the application of direct propagation technique and indirect simulation using the MF approach were compared to each other and experimental spectra. By performing the MD analysis on the host LC molecules, the relationship between the motions of the host and the probe was also demonstrated [Citation38].
The results showed perfect agreement between predicted and experimental EPR spectra for both micro-aggregate and micellar phases of SDS and DTAC LCs. A good agreement has also been achieved for hexagonal phases of SDS and DTAC and for the lamellar phase of SDS. The disagreement between the simulated and experimental EPR spectra for the DTAC lamellar phase was attributed to the overestimation by GAFF of the packing and order of the carbon acyl chains of the host lyotropics. Contrary to SDS, in DTAC lamellae, the nitroxide head group of the probe penetrates deep inside the environment of the carbon chains, resulting in its increased motional restraint and consequent broadening of the EPR spectrum. This was in agreement with recent modelling studies on non-ionic chromonic LCs that have confirmed that GAFF also overestimates the interaction between the hydrophilic ethyleneoxy chains of the molecules, resulting in their aggregation into compact disorganised clusters instead of ordered stacks [Citation62].
In the current review for illustrative purposes, we will focus on the application of the MD-EPR simulation approaches to the dynamics of SDS micelles at different temperatures. shows the equilibrated structures of 5DSA (purple) doped in SDS micelle composed of 60 surfactant molecules [Citation63]. It also shows snapshots of SDS micelle at different times highlighting the effect of surface diffusion using a selection of molecules shown in red. Snapshots indicate that relatively fast molecular surface diffusion occurs, leading to the loss of coordinated motions among them on the scale of a few nanoseconds. The autocorrelation plots of the magnetic and molecular axes of the probe and host molecules, respectively, are presented in the bottom panels of and were fitted using the following MF expressions:
Figure 8. (Colour online) Equilibrated structure of N60 SDS and snapshots of SDS micelles showing the effect of surface diffusion using a selection of molecules represented in red. In all images, water molecules are excluded for clarity; (a) and (b) represent rotational autocorrelation functions of 5DSA spin probe and SDS, respectively. Functions corresponding to magnetic axes x, y and z of the probe are shown by green, blue and red lines, respectively. Functions corresponding to SDS molecular axes X/Y and Z are shown by blue and red lines, respectively. Autocorrelation functions are reproduced from [Citation38] with permission from WILEY.
![Figure 8. (Colour online) Equilibrated structure of N60 SDS and snapshots of SDS micelles showing the effect of surface diffusion using a selection of molecules represented in red. In all images, water molecules are excluded for clarity; (a) and (b) represent rotational autocorrelation functions of 5DSA spin probe and SDS, respectively. Functions corresponding to magnetic axes x, y and z of the probe are shown by green, blue and red lines, respectively. Functions corresponding to SDS molecular axes X/Y and Z are shown by blue and red lines, respectively. Autocorrelation functions are reproduced from [Citation38] with permission from WILEY.](/cms/asset/94fb069a-83bd-4ac6-8278-ab5cd24bdc14/tlct_a_1508767_f0008_oc.jpg)
where the superposition of the axial restrained local motion with two-dimensional isotropic surface diffusion is represented by and
correlation times and,
, isotropic rotational diffusion coefficient, respectively.
related to the associated correlation time according to
. As one can observe in each case, the decay curves are consistent with the overall axial dynamics which has distinct bi-exponential character, representing the superposition of fast restricted internal and unrestricted global motions. For the SDS micelle, the local order parameter and global diffusion coefficient (
= 0.36 and
= 3.8 × 10⁷ s−1 at 300 K) were found in good agreement with that of Westlund and co-workers who fitted the EPR spectra with the two-dynamic model (
= 0.43 and
= 5.0 × 10⁷ s−1 at 298 K) [Citation64].
The magnetic tensors A and g were partially averaged out in response to the local axial order, represented by the order parameter, and in accordance with the equations derived by Gaffney and McConnell for their averaged values in the axially symmetric local environment [Citation65]. The EPR spectra predicted from MD data using the MF approach are shown in in red and are in perfect agreement with the experimental ones shown in blue. They were also in full agreement with the results of EPR simulations using direct propagation technique for the entire sampling time (300 ns), although evidently much shorter trajectory lengths were required for the simulation using the MF approach (~30 ns).
Figure 9. (Colour online) Comparison between experimental (blue) and predicted (red) EPR spectra of SDS micelle doped with 5DSA at three selected temperatures. Spectra are reproduced from [Citation38] with permission from WILEY.
![Figure 9. (Colour online) Comparison between experimental (blue) and predicted (red) EPR spectra of SDS micelle doped with 5DSA at three selected temperatures. Spectra are reproduced from [Citation38] with permission from WILEY.](/cms/asset/635a50e2-729c-47de-8185-b2d4e95ff2aa/tlct_a_1508767_f0009_oc.jpg)
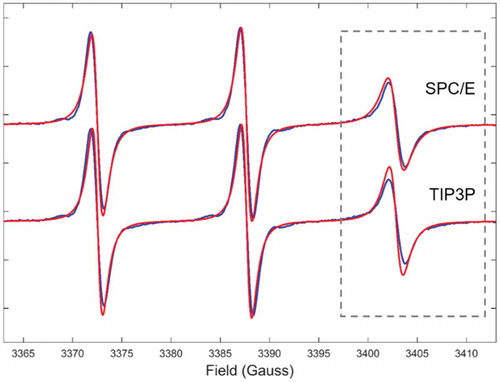
The global tumbling of the micelles is on the timescale of nanoseconds. As mentioned above, EPR line shapes at X-band are particularly sensitive to the motions occurring on the 0.1–100 ns timescale, making the application of our MD-EPR simulation methodology highly feasible for testing water force field models. Thus, additional simulation of SDS micelle using the same force fields for surfactants but combined with TIP3P water model, instead of SPC/E, was undertaken. The result for T = 320 K is presented in and is compared to both the prediction using SPC/E water model and experiment. The predicted from MD data EPR spectrum using TIP3P has small but noticeable narrowing of the high field line in the EPR spectrum compared to both the experimental spectrum and the one simulated using SPC/E. The observed differences are attributed to the fact that contrary to SPC/E, which is known for an adequate representation of water diffusion [Citation66], TIP3P tends to underestimate the viscosity of water molecules [Citation66] and consequently overestimate the rotational diffusion of micellar aggregates, resulting in the narrowing of the hyperfine coupling line in the EPR spectrum. Indeed, the extracted global diffusion coefficient in the cases of SPC/E and TIP3P were = 6.7 × 10⁷ s−1 and
= 9.9 × 10⁷ s−1, respectively. This behaviour has been confirmed in most recent MD-EPR simulation study of double- and single-strand spin-labelled DNA where more pronounced difference in EPR spectra was observed between SPC/E and TIP3P models because of relatively slow rotational diffusion of DNA fragments in water [Citation31].
Figure 10. (Colour online) Comparison between experimental EPR spectrum of SDS micelle doped with 5DSA at 320 K (blue lines) and those predicted from MD (red lines) using two different force field models for water.
Conclusions
A novel MD-EPR simulation methodology bridges the gap between an advanced spectroscopic technique and MD modelling, increasing substantially the informational content generated from the analysis of EPR measurements on LCs. The main advantage of our approach is that motional contributions are explicitly accounted in MD trajectories of actual structures without the need for evoking highly parametrised models with multiple adjustable parameters. Such an approach not only greatly simplifies the interpretation and analysis of experimental results but also provides a rigorous test bed for the state-of-the-art molecular force fields. Recent applications to both thermotropic and lyotropic LCs show that this strategy has a power of providing unambiguous conclusions about molecular structure and dynamics in different states and across phase transition regions of LCs. In particular, an accurate estimate of the molecular rotational correlation times, local order and global director distribution can be achieved. With the fast improvements in the available computing power and parallelisation methods (including novel cluster architectures with Graphics processing units/Message Passing Interface (GPU/MPI)), the major focus in the near future is likely to be on achieving longer trajectory lengths over realistic times and the possibility of all-atom MD-EPR studies on larger and more complex LC systems. This will entail the possibility of applying direct propagation methods for the entire sampling time as well as using larger bulk system for introduction of multiple spin probes for improved statistical calculation and the increased accuracy of the predicted spectra as a result. Further advances are expected in the development and use of hybrid MD models where the spin probe is modelled at all-atom level, but the bulk is simulated at CG level and thus allowing significantly longer trajectories over reasonable time.
Acknowledgements
I would like to acknowledge the financial support of the LC work in my lab by EPSRC (Grants EP/H020411/1, EP/L001322/1 and EP/P007554/1). I would like to thank all the past and present members of my group involved one way or another in the studies of LCs and, in particular, Dr Fatima Chami and Dr Chris Prior for their contributions and for carrying out additional MD simulations. Finally, I would like to express special gratitude to my long-standing collaborators Prof Mark Wilson from Durham University and Prof Andrew Cammidge from the University of East Anglia and for their contributions to the work reported in this review.
Disclosure statement
No potential conflict of interest was reported by the author.
Additional information
Funding
References
- Luckhurst GR, Setaka M, Zannoni C. Electron resonance investigation of molecular-motion in smectic – a mesophase of a liquid-crystal. Mol Phys. 1974;281:49–68. PubMed PMID: WOS:A1974T727200004; English.
- Luckhurst GR, Poupko R, Zannoni C. Spin relaxation for biradical spin probes in anisotropic environments. Mol Phys. 1975;30(2): 499–515. PubMed PMID: WOS:A1975AQ31500012; English.
- Luckhurst GR, Zannoni C. Orientation-dependent spin relaxation – tri-radical spin probes in anisotropic environments. J Magn Reson. 1976;23(2): 275–283. PubMed PMID: WOS:A1976CB00400011; English.
- Zannoni C, Pedulli GF, Masotti L, et al. The polyliquid crystalline electron-paramagnetic-res of nitroxide spin probes and their interpretation. J Magn Reson. 1981;43(1):141–153. PubMed PMID: WOS:A1981LN32800016; English.
- Giordano M, Leporini D, Martinelli M, et al. Electron resonance investigation of a cholesteric mesophase induced by a chiral probe. J Chem Soc Farad T. 1982;78(2):307. PubMed PMID: WOS:A1982NF47100007; English.
- Gottarelli G, Pedulli GF, Zannoni C. An electron-paramagnetic-res determination of the helix pitch and relative handedness of some induced cholesteric mesophases. Chem Phys. 1982;64(1): 143–150. PubMed PMID: WOS:A1982MY92400010; English.
- Arcioni A, Bacchiocchi C, Grossi L, et al. Electron spin resonance studies of order and dynamics in a nematic liquid crystal containing a dispersed hydrophobic aerosil. J Phys Chem B. 2002 Sep 12;106(36):9245–9251. PubMed PMID: WOS:000177876900010; English.
- Vecchi I, Arcioni A, Bacchiocchi C, et al. Expected and unexpected behavior of the orientational order and dynamics induced by azobenzene solutes in a nematic. J Phys Chem B. 2007 Apr 7;111(13):3355–3362. PubMed PMID: WOS:000245260500007; English.
- Miglioli I, Bacchiocchi C, Arcioni A, et al. Director configuration in the twist-bend nematic phase of CB11CB. J Mater Chem C. 2016 Nov 7;4(41):9887–9896. PubMed PMID: WOS:000386981800032; English.
- Cabiddu S, Pedulli GF, Zannoni C. An electron-spin-resonance investigation of a new lyotropic lamellar phase from an amphiphile with a cationic head group. Mol Cryst Liq Cryst. 1981;75(1–4): 143–154. PubMed PMID: WOS:A1981MP91000012; English.
- Luckhurst GR, Setaka M, Yeates RN, et al. Orientational order in the lamellar g-phase of the sodium decanoate n-decanol-water system – electron resonance investigation. Mol Phys. 1979;38(5):1507–1520. PubMed PMID: WOS:A1979HV18700017; English.
- Oganesyan VS. Computational approaches for simulating motional EPR spectra. In: Gilbert B, Chechik V, Murphy DM, editors. SPR: electron paramagnetic resonance. Vol. 24. London: The Royal Society of Chemistry; 2015. p. 32–61.
- Borbat PP, Costa-Filho AJ, Earle KA, et al. Electron spin resonance in studies of membranes and proteins. Science. 2001 Jan 12;291(5502):266–269. PubMed PMID: WOS:000166352900035; English.
- Budil DE, Lee S, Saxena S, et al. Nonlinear-least-squares analysis of slow-motion EPR spectra in one and two dimensions using a modified Levenberg-Marquardt algorithm. J Magn Reson Ser. 1996 Jun;120(2):155–189. PubMed PMID: WOS:A1996UR99900003.
- Freed JH, Bruno GV, Polnaszek CF. Electron spin resonance line shapes and saturation in the slow motional region. J Phys Chem. 1971;75(22):3385–3399.
- Polnaszek CF, Bruno GV, Freed JH. ESR line shapes in slow-motional region – anisotropic liquids. PubMed PMID: WOS:A1973P572200009; English. J Chem Phys. 1973;588:3185–3199.
- Schwartz LJ, Stillman AE, Freed JH. Analysis of electron-spin echoes by spectral representation of the stochastic Liouville equation. PubMed PMID: WOS:A1982PQ36200020; English. J Chem Phys. 1982;7711:5410–5425.
- Usova N, Persson L, Westlund PO. Theory of slow-motion EPR lineshapes for studies of membrane curvature. PubMed PMID: WOS:000087369000016 Phys Chem Chem Phys. 2000;212:2785–2793.
- Steinhoff H-J, Hubbell WL. Calculation of electron paramagnetic resonance spectra from Brownian dynamics trajectories: application to nitroxide side chains in proteins. Biophys J. 1996 Oct;71(4):2201–2212. PubMed PMID: WOS:A1996VK29500053.
- Wolynes PG, Deutch JM. Dynamical orientation correlations in solution. PubMed PMID: ISI:A1977DP68500054; English J Chem Phys. 1977;672:733–741.
- Robinson BH, Slutsky LJ, Auteri FP. Direct simulation of continuous wave electron-paramagnetic resonance-spectra from Brownian dynamics trajectories. J Chem Phys. 1992 Feb 15;96(4):2609–2616. . PubMed PMID: WOS:A1992HE74300021; English.
- Talezer H, Kosloff R. An accurate and efficient scheme for propagating the time-dependent Schrodinger-equation. J Chem Phys. 1984;81(9): 3967–3971. PubMed PMID: WOS:A1984TS41400029; English.
- Hakansson P, Persson L, Westlund PO. Ito diffusions on hypersurfaces with application to the Schwarz-P surface and nuclear magnetic resonance theory. J Chem Phys. 2002 Nov 15;117(19):8634–8643. PubMed PMID: WOS:000178934700005.
- DeSensi SC, Rangel DP, Beth AH, et al. Simulation of nitroxide electron paramagnetic resonance spectra from Brownian trajectories and molecular dynamics simulations. Biophys J. 2008 May 15;94(10):3798–3809. PubMed PMID: ISI:000255309700010; English.
- Sezer D, Freed JH, Roux B. Multifrequency electron spin resonance spectra of a spin-labeled protein calculated from molecular dynamics simulations. J Am Chem Soc. 2009;131(7):2597–2605.
- Rose ME. Elementary theory of angular momentum. New York: JOHN WILEY & SONS; 1957.
- Oganesyan VS. A general approach for prediction of motional EPR spectra from molecular dynamics (MD) simulations: application to spin labelled protein [10.1039/C0CP01068E]. Phys Chem Chem Phys. 2011;13(10):4724–4737.
- Oganesyan VS. A novel approach to the simulation of nitroxide spin label EPR spectra from a single truncated dynamical trajectory. J Magn Reson. 2007 Oct;188(2):196–205. PubMed PMID: WOS:000250536000002; English.
- Kuprusevicius E, White G, Oganesyan VS. Prediction of nitroxide spin label EPR spectra from MD trajectories: application to myoglobin [10.1039/C004855K]. Faraday Discuss. 2011;148:283–298.
- Oganesyan VS, Chami F, White GF, et al. A combined EPR and MD simulation study of a nitroxyl spin label with restricted internal mobility sensitive to protein dynamics. J Mag Res. 2017;274:24–35. cited 2017 Jan 01. .
- Prior C, Danilane L, Oganesyan VS. All-atom molecular dynamics simulations of spin labelled double and single-strand DNA for EPR studies. Phys Chem Chem Phys. 2018 May 16;20(19):13461–13472. . PubMed PMID: 29725672.
- Catte A, Gaye WF, Wilson MR, et al. Direct prediction of EPR spectra from lipid bilayers – a route to understanding structure and dynamics in biological membranes. ChemPhysChem. 2018. doi: 10.1002/cphc.201800386.
- Oganesyan VS, Kuprusevicius E, Gopee H, et al. Electron paramagnetic resonance spectra simulation directly from molecular dynamics trajectories of a liquid crystal with a doped paramagnetic spin probe. Phys Rev Lett. 2009 Jan 08;102(1):013005. cited.
- Chami F, Wilson MR, Oganesyan VS. Molecular dynamics and EPR spectroscopic studies of 8CB liquid crystal. PubMed PMID: WOS:000304924500022; English Soft Matter. 2012;825:6823–6833.
- Kuprusevicius E, Edge R, Gopee H, et al. Prediction of EPR spectra of liquid crystals with doped spin probes from fully atomistic molecular dynamics simulations: exploring molecular order and dynamics at the phase transition. Chem Eu J. 2010;16(38):11558–11562.
- Budil DE.CW-EPR spectral simulations: slow-motion regime. Method Enzymol. 2015; 563: 143–170. PubMed PMID: WOS:000376156800008; English.
- Budil DE, Lee S, Saxena S, et al. Nonlinear-least-squares analysis of slow-motion EPR spectra in one and two dimensions using a modified Levenberg–Marquardt algorithm. J Magn Reson Series. 1996;120(2):155–189.
- Prior C, Oganesyan VS. Prediction of EPR spectra of lyotropic liquid crystals using a combination of molecular dynamics simulations and the model-free approach. Chem-Eur J. 2017 Sep 21;23(53):13192–13204. PubMed PMID: WOS:000411357000032; English.
- Kubo R. Stochastic Liouville equations. PubMed PMID: ISI:A19635643B00010; English J Math Phys. 1963;42:174.
- Freed JH, Bruno GV, Polnaszek CF. Electron spin resonance line shapes and saturation in slow motional region. PubMed PMID: ISI:A1971K705900002; English J Phys Chem-Us. 1971;7522:3385–3399.
- Schwartz LJ, Stillman AE, Freed JH. Analysis of electron spin echoes by spectral representation of the stochastic Liouville equation. J Chem Phys. 1982;77(11):5410–5425.
- Zerbetto M, Polimeno A, Cimino P, et al. On the interpretation of continuous wave electron spin resonance spectra of tempo-palmitate in 5-cyanobiphenyl. J Chem Phys. 2008;128(2):024501.
- Schneider DJ, Freed JH. Calculating slow motional magnetic resonance spectra. In: Berliner LJ, Reuben J, editors. Spin labeling: theory and applications. Boston, MA: Springer US; 1989. p. 1–76.
- Lipari G, Szabo A. Model-free approach to the interpretation of nuclear magnetic resonance relaxation in macromolecules. 1. Theory and range of validity. J Am Chem Soc. 1982;104(17):4546–4559.
- Barone V, Cimino P, Stendardo E. Development and validation of the B3LYP/N07D computational model for structural parameter and magnetic tensors of large free radicals. J Chem Theory Comp. 2008;4(5):751–764.
- Barone V, Cimino P. Validation of the B3LYP/N07D and PBE0/N07D computational models for the calculation of electronic g-tensors. J Chem Theory Comp. 2009;5(1):192–199.
- Frisch MJ, Trucks GW, Schlegel HB, et al. Gaussian 09. Wallingford, CT, USA: Gaussian, Inc.; 2009.
- Van der Spoel D, Lindahl E, Hess B, et al. GROMACS: fast, flexible, and free. J Comput Chem. 2005 Dec;26(16):1701–1718. PubMed PMID: WOS:000233021400004; English.
- Tiberio G, Muccioli L, Berardi R, et al. Towards in silico liquid crystals. realistic transition temperatures and physical properties for n-cyanobiphenyls via molecular dynamics simulations. Chemphyschem. 2009 Jan 12;10(1):125–136. PubMed PMID: WOS:000262870500018; English.
- De Gennes PG. The physics of liquid crystals. UK: Oxford Univ. Press; 1974.
- Wang JM, Wolf RM, Caldwell JW, et al. Development and testing of a general amber force field. J Comput Chem. 2004 Jul 15;25(9):1157–1174. PubMed PMID: WOS:000221624200007; English.
- Goodby JW. Editorial – liquid crystals. PubMed PMID: WOS:000250701000001; English Chem Soc Rev. 2007;3612:1855–1856.
- Woltman SJ, Jay GD, Crawford GP. Liquid-crystal materials find a new order in biomedical applications. Nat Mater. 2007 Dec;6(12):929–938. . PubMed PMID: WOS:000251317000013; English.
- Gopee H, Cammidge AN, Oganesyan VS. Probing columnar discotic liquid crystals by EPR spectroscopy with a rigid-core nitroxide spin probe. Angewandte Chem Int Edn. 2013;52(34):8917–8920.
- Shen X, Dong RY, Boden N, et al. Orientational ordering and dynamics in the columnar phase of a discotic liquid crystal studied by deuteron NMR spectroscopy. J Chem Phys. 1998 Mar 8;108(10):4324–4332. PubMed PMID: WOS:000072373500056; English.
- Soederman O, Walderhaug H, Henriksson U, et al. NMR relaxation in isotropic surfactant systems. A deuterium, carbon-13, and nitrogen-14 NMR study of the micellar (L1) and cubic (I1) phases in the dodecyltrimethylammonium chloride water system. J Phys Chem. 1985;89(17):3693–3701.
- Quist PO, Halle B, Furó I. Nuclear spin relaxation in a hexagonal lyotropic liquid crystal. J Chem Phys. 1991;95(9):6945–6961.
- Knight MJ, Pell AJ, Bertini I, et al. Structure and backbone dynamics of a microcrystalline metalloprotein by solid-state NMR. Proc Natl Acad Sci U S A. 2012 Jun 21;109(28):11095–11100. PubMed PMID: PMC3396464.
- Liang B, Arora A, Tamm LK. Fast-time scale dynamics of outer membrane protein A by extended model-free analysis of NMR relaxation data. Biochimica Et Biophysica Acta (BBA) - Biomembranes. 2010 Feb;1798(2):68–76. .
- Daragan VA, Mayo KH. Novel model-free Analysis of13C NMR relaxation of alanine-methyl side-chain motions in peptides. J Magn Resonance, Ser B. 1996;110(2):164–175.
- Stoll S, Schweiger A. EasySpin, a comprehensive software package for spectral simulation and analysis in EPR. J Magn Reson. 2006 Jan;178(1):42–55. .
- Akinshina A, Walker M, Wilson MR, et al. Thermodynamics of the self-assembly of non-ionic chromonic molecules using atomistic simulations. The case of TP6EO2M in aqueous solution [10.1039/C4SM02275K]. Soft Matter. 2015;11(4):680–691.
- Bales BL, Messina L, Vidal A, et al. Precision relative aggregation number determinations of SDS micelles using a spin probe. A model of micelle surface hydration. J Phys Chem B. 1998;102(50):10347–10358.
- Liang Z, Wikander G, Westlund PO. Slow motion electron spin resonance line shapes of lyotropic liquid crystals in hexagonal phase. J Chem Phys. 1995;102(4):1471–1480.
- Gaffney BJ, McConnell HM. The paramagnetic resonance spectra of spin labels in phospholipid membranes. J Magn Resonance(1969). 1974;16(1):1–28.
- Mark P, Nilsson L. Structure and dynamics of the TIP3P, SPC, and SPC/E water models at 298 K. J Phys Chem B. 2001 Nov 1;105(43):24a–24a. PubMed PMID: WOS:000172020200058; English.