
 ?Mathematical formulae have been encoded as MathML and are displayed in this HTML version using MathJax in order to improve their display. Uncheck the box to turn MathJax off. This feature requires Javascript. Click on a formula to zoom.
ABSTRACT
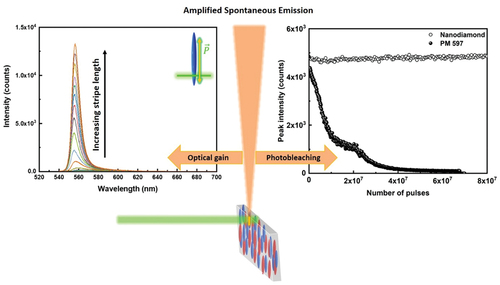
Optical gain and resistance against photo-bleaching are key material parameters for practical applications in microlasers and microphotonics. Here, we present studies of optical amplification and photo-bleaching in a wide range of optical gain materials, including fluorescent dyes, quantum dots and rods, organic and inorganic room temperature polaritons, and nanodiamonds with emission range from 430 to 680 nm. We used amplified spontaneous emission (ASE) for each material to measure the optical gain. Robustness against photo-bleaching was determined by measuring the intensity of spontaneous emission of the material as a function of the number of excitation femtosecond pulses (106–1010) at various excitation energy densities. We show that pyrromethene laser dyes are the best organic emitters in terms of low excitation energy and good optical gain, whereas solid-state polariton materials are better in terms of high optical gain and stability. We found that all organic and inorganic optical gain materials bleach completely after 106–109 illumination pulses with typical 0.1–0.6 GW/cm2 peak power density, with an exception of nanodiamonds. We show that nanodiamonds are the only optical gain material that shows no photo-bleaching beyond the 1010 excitation pulses of 300 fs pulse duration and with 0.16 GW/cm2 peak power density.
GRAPHICAL ABSTRACT
1. Introduction
In recent years, efforts to realise optically pumped low-threshold lasing from the photonic band edge of a laser dye-doped cholesteric liquid crystal (CLC) have been focused on developing new optical gain materials with optimised pumping parameters and enhanced photostability [Citation1–9]. Numerous organic, inorganic and biological optical gain materials have been explored, but the obtained results are difficult to compare due to the different methods used. There is clearly a need for a characterisation method to screen optical gain materials for specific applications in microdroplet liquid crystal lasers [Citation10–13]. In a small, ten micrometre diameter droplet laser, optical gain material is strongly confined and isolated from the external reservoir of gain molecules. Under these circumstances, the fluorescent organic molecules are exposed to intense optical excitation, which gives rise to a rapid bleaching and decrease of lasing intensity. For example, a ~20-μm nematic liquid crystal droplet with fluorescent dye is lasing for only some ten minutes under the repetition rate of ~100 Hz and illumination peak power density of ~10 MW/cm2. The life time of such dye lasers is clearly far from practical use and has to be improved.
The aim of this study is to measure the optical gain and rate of photo-bleaching of a variety of materials that are used, or are considered to be used in liquid crystal microdroplet lasers. Typically, LC microdroplet lasers are droplets of a nematic [Citation14,Citation15], chiral nematic [Citation16] or even ferroelectric liquid crystals [Citation17] dispersed in another medium that does not mix with that particular LC. For example, nematic droplets of 5CB are dispersed in water with added surfactants to control the surface anchoring, which controls the internal director structure of the droplet [Citation15]. Whispering Gallery Mode (WGM) lasing is obtained from such a droplet, if optical gain is added to the LC, and is excited by external light pulses. The optical gain material is usually fluorescent organic dye that easily dissolves in LC and has large quantum yield. The excitation of electronic transitions within gain fluorescent molecules will give rise to spontaneous and stimulated emission of light. Because a LC droplet is an optical cavity that sustains WGMs, lasing will take place from these modes, generating characteristic WGM spectrum of sharp lines [Citation14,Citation15]. In a WGM microlaser, made of nematic droplet with dissolved fluorescent dye, the typical lasing threshold fluences of the excitation (pump) pulsed beam is of the order of ~1 mJ/cm2 and typical pulse duration is ~1 ns.
It has been shown, that such WGM laser can be controlled by low external electric field over significant range of emitted wavelengths. Similarly, omnidirectional lasing is obtained from cholesteric droplet with onion-like director structure [Citation16]. In reality, the life time of such micro-lasers based on fluorescent organic dyes is some ten minutes, and the lasing intensity decreases due to the photo-induced bleaching of fluorescent dyes. This is a very old and well-known problem of dye lasers, which becomes quite severe, if the laser is small and the bleached fluorescent material cannot be replaced like, for example, by circulating the dye solution through the cavity of dye laser or by natural diffusion. It is therefore of vital importance to design an optical gain material that can: (i) dissolve well in liquid crystals, (ii) has high optical gain and (iii) does not bleach under realistic number of excitation cycles, which is typically >1012.
The optical gain of a particular material is conveniently measured using the Amplified Spontaneous Emission (ASE) [Citation18,Citation19]. In a typical ASE experiment the illuminating light is shaped into a thin stripe of variable length, hence the method is known as the variable stripe length method (VSL). The stripe of light is illuminating the optical gain material that is usually deposited in a form of a thin layer on a substrate, and the excitation light is usually absorbed in a few micrometre thin surface layer. The fluorescent light that emerges from the edge of the illuminated stripe is measured as a function of the stripe illumination intensity and length. The photo-stability, i.e. resistance against photo-bleaching, is yet another vital parameter to characterise the optical gain medium, which is the measure of given optical gain material/fluorophore to withstand cycles of emission (bright excited state) and absorption (dark ground state) without irreversible damage.
The aim of this article is two-fold: (i) First, we want to measure and compare the magnitude of optical gain coefficient in different materials, but keeping the method, the setup and the parameters of the measurement equal for all the materials under study. (ii) Second, we want to determine the emitted fluorescent intensity as a function of the number of excitation pulses for all materials under study, keeping the method, the setup and the experimental parameters equal for all the materials studied. It is not our aim to explore or comment on the mechanism of photo-bleaching, as this has been extensively discussed in the literature over the past 50 years. It is also not our aim to study lasing using these materials, as this is the aim of ongoing studies that will be published in near future.
In this article we present optical gain measurements from: (i) different fluorescent dyes, dissolved in planar aligned 5CB liquid crystal, (ii) quantum rods (QRs) and quantum dots (QDs) deposited on glass, (iii) perovskite nanoparticles deposited on glass, (iv) fluorescent silica nanobeads deposited on glass, (v) anthracene nanoplatelets in different solvents or organic matrices and (vi) nitrogen vacancy NV nanodiamonds deposited on glass and NVN nanodiamonds in water dispersion. In addition to the ASE, we perform extensive measurements of photo-bleaching of different organic dyes and compare to bleaching of organic and inorganic polariton materials and nanodiamonds. We conclude that room temperature inorganic polaritons are superior in terms of photo-stability and optical gain, which is much lower for fluorescent dyes. Finally, we find that nanodiamonds are far superior in terms of practically negligible photo-bleaching beyond the 1010 illumination pulses, while demonstrating modest optical gain.
2. Materials and sample preparation
2.1. Laser dyes
Laser dyes have traditionally been used as high optical gain material with good and selective solubility in different solvents and extremely high brightness. While direct use of organic dyes in high power tuneable dye lasers has been abandoned, they are heavily used in fluorescent imaging. Their main disadvantage is high susceptibility to photo-bleaching, thereby fluorescent intensity compensation due to bleaching has to be considered during imaging. For this study we have chosen laser dyes Pyrromethene 567, Pyrromethene 580, Pyrromethene 597, Pyrromethene 650, 4(Dicyanomethylene)-2-methyl-6-(4-dimethylaminostyryl)-4 H-pyran (DCM) and Nile Red (NR), with some properties listed in . Nematic liquid crystal 4-Cyano-4'-pentylbiphenyl (5CB, Nematel GmbH & Co. KG, Mainz) is used as a host, and organic dyes are readily dissolved in a typical nematic liquid crystal host up to ~2 wt%. We have chosen rather low mass concentration of dyes in 5CB, typically ~0.25 wt%. Dyes were dissolved directly in the isotropic phase of the nematic LC at the temperature of 50°C for 15 minutes, while mixing with mechanical vortex shaker and by applying intense ultrasound. The LC-dye dispersion was centrifuged before the experiment to sediment the undissolved dye crystals, and care was taken not to introduce dye particles into the LC cells. LC-dye mixture was filled in the planar cell used in all the experiments. The cells were made of two 0.7 mm glass slides coated with polyimide SE-5291 (Nissan Chemical) and unidirectionally rubbed to obtain good planar alignment of 5CB. The thickness of all LC cells was kept constant at 19 ± 1 µm for all ASE a photo-stability experiments.
Table 1. Summary of the fluorescent properties of organic dyes used in this study.
2.2 Room temperature exciton-polariton semiconductor nano-crystals, quantum dots, fluorescent beads and nanodiamonds
While fluorescent organic dyes are readily dissolved in nematic LCs, the problem of dispersing tens of nanometre-size particles in nematic LCs is much more complex due to the aggregation of particles. Namely, any colloidal inclusion larger than some tens of nanometres that is placed in a nematic liquid crystal, exhibits long range attractive forces to neighbouring particles due to the elastic distortion of the LC around each inclusion. This results in strong and rather fast aggregation of dispersed particles, leading to formation of clusters. For example, it has been shown that even 22 nm silica particles dispersed in 5CB get aggregated after some time and the growth of aggregates is self-amplified as the clusters grow [Citation20–22]. It is therefore expected that aggregation of nanocrystals, quantum rods and dots dispersed in a nematic LC is a serious problem in nematic. It has been shown that in some cases this aggregation can be prohibited by adding gelators to the LC thus forming a nematic gel [Citation23]. To avoid problems with fluorescent particles aggregation in 5CB, we measured optical gain of a thin layer of solid particles deposited from solution on glass.
Exciton-polariton materials exhibit hybridisation of excitons with confined light modes [Citation24] and are promising for the realisation of low threshold lasing due to their high-optical gain reported in the literature [Citation25]. While organic semiconductors sustain polaritons at room temperature and have been extensively studied for room temperature polariton devices, there is little information on their performance in terms of photo-bleaching. In our studies we were using organic semiconductor Anthracene (Sigma-Aldrich), and organic semiconductor perovskite CsPbBr3 and CsPbI3 nanoparticles (Mesolight). In addition to organic exciton-polariton materials, we studied fluorescent silica nanobeads (hiQ nano) as inorganic polariton materials. We also measured optical gain and photo-bleaching on thin layers of inorganic semiconductor CdSe/CdS quantum rods (Sigma-Aldrich), CdSe/ZnS quantum dots (Sigma-Aldrich), Fluorescent NV nanodiamonds (Nitrogen vacancy >900 NV/particle, Sigma-Aldrich) and green fluorescent NVN nanodiamonds (Adámas Nano). Some of the material properties are summarised in . A known concentration of particles is dispersed in organic solvent (hexane/toluene/methanol). To ensure homogenous distribution of particles, each dispersion was ultrasonicated for 5 minutes. Thin films of dispersed materials are prepared by drop casting 20–30 μl of dispersions on glass surface to get nearly uniform dry film. In all cases, except for the NV nanodiamonds, the deposited and dried film showed characteristics of a crystalline layer, indicated by regular and straight defect lines across the film. Particle size and particle concentration are given in . NVN nanodiamonds were studied in water dispersion that was introduced in a 7 μm thick glass cell.
Table 2. Summary of fluorescent properties of solid-state nanoparticles and nanocrystals used in this study. The particle composition, size, concentration, surface functional group and quantum yield were provided by supplier.
3. Experimental
3.1. Methodology
Optical gain coefficient (g) quantifies the amount of light, amplified per unit length, as it propagates through excited gain medium. ASE emission from different dyes in planar aligned nematic LC host 5CB is measured by the Variable Stripe Length method (VSL) [Citation19,Citation26,Citation27]. This method involves the detection of single-pass amplified light, emitted along the thin slab of an optically excited matter and was developed by Shaklee and Leheny in 1971 [Citation19]. In the VSL method a stripe-shaped beam is illuminating the surface of optical gain material, such as a crystal surface or a cell filled with solution of fluorescent dyes. The depth of the excited region is usually quite small, i.e. of the order of few micrometres. Spontaneous fluorescence is amplified by stimulated emission, as the emitted light passes through the excited volume to the edge of the optical gain material. The stripe therefore acts as an optically pumped waveguide. If the spontaneous emission is isotropic and uniform in the excited volume, the intensity of the amplified light in the small gain model [Citation18], exiting from the edge of the illuminated stripe is:
Here A is the cross-sectional area of the excited volume, Is is the spontaneous emission rate per unit volume and g is the net gain experienced by light, g=g'-α, where g' is the gain due to stimulated emission and α is the optical loss. L denotes the stripe length. From the ASE intensity as a function of stripe length at constant surface energy density (fluence) of the excited light, the optical gain can be determined [Citation19]. The stimulated emission is detected from the nearly exponential increase in the detected intensity, when the length of the excited stripe is increased. This is most easily seen in log-lin plot of IASE as a function of L, where the slope of the linear part of the curve indicates the optical gain parameter g, see in Ref. [Citation15]. It is also clear that by increasing the surface energy density of the excitation light, the optical gain parameter increases. It is therefore of vital importance to keep all experimental parameters (such as the fluence of excitation light) constant, when comparing optical gain of different materials in different experiments.
The choice of stripe length is very important in the VSL method, and, based on the literature data [Citation26], we chose 1.4 mm as the maximum stripe length. Apart from the dependence on stripe length, the ASE-VSL measurements were carried out with different stripe beam polarisation, and pump power density. Polarisation of the excitation beam is important for the ASE experiments on fluorescent dyes dissolved in nematic liquid crystals. It is well known that the majority of dye molecules align their radiating dipoles with respect to the local direction of LC molecules. Most of dyes align their radiative dipoles along the direction of LC alignment, also called the director. There are some exceptions, which align their radiative dipoles perpendicular to the director. Polarisation of the excitation light should not be relevant for effectively spherical particles, while it could be relevant for Quantum Rods (QRs) due to their elongated shape.
3.2. Experimental set-up
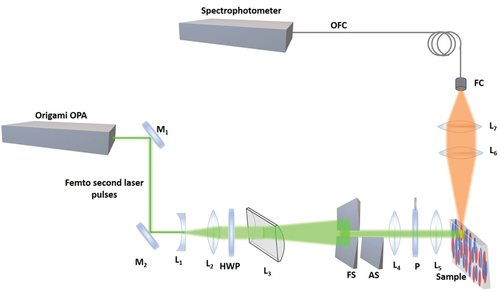
The ASE measurement setup that we used in our experiments is schematically shown in . The setup uses a tuneable 300 femtosecond laser ORIGAMI XP (NKT Photonics) that can be tuned in the UV, visible and IR, and provides variable repetition rates from single shot up to 100 kHz to illuminate the optical gain material. The laser beam was first expanded using a combination of a plano-concave lens L1 and double convex lens L2 to get a 5 mm diameter Gaussian beam. A cylindrical lens L3 with a focal length of 150 mm is used to create a thin stripe of light in the focal plane of this lens, i.e. along the cylindrical axis. The divergence of this stripe of light is several degrees. A fixed slit FS of dimensions 2 × 15 mm was placed in the focal point of lens L3 to create a fixed stripe of light with length of 10 mm. This fixed slit was used to select the nearly uniform intensity region of the stripe from the Gaussian profile of the incident beam. A variable slit AS, mounted on a precision linear stage was placed at a separation of ~3 mm from the FS to control the stripe length in horizontal direction. The length of this stripe could be controlled with a precision of 5 μm. A combination of convex lenses L4 and L5 were put at a distance of 195 mm from FS to minimise the diffraction effects from the slits. This set of lenses produced an image of the light stripe on the surface of the measuring sample. The dimensions of this light stripe were 1.4 mm (maximum length) × 0.1 mm (constant width). In this way the thin stripe of light illuminates the sample and excited the fluorescence. The stripe was set horizontally (parallel to the optical table) and the plane of polarisation of the illuminating stripe was changed either parallel or perpendicular to the stripe using a half-wave plate HWP polarisation rotator. Another polariser P was used to precisely define the plane of polarisation. A combination of two convex lenses was used to focus the fluorescent emitted light, emitted from the edge of the sample, into the tip of the collecting fibre (step-index multimode, with 105 μm silica core, 0.22 NA, wavelength range 400–2400 nm (Low OH)). A green filter F1 (notch filter, 532 nm) was used to remove the signal of the excitation beam, which was reflected from the glass edges of the LC cell. In the experiment, ASE light was collected from the edge of the fluorescent layer, i.e. the axis of the collecting optics was parallel to the illuminated stripe of fluorescent molecules. The ASE signal was coupled to CCD imaging spectrophotometer (Andor, Newton EMCCD, Czerny-Turner spectrograph) through a multimode fibre optic cable (step-index multimode, with 105-micron silica core, 0.22 NA, wavelength range 400–2400 nm (Low OH)).
Figure 1. (Colour online) Schematic diagram of the experimental setup for ASE orientation measurements. The plane of polarization is rotated with a half-wave plate (HWP). M1, M2 dielectric mirrors, L1 – L7 lenses, HWP – halfwave plate (@532nm), P – polarizer, FS – fixed slit, AS – Adjustable slit, FC – fibre coupler.
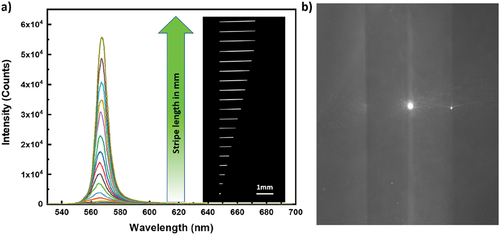
shows images of the fluorescent stripe with a variable length. For maximum length of 1.4 mm, the illuminated surface area on the sample is ~0.0014 cm2. For a typical pulse energy of ~1 μJ, the surface energy density at the sample is ~710 μJcm−2. Single pulse duration of Origami OPA is 300 fs, which gives peak power density of ~2.4 GW/cm2 during ~1 μJ pulse illumination. The light is collected from the left-hand side edge of the stripe. shows the spectra of collected ASE light from the ~3 µm thick film of 5CB mixed with Nile red.
Figure 2. (Colour online) Typical ASE measurement. (a) The ASE intensity is measured for Pyrromethene 567, dissolved in 5CB at different stripe lengths of the excitation beam. The width of the stripe is 50 ± 5µm. On the left are the ASE spectra, collected from the edge of the LC cell for different stripe lengths. On the right is monochrome image of increasing stripe length. (b) Side-view of the ASE light emitted from the side of the sample. The bright spot in the centre is the ASE light exiting the illuminated stripe. On the left and right of this bright spot there are two glass slides (vertical on this picture) of thickness 700 μm, placed parallel at a separation of 20 μm. This gap between the two plates is filled with LC and fluorescent dye and appears slightly brighter than glass plates.
4. Results and discussion
4.1. Optical gain
4.1.1 Optical gain of organic fluorescent dyes in a LC
The polyimide rubbing on the surfaces of the measuring cells gives unidirectional planar orientation of the nematic 5CB liquid crystal. All the dye molecules used in the work are rod-like, so they are expected to align along the nematic director. This means that dye molecules are most strongly excited, if the polarisation of the excitation light is parallel to the rubbing direction, i.e. parallel to the radiative electric dipole. The emission from the transition dipole of the dye molecule is expected to be maximal in a perpendicular direction to the radiative dipole and is therefore spatially anisotropic due to the alignment of dye molecules along the LC director.
We first investigate the emission intensity for various pump beam polarisation with respect to the orientation of LC director (and dyes). As shown in the insets to , four different orientations of director and pump polarisation with respect to the light stripe are used: (a) the director and direction of polarisation are parallel to stripe, (b) the director is perpendicular to the stripe and polarisation (c) the polarisation of light is perpendicular to the director and light stripe, and (d) both the director and the direction of polarisation are perpendicular to the light stripe.
Figure 3. (Colour online) (a–d) The orientation dependence of ASE emission spectra from 5CB+ PM 580 dye for different stripe length in a 19 μm thick planar cell. Here the green line represents the stripe beam, the green arrow represents the direction of polarization and the blue ellipsoid represents the LC orientation (director of LC or the rubbing direction). The excitation wavelength is 532 nm, 300 fs pulse with energy of 30 µj per pulse and the ASE light is collected from 40 pulses at a repetition rate of 10 Hz. The different colour spectrum corresponds to different stripe lengths from 0–1.4 mm, as shown in the legends for each panel.
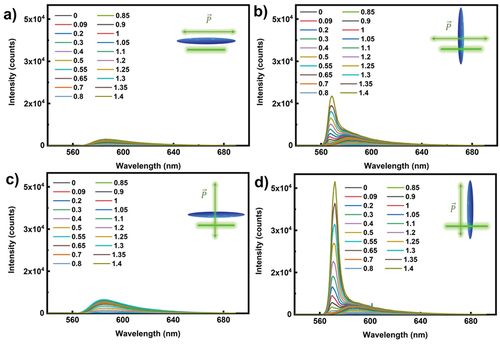
shows the polarisation-dependent ASE spectra for two different orientations of PM580 with respect to the light stripe direction (parallel and perpendicular). As evident from , for the three orientations in panels (a–c), the ASE intensities are quite low, and the emission spectra appear quite broad. When the pump beam polarisation is parallel to the director and both are perpendicular to the stripe, a strong ASE peak appears, as shown in . By increasing the stripe length (shown by different colours), the emission peak narrows, which is a clear indication of enhanced optical amplification by stimulated emission. Namely, the optical gain depends on the wavelength, g (λ), and by increasing amplification, certain wavelengths are strongly amplified, which results in narrowing of the emitted ASE spectrum. It is interesting to note that in addition to a single and broad ASE peak at small stripe lengths, another ASE peak emerges at intermediate stripe lengths and becomes dominant at large stripe lengths, see . To clarify this, we performed similar ASE experiments on 0.25 wt% PM 580 dissolved in index matching microscope oil. The ASE spectrum of PM 580 in the isotropic oil shows only a single and rather broad fluorescent peak. This could be explained by considering orientational ordering of dye molecules in the NLC. Whereas in a NLC, the PM 580 molecules are obviously ordered along the director, they are completely orientationally disordered in an isotropic oil. This clearly points out that the two ASE peaks are due to orientational order of PM 580 molecules in a NLC. We conjecture that the PM 580 molecules have two radiative moments or two excited states that have different optical gain and different emission wavelengths. In an isotropic oil, the emitted spectra is time and space-averaged, which results in a single and broad fluorescent emission peak. In 5CB, the two emitters of an aligned PM 580 molecule give two different optical amplification factors, depending on the quantum mechanical properties of electron orbitals of the PM 580 molecule.
A similar response is obtained for PM 567, PM 597, PM 650, DCM, and Nile Red dissolved in 5CB. The strong ASE emission for pump beam polarisation along the director can be understood in terms of the transition dipole moment direction of dyes. The emission of light is highest in the plane, perpendicular to the emitting dipoles; hence we obtain maximum light amplification, when this emitted light travels along the stripe and amplifies itself. However, there is one exception, as the isomeric dye pyrromethene 597 shows different polarisation dependence on ASE emission [Citation28]. Strong ASE is obtained nearly for all polarisations and director orientation with respect to the stripe. This can be attributed to the nearly symmetric molecular structure of this dye, and, for a given polarisation direction, some of the dipoles are contributing to the ASE signal.
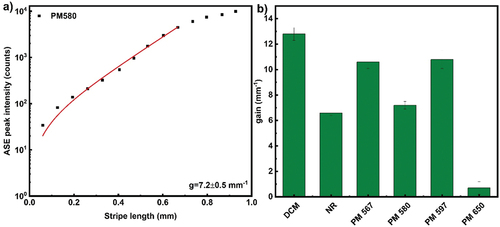
Because the ASE intensity from dyes in LCs depends upon the orientation of the director with respect to the light stripe and polarisation, the stripe length-dependent ASE intensity was measured in a configuration, where the ASE intensity is maximum. For all dyes except PM 597, the director is set perpendicular to the light stripe and the polarisation of excitation light is set parallel to the director. In this case the radiating dipole of dye is most strongly coupled to the incoming light and the direction of fluorescent emission is directed along the light stripe, i.e. along the direction of maximum stimulated emission. The single pulse pump energy was set well above the ASE threshold, which made the measurement of the optical gain value reliable and accurate [Citation18,Citation19]. All measured ASE data follow an exponential increase of the intensity with increasing stripe length, which is a clear indication of ASE mechanism [Citation19] and the example of Pyrromethene 580 dye dissolved in 5CB is presented in . The data are presented in log-lin graph, where the data should follow the linear line for long stripe lengths according to small gain model. At very long lengths (L > 1 mm) the ASE peak intensity becomes saturated and the upper limit of the fitting region was chosen at around~0.6 mm, until the intensity still increasing exponentially. On the other side, at very short stripe lengths, there is an error due to: (i) inaccurate determination of the zero of L, i.e. stripe length, (ii) inaccuracy in positioning the stripe with respect to the edge of the glass cell, and (iii) scattering of light of the stripe on imperfections at the cut edge of the glass. The measured ASE intensity at short lengths does not follow the Eq.1, because the origin of this light is not entirely due to ASE.
Figure 4. (Colour online) Optical gain parameter extraction from stripe length-dependent ASE peak intensity for (a) 5CB + Pyrromethene 580 dye in 19-micrometer thick cell at 1khz repetition rate and geometry as described in . The solid line corresponds to the small signal gain model. The data points are ASE peak intensity integrated for 1000 pulses taken at a wavelength of 567 nm. The extracted optical gain parameter is 7.2 ± 0.5 mm−1. (b) Optical gain parameter extracted by small signal gain model for different dyes (5CB+ dye) in 19-micron thick cell. ASE intensities were integrated over 1000 pulses of 532 nm, 300 fs pulses with energy 0.25 µJ per pulse and the repetition rate of 1 kHz. The concentration of all dyes in 5CB were 0.25 wt%. The peak power density of light stripe was 0.604 GW/cm2.
We have carefully analysed the influence of the fitting procedure on the value of the optical gain parameter g, as obtained by fitting the measured data to the Equation (1). Several works have pointed to the rather large error and scattering of the g-values (tens of %), especially with respect to the range of the fitting interval [Citation26,Citation29]. While the lower end of the fitting interval of stripe lengths L has little influence on the obtained g-value, the upper end of the fitting interval can significantly alter the obtained g-value. We have therefore determined the upper end of the fitting interval as a point, where the measured data start deviating from the exponential growth in the lin-log plot. We have also slightly shifted the zero of the x-axis in the experimental data, to compensate for the optical irregularities at the cell’s edges. This has minor effect on the quality of the fit, as the signal is very weak at short stripe lengths and is of minor statistical relevance. This has been done for all the fitted ASE experimental data sets.
The optical gain parameters were extracted from ASE experiments for different organic dyes dissolved in 5CB, and are presented in . It should be noted that the concentration of all studied dyes in 5CB were equal. Optical gain and photostability values, measured for 0.25wt% of dye dispersed in planar aligned 5CB, are shown in .
Table 3. Summary of fluorescence parameters and bleaching properties of organic dyes. Optical gain and photostability values are measured for 0.25 wt% of dye dispersed in planar aligned 5CB matrix. The excitation source is 532 nm, 300 fs pulse with power density 0.604 GW/cm2 in all experiments.
4.1.2. Optical gain of organic polariton material – anthracene
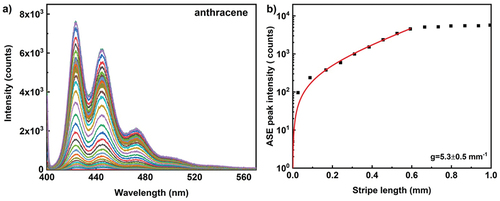
Room temperature polariton lasing in an organic single crystal microcavity at lower threshold than conventional photon lasing was reported by Cohen et al. [Citation30,Citation31]. In this study we used anthracene, a semiconductor organic polariton material as optical gain material. Anthracene is a solid polycyclic aromatic hydrocarbon consisting of three benzene rings, and is the simplest tricyclic aromatic hydrocarbon. Anthracene layer on glass substrate was prepared by drop casting of 2 wt% anthracene dispersion in toluene. To prevent the deposition of undissolved crystals the dispersion is centrifuged before drop casting. The evaporation of toluene resulted in polycrystalline thin film of anthracene, with nearly homogenous layer thickness. To investigate the optical gain, 400 nm wavelength 300 fs pulses with energy of 81 nJ per pulse at a repetition rate of 10 kHz were used to excite the material. The pump beam was linearly polarised perpendicular to the illuminating stripe. shows the evolution of two prominent anthracene emission peaks with increasing stripe length and each spectrum corresponds to emission intensity integrated over 10.000 excitation pulses. The intense emission peak appears at 423 nm and a secondary peak with lower emission intensity appears at 445 nm due to the Davydov splitting that arises from having two inequivalent molecules in a single unit cell [Citation32]. Depending upon the type of the molecular aggregates being J-type or H-type, the emission peak intensity is dominated by primary or the secondary peak [Citation33]. As evident from higher intensity primary peak (), the J-type aggregates are prominent in anthracene molecular crystals than H-type. We used the most intense ASE peak at 423 nm to extract the optical gain parameter. presents the ASE peak intensity at 423 nm at single pulse pump fluence of 0.576 µJ/cm2 (peak power density of 0.192 GW/cm2), for different stripe lengths. The extracted gain coefficient is 5.3 ± 0.5 mm−1. In comparison with gain coefficient from single crystal anthracene film reported in the literature (~2 mm−1 at pump fluence of 43 µJ/cm2) [Citation30], the polycrystalline anthracene film shows even better gain with lower pump density.
Figure 5. (Colour online) (a) ASE emission spectra from anthracene film at 10 kHz repetition rate. The excitation wavelength is 400 nm, 300 fs pulse with energy of 81 nJ per pulse and peak power density of 0.192 GW/cm2. The ASE light is integrated over 10.000 pulses at a repetition rate of 10 kHz. Different colour spectrum corresponds to different stripe lengths from 0 – 2mm. (b) The ASE peak intensity as a function of stripe length for anthracene film at 10 kHz repetition rate. The solid line corresponds to the small signal gain model fit in the log-lin scale and thus presents an exponential increase with increasing length. Each data point represents an ASE peak intensity measured for 10.000 pulses taken at a wavelength of 423 nm. The extracted optical gain parameter is 5.3 ± 0.5 mm−1.
4.1.3. Optical gain of inorganic polariton material: perovskite nanoparticles
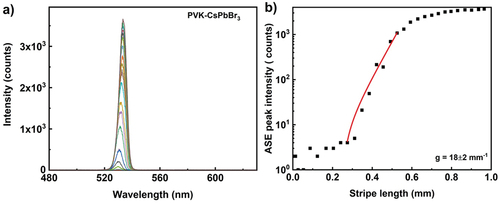
The perovskite semiconducting nanoparticles are emerging class of optical gain materials as photonic sources [Citation13,Citation34–36]. Among the perovskite materials, lead-halide perovskites are attracting significant research interest owing to their interesting photophysical properties such as high quantum yield, narrow emission bandwidth and photostability. To compare the optical gain coefficient of organic and inorganic polariton optical gain materials, three lead-halide perovskites CsPbBr3, CsPbI3 and CsPb (Br/I)3 are investigated. The typical particles are functionalised with organic layer and dispersed in toluene to have 3 wt% of particle concentration. Here the particle sizes are 18, 38 and 40 nm for CsPbBr3, CsPbI3 and CsPb (Br/I)3 respectively. The perovskite layer on the glass substrate is prepared by drop casting the dispersion in dark at room temperature. The homogenous perovskite layer was excited with 450 nm wavelength 300 fs pulses with energy of 0.167 µJ per pulse at a repetition rate of 1 kHz. The pump beam is linearly polarised in the plane perpendicular to the illuminating stripe. The emission band is narrower with peak wavelengths of 532, 684 and 631 nm for CsPbBr3, CsPbI3 and CsPb (Br/I)3 respectively. Among three perovskites investigated in this study, CsPbBr3 has highest quantum yield of 0.9, thus the ASE intensity is highest. shows ASE spectra for CsPbBr3 at 1 kHz repetition rate with peak power density of 0.53 GW/cm2. The ASE peak intensity follows linear dependence for small stripe changes and saturates. The extracted optical gain parameter using small signal gain model (in the linear region) is 18 ± 2 mm−1.
Figure 6. (Colour online) (a) ASE emission spectra from CsPbBr3 perovskite nanoparticle film. The excitation wavelength is 450 nm, 300 fs pulse with energy of 0.16 µj per pulse and the ASE light is collected from 1000 pulses at a repetition rate of 1 kHz. Different colour spectrum corresponds to different stripe lengths. (b) Optical gain parameter extraction from the exponential ASE peak intensity as a function of stripe length. The solid line corresponds to the small signal gain model fit in the log-lin scale and thus presents an exponential increase with increasing length. The scattered data points are ASE peak intensity measured at wavelength of 532 nm. Extracted optical gain parameter is 18 ± 2 mm−1.
4.1.4. Optical gain of quantum dots and quantum rods
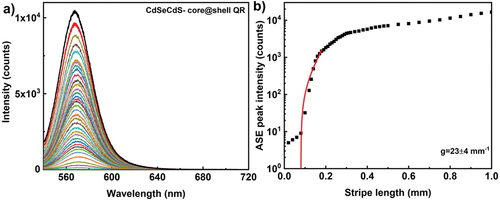
Here, we compare optical gain coefficient of quantum dots (QDs) and rods (QRs). To investigate the optical gain, 30 µl of fluorescent nanomaterial dispersion is drop casted on glass substrate in all cases. The solvent evaporated at room temperature, resulting in thin film of nanoparticles. Typical area of the dried film is ~20 mm2, whereas the illuminating stripe area is ~0.14 mm2, and can be considered as homogenous. shows the ASE spectra as function of stripe length from CdSe/ZnS core-shell quantum dot film, prepared by drop casting CdSe/ZnS dispersion with particle size 6.8 nm and 0.5 wt% (~3 × 10¹⁵ particles per ml). The thickness of dried films was measured using an Atomic Force Microscope (AFM) and it was in the range 5–8 μm. For excitation wavelength of 532 nm, 300 fs pulse with energy of 0.17 µJ per pulse at a repetition rate of 50 kHz, the ASE intensity appears at ~570 nm. In comparison with the high particle concentration of the dispersion used to prepare QD/QR films, the measured lower ASE intensity is due to the fraction of quantum dots excited, which is ~650 × 109 particles (at maximum stripe length, assuming homogenous distribution of particles in dried film, typical particle concentration in whole illumination area). As evident from , the peak intensity saturates at a stripe length of 0.5 mm and the exponential dependence of intensity is for short stripe lengths. The extracted optical gain parameter is 30 ± 3 mm−1. Quantum rods, at similar particle concentrations and pumping conditions, the ASE peak appears at 577 nm and the exponential dependence of emission intensity observed for similar stripe lengths compared to quantum dots. The gain coefficient for CdSe/CdS quantum rod is 23 ± 4 mm−1 (), though the quantum yield is relatively higher for quantum rods (>0.7) than quantum dots (>0.5), similar gain coefficient may attribute to the structural anisotropy of quantum rods. The anisotropic non-spherical luminescent nanocrystals are known to emit linearly polarised light and the emission depends on the orientational ordering of rods, with respect to the pump beam polarisations [Citation37]. We should note that the measured value of g depends upon the optical quality of the deposited film. For this reason, high quality areas of the film should be selected prior to the ASE measurements.
Figure 7. (Colour online) (a) ASE emission spectra from CdSe/ZnS core shell quantum dot film. The excitation wavelength is 532 nm, 300 fs pulses with energy of 0.17µj per pulse and the ASE light is collected from 50.000 pulses at a repetition rate of 50 kHz. Different colour spectrum corresponds to different stripe lengths. (b) Optical gain parameter extraction from the exponential ASE peak intensity as a function of stripe length. The solid line corresponds to the linear/small signal gain model fit in the log-lin scale. The scattered data points are ASE peak intensity measured at wavelength of 570 nm. The extracted optical gain parameter is 30 ± 3 mm−1.
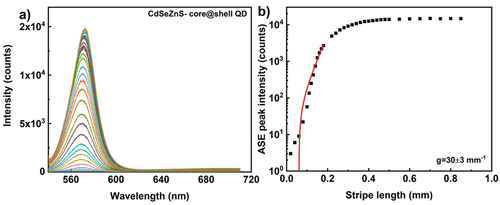
Figure 8. (Colour online) (a) Ase emission spectra from CdSe/CdS core shell quantum rod film. The excitation wavelength is 532 nm, 300 fs pulses with energy of 0.17µj per pulse and the ASE light is collected from 50.000 pulses at a repetition rate of 50 kHz. Different colour spectrum corresponds to different stripe lengths. (b) Optical gain parameter extraction from the exponential ASE peak intensity as a function of stripe length. The solid line corresponds to the small signal gain model fit in the log-lin scale. The scattered data points are ASE peak intensity measured at wavelength of 577 nm. The extracted optical gain parameter is 23 ± 4 mm−1.
4.1.5. Optical gain of nanodiamonds
Nanodiamonds attracted considerable research interest in the recent years, owing to their large optical bandgap, which provides many potential electronic, optical and thermal applications [Citation38–40]. Diamond has a unique combination of properties that is not found in any other material [Citation41,Citation42]. Nanodiamonds are provided in a powder form of diamond nanoparticles with nitrogen vacancy centres, of different sizes and in a form of a dry powder or water dispersion. We have studied two different types of nanodiamonds, the NV nanodiamonds and NVN nanodiamonds. They both act as fluorescent emitters-colour centres, but they are different in terms of the structure, the excitation wavelength and the emitted fluorescence peak wavelength. NV nanodiamonds have a single nitrogen (N) vacancy centre (NV)- that absorbs strongly at ∼560 nm and efficiently emits fluorescence at ∼700 nm (deep red) [Citation42]. NV nanodiamond films on the glass substrate were prepared by drop-casting fluorescent nanodiamonds dispersed in acetone. The thickness of these films measured by the AFM is around 2 μm and the surface is only 50% covered with diamonds. For this reason, we also performed ASE experiments on water dispersion of NVN nanodiamonds. These materials have a vacancy that is formed around two N atoms in close proximity, and they emit the fluorescent light in green part of the spectrum. We used commercially available Carboxylated nanodiamonds containing NVN centres with green fluorescence from synthetic type Ib diamond in DI water, the average particle size of 120 nm (Adámas Nano) in the optical gain measurements. The dispersion appears as a milky liquid, strongly scattering ambient light because of the large refractive index of a diamond. The water-based dispersion is filled in a 7 μm thick cell and excited with 488 nm, 300 fs pulse of energy 30 nJ, and the repetition rate was 100 kHz. The optical quality in terms of homogeneity of optical gain centres is expected to be much better compared to dried NV films.
presents the ASE emission peak as function of stripe length from nitrogen vacancy (>900 NV/nano-particle) type aminated (e.g. functionalized by amine) fluorescent nanodiamond film (particle size 100 nm). The film was excited with 532 nm, 300 fs pulses of single pulse energy of 70 nJ and at a repetition rate of 100 kHz. Compared to polariton particles, nanodiamonds are relatively less bright, because of low volume concentration of NV centres. An increased brightness has been reported by taking larger particle size and defect concentration [Citation43,Citation44]. The ASE spectra are shown in , and correspond to an emission from 105 pulses. The optical gain parameter extracted from the ASE curve in is g ~ 5 ± 1 mm−1. The pumping conditions (wavelength and power), particle concentration, emission wavelength and measured optical gain parameter for different solid state materials are summarised in .
Figure 9. (Colour online) (a) ASE emission spectra from NVN fluorescent nanodiamond film. The excitation wavelength is 532 nm, 300 fs pulses with energy of 70 nJ per pulse and the ASE light is collected from 100.000 pulses at a repetition rate of 100 kHz. Different colour spectrum corresponds to different stripe lengths. (b) Optical gain parameter extraction from the exponential ASE peak intensity as a function of stripe length. The solid line corresponds to the small signal gain model fit in the log-lin scale and thus presents an exponential increase with increasing length. The scattered data points are ASE peak intensity measured at wavelength of 670 nm. Extracted optical gain parameter is 5 ± 1 mm−1. (c) ASE emission spectra from Green FND (NVN centres) fluorescent nanodiamond dispersion. The excitation wavelength is 488 nm, 300 fs pulses with the energy of 30 nJ per pulse, and the ASE light is collected from 100.000 pulses at a repetition rate of 100 kHz. Different colour spectrum corresponds to different stripe lengths. (d) Optical gain parameter extraction from the exponential ASE peak intensity as a function of stripe length. The solid line corresponds to the small signal gain model fit in the log-lin scale and thus presents an exponential increase with increasing length. The scattered data points are ASE peak intensity measured at a wavelength of 513 nm. Extracted optical gain parameter is 16 ± 2 mm-1. L0 is set as 0.01 mm.
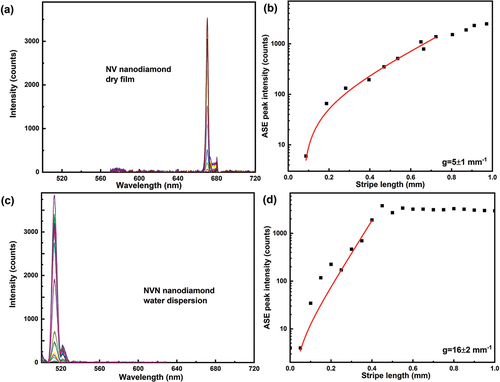
Table 4. Summary of fluorescence parameters and photo bleaching properties of QDs, QRs, room temperature polaritons and NV diamonds. Optical gain and photostability values are measured in dried films. If the photostability is described by two decay processes, both half-life numbers and their relative contributions are presented.
shows the broad fluorescent emission spectra from water dispersion of NVN nanodiamonds, with a peak emission of ~513 nm. , shows ASE peak intensity at 513 nm as a function of stripe length. Each data point corresponds to emissions from 105 pulses. Compared to dried NV-type red fluorescence diamond film, the NVN-type green fluorescence nanodiamonds in dispersion, have a higher optical gain of 16 mm−1.
4.1.6 Fluorescent silica nanobeads
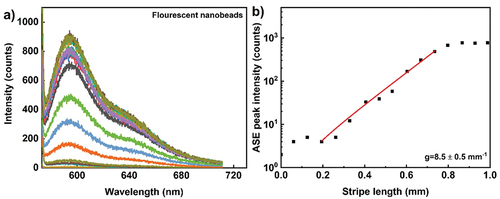
We have used commercially available monodispersed fluorescent nanobeads with average particle size of 25 nm (Atto 565, Hiq-Nano). Carboxylic acid group functionalised water-based dispersion of red fluorescent nanobeads is drop casted on glass slide, to make homogenous dry film. The film in excited with 570 nm, 300 fs pulse of energy 88 nJ, peak power density of 0.208 GW/cm2 and the repetition rate was 50 kHz. Broad fluorescence emission is observed with peak emission ~590 nm (). , shows ASE peak intensity at 590 nm as function of stripe length. Scattered data corresponds to emission from 5 × 10⁴ pulses. Compared to quantum dots and rods, silica nanobeads have higher optical gain 8.5 mm−1. However, the broader ASE band and emission intensity is lower (lower quantum yield) compare to other nanoparticle optical gain materials investigated.
Figure 10. (Colour online) (a) ASE emission spectra from dyed silica nanoparticle film. The excitation wavelength is 570 nm, 300 fs pulses with energy of 88.2 nJ per pulse, peak power density of 0.208 GW/cm2 and the ASE light is collected from 50.000 pulses at a repetition rate of 50 kHz. Different colour spectrum corresponds to different stripe lengths. (b) Optical gain parameter extraction from the exponential ASE peak intensity as a function of stripe length. The solid line corresponds to the small signal gain model fit in the log-lin scale and thus presents an exponential increase with increasing length. The scattered data points are ASE peak intensity measured at wavelength of 590 nm. Extracted optical gain parameter is 8.5 ± 0. 5 mm−1.
4.2. Photostability
4.2.1 Photostability of fluorescent dyes, polariton materials and nanomaterials
The photo-stability of an optical gain material was determined by measuring the single pulse peak emitted fluorescence as a function of the number of excitation pulses with predetermined energy per pulse. Depending upon the pumping conditions (pulse energy and duration, stripe length) and the intrinsic properties of optical gain medium, the excess energy delivered during the excitation process results in photo-bleaching. This means that the intensity of emitted fluorescent light diminishes with the number of excitation pulses. It is well known that each fluorophore/polariton can be photo-bleached after certain number of excitation-emission cycles [Citation45,Citation46]. Different methods were established to characterise the photo-stability, (i) measuring the amount of energy deposited to the medium before its luminescence or lasing intensity reduced to half of the initial value, (ii) quantifying the average number of photons emitted by a molecule till it photobleaches (iii) measuring the photo-degradation rate (photobleaching half-life). Here we quantify the photo-stability by measuring the photo-bleaching half-life in terms of the number of applied excitation pulses of fixed energy. The photo-bleaching half-life number is therefore the number of excitation pulses needed to reduce the emission peak intensity to one-half of the initial intensity.
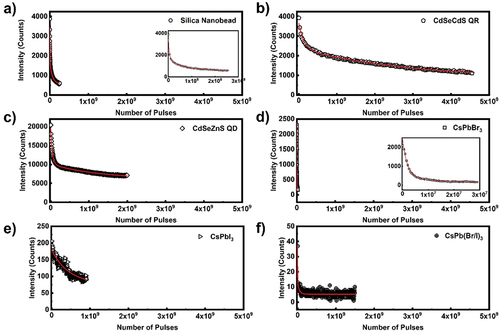
We have determined the photo-stability of all the discussed materials by continuously measuring ASE peak intensity from samples at stripe length 1.40 mm over period of time at given pump energy and fixed repetition rate. In all cases studied, except for nanodiamonds, the emitted fluorescence light intensity decays over time. In the continuation, we discuss each material in more detail.
The photo-bleaching experiments in 5CB planar cells with different laser dyes, which are shown in , show a single exponential decrease of intensity over the number of pulses applied, as described by EquationEquation (2)(2)
(2) . Among the laser dyes, pyrromethene dyes exhibit the highest photo-stability. On the other hand, the photo-bleaching experiments on polariton fluorescent materials, shown in , show double exponential time-decay, as described by EquationEquation (3)
(3)
(3) :
Figure 11. (Colour online) ASE peak intensity decay for 5CB + dye in 19 μm planar cell. The excitation wavelength is 532 nm, 300 fs pulse peak power density of 0.604 GW/cm2 and the ASE peak intensity is collected for 104 pulses at a repetition rate of 1 kHz. (a–c, f) The solid line corresponds to a single exponential fit and (d, e) solid line corresponds to the double exponential decay fit.
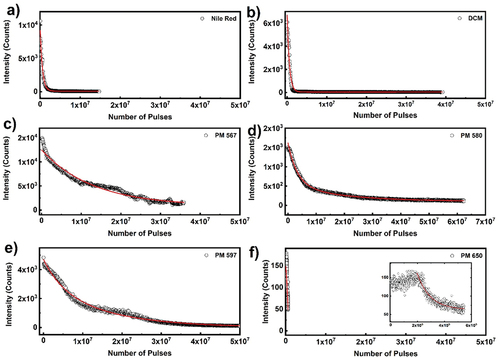
Figure 12. (Colour online) ASE peak intensity decay as a number of applied laser excitation pulses for silica nanobeads, QRs and QDs, and room temperature polariton film. The sample is excited with 300 fs pulse of different wavelength and peak power density as mentioned in . (a–d) Solid lines correspond to double exponential decay fit and (e, f) single exponential decay fit to the intensity.
Here, and
are the initial intensity and intensity after infinity numbers of excitation pulses (
).
and
are the initial intensities at which intensity each decay process starts for the two-step decay process.
,
and
are the decay constants, i.e. number of excitation pulses needed to reduce the initial intensity to
and the half-life number is calculated by
.
shows the photostability of laser dyes obtained for excitation wavelength 532 nm, power density of 0.604 GW/cm2 and the ASE peak intensity collected at a repetition rate of 1 kHz and 10 sec exposure time (each data point is collected after 104 pulses). Intensity decay of most of the dyes follow single exponential decay, except PM 580 and 597, which follows double exponential decay. As evident from the , pyrromethene dyes show slower decay compared to DCM and Nile red dyes. Among the four pyrromethene dyes investigated PM 565 has the highest half-life pulses ~107 pulses, while the half-life pulses for PM 580 and PM 597 is as low as ~6 × 10⁶ pulses. The emission intensity for PM 650 is lower than all other dyes, and the feeble intensity decays rapidly. To summarise, the pyrromethene dyes are having better photostability than other investigated dyes.
While the organic laser dyes typically show single exponential decay mode of photobleaching, the nanoparticle optical gain materials are rather different. As shown in , the intensity over number of excitation pulses show two exponential decay for silica nanobeads, QRs, QDs and perovskite CsPbBr3, while in the case of perovskites CsPbI3 and CsPb (Br/I)3 the ASE intensity is very weak and photostability can be described by one exponential decay. The most stable are QDs and QRs, where the fast decay is characterised by around 107 pulses and the slow decay lasts for around 109 pulses. Next are silica nanobeads, which have shorter half-life, around 106 pulses for faster and 108 pulses for slower decay. Among perovskites the most stable are CsPbI3 particles with half-life 8 × 10⁸ pulses, but they exhibit smaller ASE intensity. The stability of CsPbBr3 particles was also described with two bleaching processes, which are characterised with relatively fast two decay processes with half-life 106 and 107 pulses, respectively, while the CsPb (Br/I)3 particles are the least stable with decay constant of around 107 pulses. The detailed data for all nanoparticles are collected in .
4.2.2. Photostability of nanodiamonds with NV and NVN centres
One of the unique properties of fluorescent nanodiamonds are nitrogen vacancy (NV) defect centres, which act as an nitrogen ion and a lattice vacancy embedded in an inert diamond solid matrix, thereby providing an exceptional photostability [Citation42,Citation47–49]. The luminescence of the NV centre is extremely robust, with no bleaching or blinking under normal conditions. shows the time dependence (i.e. the number of applied pulses at fixed repetition rate) ASE intensity under pulsed excitation at the repetition rate of 100 kHz and 5 sec of exposure. Out of all the materials studied in this work, only nanodiamonds with NV and NVN centres show ideal photostability over 1010 applied excitation pulses. For a 100 kHz repetition rate of the excitation laser, the emitted fluorescence intensity is stable over ~24 hours of illumination (>1010 pulses), with no sign of even the slightest bleaching.
Figure 13. (Colour online) ASE peak intensity decay for NV (a) and NVN (b) fluorescent nanodiamond film. The excitation wavelength is 532 nm, 300 fs pulse with 0.16 GW/cm2 peak power density and the ASE peak intensity is collected from 670 nm emission peak, for every 5 × 10⁵ pulses at a repetition rate of 100 kHz for NV fluorescent nanodiamond film. The excitation wavelength is 488 nm, 300 fs pulse with 99.5 MW/cm2 peak power density, and the ASE peak intensity is collected from a 513 nm emission peak, for every 106 pulses at a repetition rate of 100 kHz for NVN fluorescent nanodiamond film.
4.2.3 Peak power density-dependent photobleaching of selected materials
The conventional dye lasers require intensive pulsed light excitation (pumping), so we also measured the effect of bleaching on the ASE intensity at different power densities of the pumped beam for some selected optical gain materials, PM580, CdSe/ZnS quantum dots and Anthracene.
Photobleaching of the dye depends on the pump power and dye concentration. Hence, the dye concentration, duration of pumping and repetition rate were kept the same while the pump power changed as seen in , to evaluate the photostability of PM 580 as function of the excitation power. For these experiments, pump beam polarisation was kept perpendicular to the exciting stripe, i.e. for maximum excitation and emission. shows that the emission follows single decay process and the rate of decay increases with pump power. At the low pump power density, data were fit with single exponential decay model (EquationEquation (2)(2)
(2) ). However, for higher pump power densities, intensity decay data are well described by the double exponential decay model as described in EquationEquation (3)
(3)
(3) . The parameters of the photobleaching curves are listed in . At the pump power 0.66 GW/cm2 (), 78% of the total decay is via the fast mode with half-life of 2.5 × 10⁶ pulses and the remaining 22% intensity decays via slow decay mode with half-life of 107 pulses. Though the intensity decay follows two decay modes, at low pump power (0.27 GW/cm2) both modes are equally contributing the bleaching process while at high pump power the initial fast decay mode describes the decay process.
Figure 14. (Colour online) Peak power density dependent ASE peak intensity decay for PM 580 dye in 19 µm thick planar cell of 5CB. The scattered data points are ASE peak intensity is collected from at a repetition rate of 1k Hz, with excitation wavelength is 532 nm, 300 fs pulse. The solid lines correspond to a single exponential decay (b) and double exponential decay model (c, d).
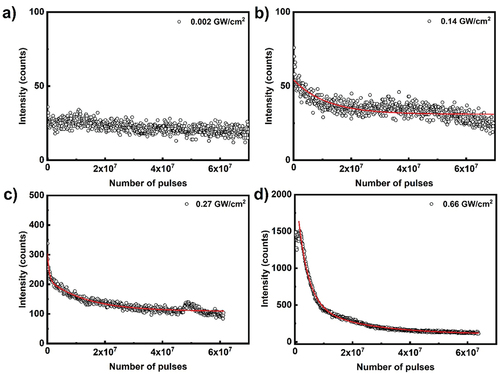
Table 5. Photobleaching parameters for PM 580.
shows the decay of the fluorescence intensity from anthracene film at different pump power densities. We found that a double exponential fit using EquationEquation (3)(3)
(3) describes well the observed decay. The sample was photobleached with 400 nm, 300 fs pulses. Except for very low pump power density of 0.002 GW/cm2 the intensity decays double-exponentially over time, indicating that there are at least two photobleaching processes. Similar double exponential decay photobleaching was observed in tetracene compounds [Citation50].
Figure 15. (Colour online) Peak power density dependent ASE peak intensity decay for Anthracene film. Scattered data points are the emission peak intensity as a function of excitation pulses, measured at different pump fluence for Anthracene film. The excitation source is Origami OPA 400 nm, 300 fs pulse with different peak power densities at 10 kHz repetition rate. The solid lines correspond to the double exponential decay as described by Equation (3).
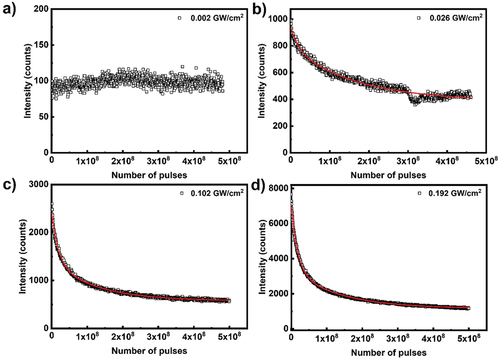
The parameters of the anthracene photobleaching curves are listed in . Regardless of different power densities, the photobleaching follows two decay modes. At the 0.026 GW/cm2, 28% of the total decay process is via the first mode (1.4 × 10⁷ pulses) and remaining 72% follows the second mode (1.2 × 10⁸ pulses). As the power density increases to 0.102 GW/cm2, the photobleaching process is predominant (56%) by the initial fast decay with half-life of 1.2 × 10⁷ pulses, followed by slow second mode with half-life off 9 × 10⁷ pulses (44%). At pump power 0.192 GW/cm2, similar intensity decay behaviour is observed, the initial intensity decays rapidly with half-life of 1.2 × 10⁷ (63%) followed by a slow second decay with longer half-life of 9.1 × 10⁷ (37%).
Table 6. Photobleaching parameters for anthracene.
shows pump intensity decay over time for CdSe/ZnS core shell quantum dot film, excited at 532 nm of 300 fs pulses. The parameters of the emission intensity fitted to double exponential decay are listed in . Similar to anthracene, quantum dot photobleaching is double exponential decay process. Among the two mode decay processes, predominant decay mode is depending on the pump power density. As evident from at high pump powers, the fast decay process dominates the photo-bleaching processes. At lower pump power, the second (slow) mode dominates, while at higher pump power the first (fast) mode dominates the decay process. At the lowest power density, around 30% of the photobleaching process is mediated by the initial fast decay with half-life of 7 × 10⁶ pulses and the remaining 70% is via second slow decay process with half-life 3 × 10⁸. When the pump power density increases to 0.5 GW/cm2, the decay process is predominated by fast decay processes (70%), with half-life of 3.5 × 10⁷ and remaining 30% is mediated by the second slow decay mode with half-life of 9 × 10⁸ pulses. At maximum pump power density of 0.71 GW/cm2 the half-life of the decay rate is comparable to 0.5 GW/cm2. However, the two-decay process half-life are 2 × 10⁷ (70%) and 4 × 10⁸ (30%) pulses.
Figure 16. (Colour online) Peak power density dependent ASE peak intensity decay for CdSe/ZnS core shell quantum dot film. The scattered data points are emission peak intensity as a function of excitation pulses, measured at 50 kHz repetition rate with excitation source Origami OPA 532nm, 300 fs pulse with different peak power densities. The solid lines correspond double exponential decay mode as described by Equation (3).
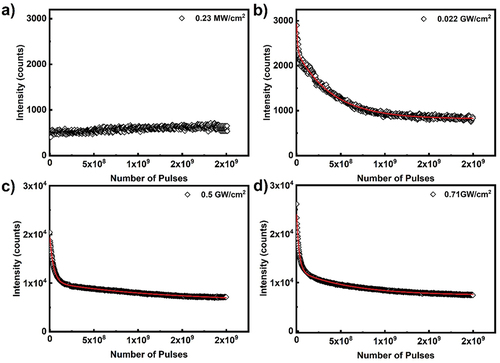
Table 7. Photobleaching parameters for CdSe/ZnS quantum dots.
Pyrromethene 580, anthracene and CdSe/ZnS quantum dots follow similar power density dependent photobleaching characteristics, the intensity decays via double decay modes. Anthracene and CdSe/ZnS quantum dots follow double decay process, the power density dependence on decay modes are same. In both cases of Anthracene and CdSe/ZnS quantum dots at lower pump power, the second (slow) mode dominate while at higher pump power the first (fast) mode dominates the decay process.
5. Conclusions
We have investigated optical gain and photobleaching of several classes of fluorescent materials: (i) organic fluorescent dyes, (ii) inorganic fluorescent materials, and (iii) NV nanodiamonds. In terms of practical application as optical gain materials for liquid crystal microlasers, fluorescent organic dyes have several important advantages. They can easily be dissolved and mixed with any LC, giving bright fluorescence and superior optical gain. However, in terms of long-term use in any practical device, where dyes would be exposed to high optical fluence, fluorescent organic dyes are not useful due to their weak photostability. This serious drawback is even more pronounced when a LC with dissolved dye is confined to a small, ~20 μm droplet, embedded in another immiscible fluid or a polymer. Our experiments show that the life time of the most stable dye pyrromethene 580 is shortened by nearly two orders of magnitude, when the material is confined into a LC droplet. This imposes serious restrictions even to laboratory studies of lasing from dye-doped LC droplets, and the repetition rate of the excitation laser has to be kept low (i.e. 1–10 Hz) to have any control over the experiment. For dye-doped LC microlasers, pyrromethene dyes offer wider emission wavelengths and are better in terms of stability compared to DCM and Nile Red dyes. Among the laser dyes DCM yields slightly higher optical gain coefficient than pyrromethene dyes, but pyrromethene dyes outperform DCM in terms of longer photostability.
In addition to dyes, optical gain parameters and lifetime were determined for an organic and few inorganic polariton materials. Though the anthracene is organic molecule like other laser dyes, it forms molecular crystals and behaves as room temperature polariton. Among the tested inorganic optical gain materials, perovskite CsPbBr3 yield the highest optical gain coefficient, but this material has rather low photostability in comparison to QDs and QRs, which are superior to any other inorganic fluorescent material, except for NV and NVN nanodiamonds.
Among all optical gain materials studied, nanodiamonds stand unique, exhibiting no change in emission intensity over time. For example, under same excitation wavelength, at relatively low excitation power (0.022 GW/cm2) ASE intensity drops to half of the initial value in ~108 pulses for CdSe/ZnS quantum dots, while nanodiamonds at pump power 0.16 GW/cm2 are photostable over >1010 pulses, showing no signs of degradation up to this number of illuminating pulses.
Finally, we should comment on the long-time fluorescence, when the gain material is exposed to a large number of very intense optical pulses. For example, it might be misleading to conclude from that CdSe/ZnS core shell quantum dots show a significant fluorescence even at very large number of applied optical pulses. The fitting parameters for the curve in panel (d) show that the baseline number of counts is ~7.300 (i.e. the photon counts for infinitely long illumination). This baseline fluorescence in panel (d) can be compared to the fluorescence in panel (a) by taking into account very different excitation power density. Whereas in panel (a) the excitation power density was 0.23 MW/cm2, the excitation power density for data in panel (d) was 0.71 GW/cm2. This is for a factor of 3.100 higher intensity, which should give ~1.500.000 emitted photons, if the sample was not bleached. In reality, we get only 7.300 photons emitted per excitation pulse. This gives us a rough estimate that only 0.4% of photon emitters have survived the very strong light irradiation. It is quite clear that CdSe/ZnS core shell quantum dots are in fact not photostable and cannot be used in laser applications, which require robustness and stable emission in very strong light.
We can safely conclude from this study that NV and NVN nanodiamonds are superior optical gain material in terms of extremely long lifetime, and they exhibit moderate optical gain coefficient. There are two potential drawbacks of NV and NVN nanodiamonds: (i) rather low fluorescent emission from these materials, which is most likely due to rather low number of fluorescent NV centres implanted into these materials. Currently, volume density of NV centres in available NV nanodiamonds is around 900 centres per particle; (ii) difficulties in obtaining well dispersed NV diamond nanoparticles in a LC, as mentioned in the introduction. However, owing to the well-defined emission and excellent photostability, nanodiamonds will most likely be a potential optical gain material for applications in soft matter microphotonic devices. This was also demonstrated in recent publications reporting optical amplification and lasing from NV nanodiamonds and diamonds [Citation51,Citation52].
Acknowledgments
This result is part of a project that has received funding from the European Research Council (ERC) under the European Union’s Horizon 2020 Research and Innovation Program (Grant agreement No. 884928-LOGOS).
Disclosure statement
No potential conflict of interest was reported by the author(s).
Additional information
Funding
References
- Mowatt C, Morris SM, Song MH, et al. Comparison of the performance of photonic band-edge liquid crystal lasers using different dyes as the gain medium. J Appl Phys. 2010;107:043101.
- Urbas AM, Jacob Z, Dal L, et al. Biomaterials in light amplification. J Opt. 2017;19(3):033003.
- Zhou CM, Pina J, Zhu T, et al. Quantum dot self-assembly enables low-threshold lasing. Adv Sci. 2021;8:1–7.
- Inoué S, Shimomura O, Goda M, et al. Fluorescence polarization of green fluorescence protein. Proc Natl Acad Sci. 2002;99:4272–4277.
- Gather MC, Yun SH. Bio-optimized energy transfer in densely packed fluorescent protein enables near-maximal luminescence and solid-state lasers. Nat Commun. 2014;5:1–8.
- Porotnikov D, Diroll BT, Harankahage D, et al. Low-threshold laser medium utilizing semiconductor nanoshell quantum dots. Nanoscale. 2020;12:17426–17436.
- Alvarado-Leaños AL, Cortecchia D, Folpini G, et al. Optical gain of lead halide perovskites measured via the variable stripe length method: what we can learn and how to avoid pitfalls. Adv Opt Mater. 2021;9(18):2001773.
- Kumar R, Raina KK. Optical and electrical control of circularly polarised fluorescence in CdSe quantum dots dispersed polymer stabilised cholesteric liquid crystal shutter. Liq Cryst. 2016;43:994–1001.
- Morris SM, Ford AD, Pivnenko MN, et al. The effects of reorientation on the emission properties of a photonic band edge liquid crystal laser. J Opt A Pure Appl Opt. 2005;7:215–223.
- Lei L, Dong Q, Gundogdu K, et al. Metal halide perovskites for laser applications. Adv Funct Mater. 2021;31:1–21.
- Ichimura M, Ishikawa K. Development of highly fluorescent distyryl dyes for liquid crystal lasers. Jpn J Appl Phys. 2019;58:0–6.
- Dietrich CP, Steude A, Tropf L, et al. An exciton-polariton laser based on biologically produced fluorescent protein. Sci Adv. 2016;2:1–8.
- Sutherland BR, Sargent EH. Perovskite photonic sources. Nat Photonics. 2016;10:295–302.
- Humar M, Ravnik M, Pajk S, et al. Electrically tunable liquid crystal optical microresonators. Nat Photonics. 2009;3:595–600.
- Humar M, Muševič I. Surfactant sensing based on whispering-gallery-mode lasing in liquid-crystal microdroplets. Opt Express. 2011;19:19836.
- Humar M, Muševič I. 3D microlasers from self-assembled cholesteric liquid-crystal microdroplets. Opt Express. 2010;18:26995.
- Ryzhkova AV, Pratibha R, Nikkhou M, et al. Tuneable ferroelectric liquid crystal microlaser. Liq Cryst. 2020;47:994–1003.
- Cerdan L, Costela A, Garcia-Moreno I. Variable stripe length method for optical gain measurements: characteristic lengths. 2011 Conf Lasers Electro-Optics Eur 12th Eur Quantum Electron Conf CLEO Eur 2011. 2011;27:1874–1877.
- Shaklee KL, Leheny RF. Direct determination of optical gain in semiconductor crystals. Appl Phys Lett. 1971;18:475–477.
- Škarabot M, Muševič I. Direct observation of interaction of nanoparticles in a nematic liquid crystal. Soft Matter. 2010;6:5476–5481.
- Ryzhkova AV, Muševič I. Particle size effects on nanocolloidal interactions in nematic liquid crystals. Phys Rev E. 2013;87:1–12.
- Ryzhkova AV, Škarabot M, Muševič I. Surface charge and interactions of 20-nm nanocolloids in a nematic liquid crystal. Phys Rev E. 2015;91:1–8.
- Topnani NB, Nagaraja P, Musevic I, et al. Fluorescence intermittency and spatial localization of core-shell quantum rod clusters in an inverse nematic gel. Phys Rev Mater. 2020;4:1–10.
- Pandya R, Chen RYS, Gu Q, et al. Microcavity-like exciton-polaritons can be the primary photoexcitation in bare organic semiconductors. Nat Commun. 2021;12:1–11.
- Rajendran SK, Wei M, Ohadi H, et al. Low threshold polariton lasing from a solution-processed organic semiconductor in a planar microcavity. Adv Opt Mater. 2019;7:1801791.
- Cerdán L. Variable stripe length method: influence of stripe length choice on measured optical gain. Opt Lett. 2017;42:5258.
- Costela A, García O, Cerdán L, et al. Amplified spontaneous emission and optical gain measurements from pyrromethene 567-doped polymer waveguides and quasi-waveguides. Opt Express. 2008;16:7587.
- Vellaichamy M, Muševic I. Optical gain and photostability of different laser dyes, quantum dots and quantum rods for liquid crystal micro lasers. In: Proc SPIE 12023, Emerg Liq Cryst Technol XVII; 2022 Mar 3. Vol. 120230A. San Francisco (CA): SPIE; 2022. p. 17.
- Lange C, Schwalm M, Metzger B, et al. Carrier-depletion in the stripe-length method: consequences for gain measurement. J Appl Phys. 2010;108:103119.
- Kéna-Cohen S, Forrest SR. Room-temperature polariton lasing in an organic single-crystal microcavity. Nat Photonics. 2010;4:371–375.
- Sanvitto D, Kéna-Cohen S. The road towards polaritonic devices. Nat Mater. 2016;15:1061–1073.
- Davydov SA. Theory of molecular excitons. Plenum; 1971.
- Bardeen CJ. The structure and dynamics of molecular excitons. Annu Rev Phys Chem. 2014;65:127–148.
- Su R, Fieramosca A, Zhang Q, et al. Perovskite semiconductors for room-temperature exciton-polaritonics. Nat Mater. 2021;20:1315–1324.
- Zhang Q, Shang Q, Su R, et al. Halide perovskite semiconductor lasers: materials, cavity design, and low threshold. Nano Lett. 2021;21:1903–1914.
- Harwell JR, Whitworth GL, Turnbull GA, et al. Green perovskite distributed feedback lasers. Sci Rep. 2017;7:1–8.
- Srivastava AK, Zhang W, Schneider J, et al. Luminescent down-conversion semiconductor quantum dots and aligned quantum rods for liquid crystal displays. Adv Sci. 2019;6:1901345.
- Balmer RS, Brandon JR, Clewes SL, et al. Chemical vapour deposition synthetic diamond: materials, technology and applications. J Phys Condens Matter. 2009;21:21.
- Aharonovich I. Diamond nanocrystals for photonics and sensing. Jpn J Appl Phys. 2014;53:3–7.
- Schirhagl R, Chang K, Loretz M, et al. Nitrogen-vacancy centers in diamond: nanoscale sensors for physics and biology. Annu Rev Phys Chem. 2014;65:83–105.
- Aharonovich I, Greentree AD, Prawer S. Diamond photonics. Nat Photonics. 2011;5:397–405.
- Yu SJ, Kang MW, Chang HC, et al. Bright fluorescent nanodiamonds: no photobleaching and low cytotoxicity. J Am Chem Soc. 2005;127:17604–17605.
- Wilson ER, Parker LM, Orth A, et al. The effect of particle size on nanodiamond fluorescence and colloidal properties in biological media. Nanotechnology. 2019;30:30.
- Kumar R, Pandit P, Pal P, et al. Engineering bright fluorescent nitrogen-vacancy (NV) nano-diamonds: role of low-energy ion-irradiation parameters. AIP Adv. 2018;8:085023.
- Eggeling C, Widengren J, Rigler R, et al. Photobleaching of fluorescent dyes under conditions used for single-molecule detection: evidence of two-step photolysis. Anal Chem. 1998;70:2651–2659.
- Eggeling C, Widengren J, Rigler R, Rettig W, Strehmel B, Schrader S, et al. In: Applied fluorescence in chemistry, biology and medicine. Berlin: Springer;1999. p. 193–240.
- Kim JY, Voznyy O, Zhitomirsky D, et al. 25th anniversary article: colloidal quantum dot materials and devices: a quarter-century of advances. Adv Mater. 2013;25:4986–5010.
- Han KY, Willig KI, Rittweger E, et al. Three-dimensional stimulated emission depletion microscopy of nitrogen-vacancy centers in diamond using continuous-wave light. Nano Lett. 2009;9:3323–3329.
- Torelli MD, Nunn NA, Shenderova OA. A perspective on fluorescent nanodiamond bioimaging. Small. 2019;15:1–20.
- Reichwagen J, Hopf H, Del Guerzo A, et al. Photodimers of a soluble tetracene derivative. Excimer fluorescence from the head-to-head isomer. Org Lett. 2004;6:1899–1902.
- Nair SR, Rogers LJ, Vidal X, et al. Amplification by stimulated emission of nitrogen-vacancy centres in a diamond-loaded fibre cavity. 2020;9:4505–4518. DOI:10.1515/nanoph-2020-0305
- Savvin A, Dormidonov A, Smetanina E, et al. NV– diamond laser. Nat Commun. 2021;12:1–8.