
ABSTRACT
Background
Previous work has found that individuals with aphasia demonstrate impaired performance, relative to controls, on listening tasks where target speech is masked by other intelligible speech (Villard & Kidd, 2019). While this deficit may be due in part to impaired cognitive skills (e.g., attention, memory), the current study examined whether impaired linguistic-semantic processing could be a contributing factor as well.
Aims
This study compared the effect of semantic relatedness between target and masker words on performance on a speech-on-speech masking task, in listeners with aphasia vs. age-matched controls. Additionally, the study compared performance on a remote vs. an in-lab version of the experiment, with the goal of establishing the validity of remote listening experiments in these populations.
Methods & Procedures
Eight persons with aphasia (PWA) and eight age-matched controls (AMC) participated in the remote version of the experiment; similarly, eight PWA and eight AMC participated in the in-lab version of the experiment. In both versions, participants listened to short target sentences while ignoring maskers. Maskers consisted of either intelligible speech from the same semantic category as the target (e.g., target and maskers were all fruits), intelligible speech from a distant semantic category from the target (e.g., target was a fruit; maskers were articles of clothing), or speech-shaped, speech envelope-modulated noise. Procedures and stimuli were kept as similar as possible between the remote and in-lab versions of the experiment.
Outcomes & Results
In-lab results revealed a significant effect of group, such that PWA performed more poorly than AMC, as well as a significant effect of masking condition, such that participants performed more poorly on speech masking vs. noise masking conditions. No significant differences between same-category and different-category maskers were observed. A comparison of remote vs. in-lab results revealed similar patterns of performance between the two settings but suggested that remote testing resulted in overall noisier data.
Conclusions
These findings add to the existing body of knowledge about auditory masking in aphasia. Furthermore, they help lead to a clearer understanding of barriers to social engagement and community participation in PWA by characterizing challenges associated with communicating in noisy settings. The study also provided qualified support for the use of remote testing paradigms for listening experiments.
Background
In both clinical and research settings, the auditory comprehension abilities of persons with aphasia are typically evaluated using tasks where speech from a single talker is presented in a quiet environment free from distraction. While such tasks are useful in assessing an individual’s language comprehension abilities under optimal conditions, they may not provide a full picture of the ability of that individual to understand the message of a communication partner in a real-world, non-ideal listening environment where competing background sounds—or maskers—may be present. In many environments where everyday communication takes place (e.g., restaurants, family gatherings, stores, concerts, sports games, etc.), masking sounds are ubiquitous and unavoidable, requiring listeners to ignore or perceptually filter them out in order to successfully process target speech. Examples of common real-world maskers might include the intelligible or unintelligible voices of other nearby talkers; any music, voices, or other sounds emanating from a television or radio that may be present in the background; and/or noise from sources such as traffic, construction, phones, or appliances.
The task of attending to and processing target speech in the presence of maskers is known as the “cocktail party problem” (Cherry, Citation1953) and has been extensively studied in the general population (for an overview, see Middlebrooks et al, Citation2017). Additionally, a small but growing body of work has begun to investigate the cocktail party problem specifically in listeners with aphasia (Farahbod et al, Citation2023; Fitzhugh et al, Citation2021; Rankin et al, Citation2014; Villard & Kidd, Citation2019; Citation2020). This emerging line of research has provided evidence that individuals with aphasia perform more poorly than age-matched controls on masked listening tasks, requiring higher target-to-masker ratios (TMRs) to successfully process target speech, particularly when maskers also consist of intelligible speech (Rankin et al, 2021; Villard & Kidd, Citation2019; Citation2020). This susceptibility to intelligible speech masking has been shown to be present even in some individuals with mild aphasia who may test at or near ceiling on traditional (unmasked) auditory comprehension measures (Villard & Kidd, Citation2019), underscoring the need to gain a fuller understanding of the mechanisms underlying these effects.
The presence of masking in everyday communicative situations may have weighty ramifications for those who experience particular difficulty in perceptually filtering it out. Research on listeners with hearing loss—another population demonstrating high susceptibility to masking—has shown that the high degree of effort required to process speech in complex auditory environments on a daily basis can lead to negative outcomes including fatigue, stress, and social isolation (Hétu et al, Citation1988; Kramer et al, Citation2006; Mick et al, Citation2013). The continued study of auditory masking in aphasia may therefore have the potential to help identify barriers to community participation and social engagement in this population as well. It should also be noted that many individuals with aphasia are older adults, who in many cases may demonstrate some degree of peripheral hearing loss (Silkes & Winterstein, Citation2017; Zhang et al, Citation2018); this may add to the aphasia-related challenges they already face in complex auditory environments.
A key finding thus far regarding aphasia and masking is that listeners with aphasia perform significantly worse than control participants when maskers consist of intelligible speech, while still performing similarly to control participants when maskers consist of unintelligible noise. This finding is best understood in the context of the broader literature on the cocktail party problem, which draws a distinction between two fundamentally different types of masking: energetic masking (EM) and informational masking (IM). Briefly, EM refers to reduced audibility of the target signal due to spectrotemporal overlap between target and masker energy during peripheral auditory processing, while IM refers to additional masking that cannot be explained by spectrotemporal overlap and is instead thought to be due to uncertainty or confusion between target and masker speech during later, higher-level stages of processing. Tasks where maskers consist of intelligible speech typically contain high levels of IM but comparatively little EM; in contrast, tasks where maskers consist of unintelligible noise often contain higher levels of EM but little if any IM. Therefore, the observation that listeners with aphasia encounter particular difficulty when faced with intelligible speech maskers is consistent with the conclusion that the presence of aphasia is associated with a high susceptibility to IM.
The finding that listeners with aphasia struggle on high-IM tasks specifically may be explained in part by the fact that EM and IM are associated with different stages of processing. The primary challenge presented by a high-IM listening condition—that is, the challenge of perceptually disentangling target speech from highly-confusable masker speech—is believed to recruit high-level cognitive processes such as attention and memory (Kidd & Colburn, Citation2017). Individuals with aphasia have been shown in numerous studies to exhibit deficits in attention (e.g., Hula & McNeil, Citation2008; Murray, Citation2012; Villard & Kiran, Citation2003; Citation2015; Citation2017; Citation2018) as well as memory (e.g., Beeson et al, Citation1993; Lang & Quitz, Citation2012; Potagas et al, Citation2011), relative to controls. It is, therefore, highly likely that these deficits render high-IM listening tasks more taxing in individuals with aphasia, leading to decreased performance. One recent study has also provided evidence of an association between working memory ability and susceptibility to IM in persons with aphasia (Fitzhugh et al, Citation2021), and there is evidence that individual differences in selective attention may help predict performance on high-IM listening tasks even in unimpaired listeners (Oberfeld & Kloeckner-Nowotny, Citation2016).
In addition to these cognitive factors, however, it is important to remember that speech-on-speech masking tasks are highly linguistic in nature, prompting the question of whether the impaired language processing skills that define aphasia might also contribute to impaired performance on high-IM tasks in this population. While discussions of speech-on-speech masking tasks have frequently focused on the challenges associated with perceptually separating target from maskers, these tasks also involve a key linguistic process: mapping words to semantic meanings. Previous research has shown that individuals with aphasia exhibit weaknesses in mapping linguistic word forms to precise semantic representations (Butterworth et al, Citation1984; Jefferies et al, Citation2007; Silkes et al, Citation2020). Because speech-on-speech masking tasks likely require obligatory processing of the masker(s) to some degree as well as the target (for a discussion, see Kidd & Colburn, Citation2017), listeners with aphasia may struggle not only with the challenge of disentangling target and masker words from one another, but also with the challenge of mapping both target and masker words to their respective semantic meanings. Past work has indicated that PWA typically exhibit high rates of masker word confusions (e.g., reporting the word “car” instead of “hat”)—as do controls—but the experimental designs of these previous studies have only allowed for assessment of confusions within syntactic categories and have not examined semantic confusions at all. With these findings in mind, the current study aimed to investigate whether high-IM masking conditions could be manipulated to exploit underlying weaknesses in the linguistic-semantic system in listeners with aphasia. If so, this would provide support for a link between linguistic-semantic deficits and susceptibility to IM.
The approach chosen for the current study was to vary the degree of semantic relatedness between target and masker words, such that in some cases the target and masker words would be semantically close, while in other cases the masker words would be semantically distant from the target word. Given the recent work noted above that has revealed deficits in performance by PWA in speech-on-speech masking situations, as well as the possibility that part of this difficulty could be related to problems with the mapping of both target and masker words to their respective semantic meanings, we devised an approach that would examine the influence of the degree of semantic relatedness between the target and maskers (operationalized as “same category” vs “different category”). To our knowledge, this is not a question that has been addressed previously in PWA, and a case could be made in support of either of two potential outcomes.
The first of these two possible outcomes was that masker words that were closely semantically/linguistically related to the target word might cause greater confusion than semantically unrelated masker words in PWA, due to the reduced ability of PWA listeners to make fine-grained selections of items within a broad linguistic category. For example, selecting the talker who uttered “apple” might be more difficult for a PWA listener if the competing word from another talker was drawn from the same category (e.g., “pear”, a fruit) versus from a different category (e.g., “car”, a vehicle). Within category word substitutions are common in PWA, and it is plausible that this type of error would manifest as greater within-category confusions in speech-on-speech masking. This outcome would be consistent with the linguistic similarity hypothesis, which states that listeners (not listeners with aphasia but rather listeners in general) are more likely to confuse target and masker speech when they are linguistically similar than when they are linguistically distinct. For example, poorer performance has been observed in conditions where the target and masker are presented in the same language, relative to conditions where they are presented in two different languages both known to the listener (e.g., Brouwer, Citation2017; Brouwer et al, Citation2012; Brown et al, Citation2022). Furthermore, decreases in performance have been found in conditions where masker speech and target speech have similar degrees of semantic content/meaningfulness (Brouwer et al, Citation2012). Of particular interest is the finding from blocked cyclic naming studies that the negative effect of semantic interference from semantically related words is even stronger in PWA (Hsiao et al, Citation2009; Schnur et al, Citation2006).
The second possible outcome is that masker words that were less semantically/linguistically related to the target word could increase uncertainty and therefore result in more errors in PWA listeners. IM is inherently due to listener uncertainty, so competing words invoking distinct and unrelated semantic meanings could increase uncertainty in susceptible listeners, which in turn would result in greater IM. Previous work on semantic priming has found that priming listeners (without aphasia) with words semantically distant from the target can negatively affect performance, likely because it lowered the semantic activation of the target and/or created greater uncertainty about semantic category to which the target belonged (Dekerle et al, Citation2014). It might be expected, therefore, that this effect would be even stronger in PWA, whose semantic systems are already disrupted.
In addition to comparing the effects of semantically related and semantically unrelated intelligible maskers, a secondary objective of the current study was to compare the results obtained by in-lab versus remote testing as a means of assessing the validity of remote acoustic testing paradigms in listeners with aphasia as well as controls. This objective was not originally included in the experimental design of the study but rather was added later due to temporary restrictions on in-lab testing imposed by the COVID-19 pandemic. It was anticipated that the results of remote and in-lab testing would be closely correlated with one another but that performance during remote testing might be somewhat poorer and/or more variable in both groups of listeners, due to the higher potential for distraction during at-home testing.
Methods
Study design
The experimental task had originally been intended to be administered in a traditional lab setting; however, this plan was interrupted by the onset of the COVID-19 pandemic and resulting restrictions on in-person research in 2020. Instead of initiating in-lab data collection during this time, therefore, the experiment was reprogrammed so that it could be conducted remotely via a web browser on participants’ home computers, with technological support provided remotely by a researcher. Later, as local COVID-19 restrictions on in-person research were relaxed, participants who had already completed the remote version of the experiment were invited to come to the lab and repeat the experiment in a sound-attenuated booth. This offered an opportunity to compare the findings from both settings and thus to gauge the validity of the remote testing method. Recruitment continued until a full remote data set and full in-lab data set had both been collected.
Participants
A group of 16 participants, comprising eight participants with aphasia (PWA) and eight age-matched controls (AMC), participated in the remote version of the study. Similarly, 16 participants, comprising eight PWA and eight AMC, participated in the in-lab version of the study. Participants in the AMC groups reported no history of stroke, traumatic brain injury, or progressive neurological disease. Participants in the PWA group reported no diagnosis of traumatic brain injury or progressive neurological disease. Please note that while all participants in this group exhibited aphasia at the time of enrollment (based on a combination of standardized testing scores and the clinical judgment of the first author, a licensed speech-language pathologist), in many cases the aphasia was very mild. The inclusion of these participants with very mild aphasia was deliberate, as anecdotal reports of difficulty with background noise are not limited to individuals with substantial language impairment but rather are often heard from individuals whose aphasia is largely resolved and who are able to achieve high-level language abilities on traditional standardized testing measures.
There was substantial—but not total—overlap between the remote participants and the in-lab participants. In total, fourteen participants (6 PWA and eight AMC) participated in both versions of the study. Additionally, there were two PWA participants (PWA2 and PWA7) who only completed the remote version of the study, as well as two PWA participants (PWA9 and PWA10) who only completed the in-lab version of the study. Most (but not all) of the participants who completed both versions of the study completed the remote version first, followed by the in-lab version; this was a result of the fact that the study was launched remotely first, with in-lab testing beginning later. In most cases, when a participant completed both versions of the study, a month or more (on average, ~6 months) elapsed between the two testing periods. Please see for information on the participants and their involvement in each version of the experiment, as well as Western Aphasia Battery (WAB, Kertesz, Citation2007) scores for PWA participants. This study was overseen by the Boston University Institutional Review Board.
Table 1. Demographic and testing information for all participants
Materials
Auditory stimuli consisted of a subset of items from a laboratory-designed corpus of single-word audio recordings (Kidd et al., Citation2008) produced by Sensimetrics Corporation (Malden, MA) and used in several past studies of speech-on-speech masking. The full closed set of words included in the experiment can be found in . Recordings of each of these words were obtained from each of eight different female talkers and concatenated into subject-verb-object sentences during the experiment. Target sentences always began with the carrier phrase “Betsy sees”, while masker sentences always began with a carrier phrase drawn from the remaining names and verbs (e.g., “Donna gives”, “Molly wants”). The two-syllable objects used in the experiment were drawn from lists of typical nouns in six categories, three living and three non-living (Meier, Lo, & Kiran, Citation2016). Therefore, the object stimuli within each category were matched on number of syllables as well as on the designation of “typical”, which refers to members of a category that possess the most common features or attributes of that category (for more on this topic, see Kiran & Thompson, Citation2008). This use of “matrix-style” target and masker sentences has been employed in a number of previous studies conducted by our lab and others (e.g., Kidd et al, Citation2016; Villard & Kidd, Citation2019); it has the advantage of allowing for a high number of repetitive trials without introducing a learning effect, as well as of creating the potential for explicit confusions between target and masker words. Finally, speech-shaped, speech envelope-modulated noise was created by multiplying the broadband envelope of a concatenated masker sentence by speech spectrum-shaped noise created using the long-term average of randomly-chosen segments of the entire corpus of recordings used in the study.
Table 2. Full list of stimulus words used in the experiment
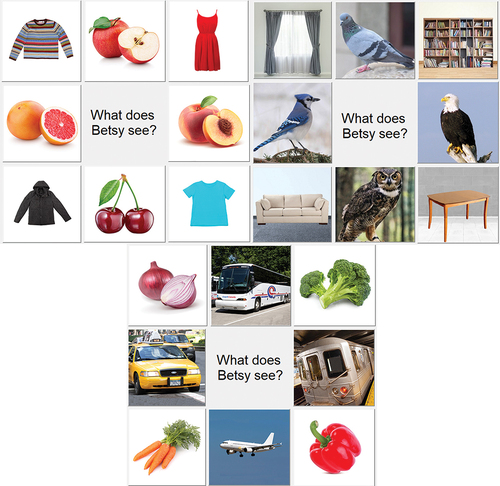
Visual stimuli consisted of three graphical user interfaces (GUIs), each displaying eight possible response options, four from each of two semantic categories (See ). In order to ensure that each GUI contained two semantically distant categories, each of the three category combinations (birds/furniture; fruits/clothing; vegetables/transportation) contained both a living and a non-living category. These three category combinations were kept consistent across the experiment.
Figure 1. Graphical user interfaces used in the experiment.
Remote Testing Procedures
For remote testing, participants first completed an electronic consent form, along with an electronic attestation form which listed steps they were being asked to take in order to create a quiet, low-distraction testing environment in their home. These steps included silencing their phone during testing, closing other computer programs, and asking roommates/family members in advance not to disturb them during testing.
All participants in the study underwent a pure tone hearing screening at .25, .5, 1, 2, 3, 4, 6, and 8 kHz, in both the left and right ears. If, at the time of enrollment, a participant already had an audiogram on file from participation in a previous experiment in our lab, that audiogram was used for this study as well. If a participant did not have a recent audiogram on file, they were asked to make a single, brief visit to the labFootnote1 to undergo a hearing screening before proceeding with the remote experiment at home. The hearing screening was conducted not as a means of excluding participants who exhibited any hearing loss but rather so that stimulus levels could be adjusted individually for each participant as described in further detail below.
After the consent, attestation, and hearing screening had all been completed, a virtual meeting (via either phone or videoconference, depending on the participant’s preference) was conducted between the participant and one of the researchers, during which the researcher emailed the participant a web link to the online experiment and verbally/visually instructed them on how to access the experiment and set up their computer and headphones, troubleshooting any technology issues as they aroseFootnote2
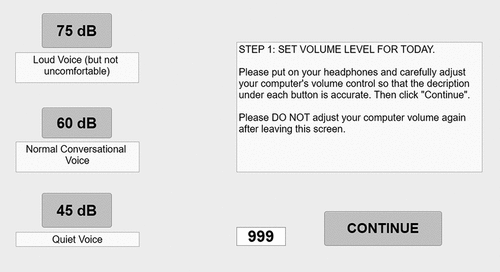
An important step in this process was to train the participant to conduct a home audio calibration at the start of the session, using the interactive screen pictured in , in order to ensure that stimuli would be presented at an audible but comfortable level on the participant’s home computer. The calibration screen included interactive buttons labelled “75 dB”, “60 dB”, and “45 dB”. When pressed, each of these buttons played a target sentence at a pre-set volume that would match its volume label if the root-mean-square (RMS) value were set at an “anchor” level. Because the RMS value of the participant’s home computer system was unknown, the participant was asked to press each of these buttons in turn, listening to the volume of the resulting sentence and adjusting their computer volume, as many times as necessary until they felt that the loudness descriptions under all three buttons were accurate. They were then required to repeat this calibration process at the start of each subsequent testing session.
Figure 2. Interactive calibration screen used during the remote experiment. “999” represents the subject ID number.
From this point onward, frequency-dependent intensity gain was applied to all speech and noise played during the task, using the National Acoustic Laboratories’ (NAL) Revised Procedure for fitting nonlinear hearing aids, in order to control for hearing loss to the extent possible. This algorithm was applied individually for each participant, using as its input parameters the participant’s pure tone thresholds at each frequency tested, for each ear.
Next, during the initial remote testing session only, participants completed a practice task designed to ensure that they could reliably understand target sentences in quiet (i.e., without maskers present). This was important in order to ensure that any errors during the subsequent masking task were truly the result of masking, rather than of comprehension deficits. During each trial of the practice task, a target sentence (e.g., “Betsy sees apples”) spoken by a randomly-selected talker was presented at 60 dB (henceforth, italicized presentation levels indicate the estimated level based on the home calibration procedure, rather than the exact level), followed by the appearance of a GUI (see ). The participant was asked to click on the picture corresponding to what Betsy saw. The practice track cycled through each of the three GUIs, testing each of the object words used in the experiment in turn. In order to move on from the practice track, a participant needed to achieve 100% correct. If they scored less than 100%, they were provided with one additional chance to redo the entire practice track to achieve 100% correct.
After successfully completing the practice task, participants completed a one-up, one-down quiet adaptive track (Levitt, 1971), during which target sentences alone were played, again in quiet. The first sentence was played at 60 dB, and the level of each subsequent trial decreased (following a correct response) or increased (following an incorrect response), with the goal of estimating the participant’s speech reception threshold (mean of nine adaptive track reversals) for these items. Participants were given feedback (Correct/Incorrect) after each trial. This process allowed us to confirm that the calibration process had been successful and that the presentation level of the stimuli throughout the remainder of the experiment would be adequately audible to the participant. The participant was required to complete an additional quiet adaptive track at the beginning of each subsequent remote experimental session.
Finally, after completing the quiet adaptive track, participants moved to the main experiment, either starting at the beginning or picking up where they had left off at the end of the previous testing session. Participants were allowed to break the experiment up into as few or as many sessions as they liked. They were advised that each time they restarted, they would be required to complete a calibration check and quiet adaptive track before picking up where they had left off in the main experiment. In cases where the participant left the experiment partially finished for more than a week, an experimenter contacted them by email or phone to remind them to complete the experiment and ask if they needed any help. The number of sessions in which each participant completed the experiment is noted in .
During the main experiment, participants were instructed to pay attention to the target sentence starting with “Betsy” (e.g., “Betsy sees apples”), while ignoring anything else they heard. The main experiment included 12 blocks, each containing 53 trials (the first 5 of which were later dropped from analysis, leaving 48 scored trials). Each one of the blocks used a single, consistent GUI: there were four fruits/clothing blocks, four birds/furniture blocks, and four vegetables/transportation blocks. Each block tested three different masking conditions (Same, Different, and Noise) at each of four different TMRs (-10 dB TMR, -5 dB TMR, 0 dB TMR, and 5 dB TMR). These four TMRs were selected based on previous data collected in our lab from PWA and AMC using similar stimuli (Villard & Kidd, Citation2019, Citation2020) and were anticipated to elicit a range of performance levels, from chance to ceiling. Although TMRs were varied from trial to trial, stimuli were presented at a consistent overall level of 65 dB throughout the main experiment. Descriptions of the masking conditions are as follows:
Same: Masker objects were drawn from the same category as the target object. Therefore, if the target was “Betsy sees apples”, examples of possible masker sentences were “Karen gives peaches” and “Donna likes grapefruit”.
Different: Masker objects were drawn from a different category than the target object. Therefore, if the target sentence was “Betsy sees apples”, examples of possible masker sentences were “Molly likes T-shirts” and “Karen wants jackets”.
Noise: Each masker consisted of speech-shaped noise, modulated with an envelope drawn from a possible masker sentence.
Masker sentences were always presented simultaneously with the target sentence, with the onsets of each set of three corresponding words (e.g., “sees”, “gives”, and “likes”) or noise tokens aligned with one another to create maximum temporal overlap. Head-related transfer functions were used to achieve perceived spatial separation between target and maskers. The target source was always located at 0° azimuth (straight ahead of the listener), while the masker sources were always located at +/- 45° azimuth. Within the 48 scored trials, the condition, TMR, and target category were each drawn pseudo-randomly from trial to trial, such that at the end of the block each possible combination of masking condition x TMR x target category (3 x 4 x 2) had been presented twice. Within the target-masker combinations for a given trial, the specific target object and two masker objects were drawn randomly (but always distinct from one another within a trial), as were the target talker and two masker talkers (which were also always distinct from one another within a trial). After listening, participants again clicked on a picture to report the target item, and feedback was again provided.
In-Lab Testing Procedures
The in-lab testing procedures were nearly identical to the remote testing procedures, except for the key difference that participants completed the experiment in a sound-attenuated booth in a traditional lab setting with precisely-calibrated auditory stimuli (removing the need for participants to conduct their own calibration check). Once again, frequency-dependent intensity gain was applied to all speech and noise played during the task. Because the precise stimulus levels were known during the in-lab testing sessions, participants completed just two quiet adaptive tracks at the beginning of the first session, rather than at the beginning of each session. Stimuli were presented at a consistent overall level of 65 dB throughout the main in-lab experiment. Participants were encouraged to take breaks as needed and were told that they could spread the in-lab experiment out over multiple sessions if they wished; however, many participants chose to complete the entire in-lab experiment in a single session (see ) . Finally, because in-lab testing allowed for reliable recording of response times (whereas remote testing did not, due to uncertainty around speed/bandwidth of participants’ home Internet connections), during in-lab testing sessions, participants were instructed to respond both as quickly and as accurately as they could.
Results
Accuracy in each condition/location/TMR
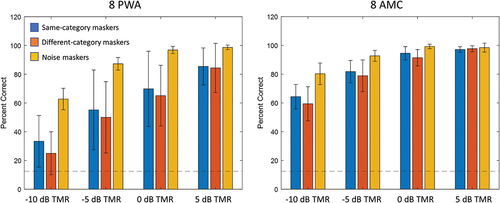
The accuracy data for remote testing, broken down by group, masking condition, and TMR, are presented in . The corresponding accuracy data for in-lab testing are presented in .
Figure 3. Accuracy for remote testing. Error bars indicate standard deviation. Red horizontal line indicates chance performance (12.5%).
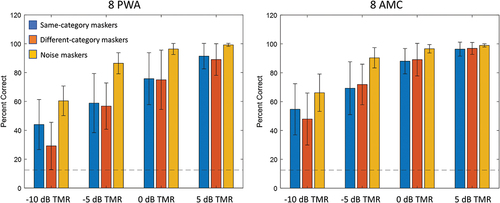
Figure 4. Accuracy for in-lab testing. Error bars indicate standard deviation; Red horizontal line indicates chance performance (12.5%).
Psychometric functions
Visual inspection of revealed that, as expected, performance improved as TMR increased. Therefore, in order to better understand and visualize the improvement in performance as a function of TMR, sigmoid psychometric functions showing the relationship between TMR and accuracy were generated for each participant in each condition, using the accuracy data from the four TMRs tested. These functions are useful because they provide a more complete picture of the full range of performance (i.e., chance to asymptote) and change in performance as a function of TMR (i.e., slope of function). Please see for remote testing functions and for in-lab testing functions. The TMRs corresponding to the 50% correct points on the psychometric functions (henceforth, speech reception thresholds, or SRTs) were calculated for each participant in each condition/location combination, for use in subsequent analyses. The SRTs for each participant can be found in .
Figure 5. Psychometric functions for remote testing for each group in each condition. Horizontal dotted line indicates chance performance (12.5%); curved dotted lines indicate individual subject functions; solid lines indicate overall function produced by averaging fit parameters of individual subject functions; asterisk indicates 50% correct point on averaged function.
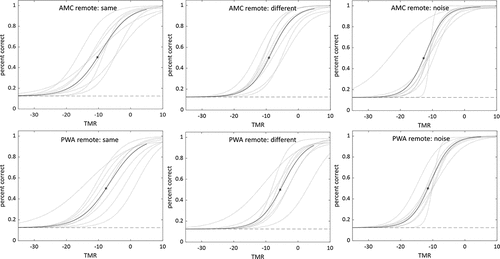
Figure 6. Psychometric functions for in-lab testing for each group in each condition. Horizontal dotted line indicates chance performance (12.5%); curved dotted lines indicate individual subject functions; solid lines indicate overall function produced by averaging fit parameters of individual subject functions; asterisk indicates 50% correct point on averaged function.
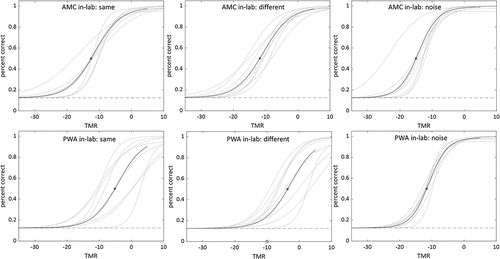
Table 3: Speech reception thresholds for each participant, in dB TMR.
Comparing remote vs. in-lab results
Because the entire experiment was conducted twice—once remotely and once in the lab—the first step in analyzing the data was to directly compare the remote and in-Lab data sets to determine whether results differed between the two. If the two sets of results were not significantly different from one another, they could arguably be pooled together on an individual participant basis (for the 14 participants who completed the experiment in both settings). If, however, the remote and in-lab data sets differed significantly from one another, this would necessitate conducting separate sets of analyses for each. Participants’ derived SRTs were used as data points for this comparison because they reflect the entire range of performance across all TMRs tested. It should be noted that only participants who completed both the remote and the in-lab experiment (8 AMC and 6 PWA) were included in these analyses.
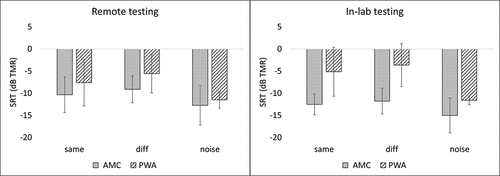
For the AMC group, a 2 x 3 repeated measures analysis of variance (RM-ANOVA) was conducted to examine the effect of location and masking condition on SRT. Results showed a significant main effect of location, such that in-lab performance was significantly better than remote performance, F(1, 7) = 20.21, p = 0.003; as well as (with a Greenhouse-Geisser correction) a significant main effect of condition, F(1.05, 7.32) = 6.74, p = 0.03. The effect size associated with the effect of location was 0.74 partial η2. The effect size associated with the effect of condition was 0.49 partial η2. Bonferroni post-hoc comparisons revealed the following significant differences: same > noise (difference between means: 2.45 dB TMR), p = 0.03; and different > noise (difference between means: 3.42 dB TMR), p = 0.03). No significant interaction effect was found. For the PWA group, a corresponding 2 x 3 RM-ANOVA was conducted. Results again showed a significant effect of condition (again with a Greenhouse-Geisser correction), F(1.12, 5.61) = 12.99, p = 0.01. The effect size associated with this effect was 0.72 partial η2. Bonferroni post-hoc comparisons revealed the following significant differences: same < different (difference between means = 1.90), p = 0.009); same > noise (difference between means = 4.67), p = 0.036; and different > noise (difference between means = 1.90), p = 0.008. This time, the effect of location was not significant. Again, no significant interaction effect was found. Please see for the comparisons examined by these RM-ANOVAs.
Figure 7. Remote vs. in-lab performance for AMC and PWA. Error bars indicate standard deviation.
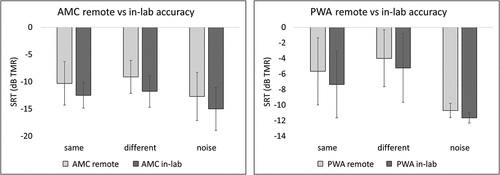
Based on the significant effect of location on performance within the AMC group and the near-significant effect of location on performance within the PWA group, it was conservatively determined that these two sets of results should be kept separate for subsequent analyses examining the effect of group and condition.
Correlations between remote and in-lab results
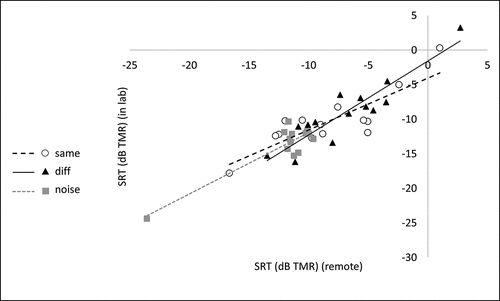
Because the remote and in-lab results appeared to yield similar patterns of results, they were also compared using three Pearson correlations, each one examining the association between remote vs. in-lab scores in a given masking condition, using the SRTs of the 14 participants who completed the study in both testing locations. There was a significant association between remote and in-lab scores for the same condition, r = 0.846, p < 0.001, a significant association between remote and in-lab scores for the different condition, r = 0.910, p < 0.001, and a significant association between remote and in-lab scores for the noise condition, r = 0.906, p < 0.001 (See ).
Figure 8. Correlations between remote and in-lab 50% correct points (pooled across groups, for all participants who completed both versions of the experiment).
Effect of group and masking condition
Next, performance was compared between group and masking condition, with separate sets of analyses for the remote testing data set and the in-lab data set (this time, data sets from all eight participants in each group were included). A 2 x 3 mixed-model ANOVA examining the effect of group and masking condition on performance during remote testing revealed, with a Greenhouse-Geisser correction, a significant effect of condition, F(1.21, 16.94) = 17.72, p < 0.001. The effect size associated with the effect of condition was 0.56 partial η2. Bonferroni post-hoc comparisons revealed significant differences between conditions, with different > same (difference in means = 1.64 dB TMR), p < 0.001; same > noise (difference in means = 3.13 dB TMR), p = 0.08; and different > noise (difference in means = 4.77), p < 0.001. There was no significant effect of group and no interaction effect.
A corresponding 2 x 3 mixed-model ANOVA examining the effect of group and masking condition on performance during in-lab testing revealed a significant effect of group, F(1,14) = 15.97, p < 0.001, as well as, with a Greenhouse-Geisser correction, a significant effect of condition, F(1.36, 19.07) = 22.60, p < 0.001. The effect size associated with the effect of group was 0.53 partial η2, and the effect size associated with the effect of condition was 0.62 partial η2. Bonferroni post-hoc comparisons revealed significant differences between conditions, with different > same (difference in means = 1.12 dB TMR), p = 0.04; same > noise (difference in means = 4.48 dB TMR), p < 0.001; and different > noise (difference in means = 5.60), p < 0.001. There was also a significant interaction effect, F(1.36, 19.07) = 4.16, p = 0.03. The effect size associated with this interaction effect was 0.23 partial η2. Please see for the comparisons examined by these ANOVAs.
Figure 9. Remote and in-lab performance for AMC and PWA in each condition. Error bars indicate standard deviation.
Error analyses
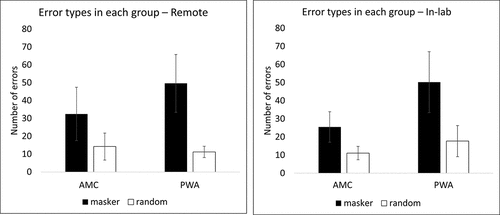
Next, error analyses were performed in order to learn more about whether participants’ incorrect responses matched one of the presented masker words or were “random” (i.e., did not match either of the presented masker words). Only the errors produced during the -10 dB TMR condition were examined because this was the TMR at which the highest number of errors occurred. The total number of “masker” and “random” errors was counted for each participant, pooled across the Same and Different masking conditions (but leaving out the Noise condition, where masker stimuli were not intelligible). A 2 x 2 mixed-model ANOVA examining the effect of group and error type on number of errors during remote testing revealed a significant effect of error type, F(1, 14) = 44.45, p < 0.001 and a significant interaction effect, F(1, 14) = 5.62, p = 0.03. The effect size associated with the effect of error type was 0.76 partial η2, and the effect size associated with the interaction effect was 0.29 partial η2. There was no significant effect of group. A corresponding 2 x 2 mixed-model ANOVA using data from in-lab testing found a significant effect of error type, F(1, 14) = 30.50, p < 0.001 and a significant effect of group, F(1, 14) = 25.93, p < 0.001. The effect size associated with the effect of error type was 0.69 partial η2, and the effect size associated with the effect of group was 0.65 partial η2. There was no significant interaction effect. Please see for the comparisons examined by these ANOVAs.
Figure 10. Error types (masker vs. random) in each group, in each testing location. Error bars indicate standard deviations.
Reaction times (in-lab only)
Finally, reaction times for correct responses, calculated from the appearance of the response GUI until the participant’s response button press during the in-lab experiment were also examined using a 2 x 3 x 4 mixed-model ANOVA. With a Greenhouse-Geisser correction applied, results revealed a significant effect of TMR, F(1.29, 15.48) = 8.56, p < 0.01. The effect size associated with the effect of TMR was 0.42 partial η2. Additionally, Bonferroni post-hoc comparisons revealed that stimuli presented at -10 dB TMR elicited longer reaction times than stimuli presented at any of the other TMRs. For -10 vs. -5 dB TMR, the difference in means was 0.31, p = 0.005; for -10 vs. 0 dB TMR, the difference in means was 0.46, p = 0.008; and for -10 vs. 5 dB TMR, the difference in means was 0.53, p = 0.008. There was no significant effect of group or masking condition, and no interaction effects.
Discussion
This study investigated the effect of semantic relatedness between target and masker words on performance on a speech intelligibility task, in listeners with aphasia as well as in age-matched control listeners. Participants listened to simple, matrix-style target sentences under three auditory masking conditions: a condition where masker words were drawn from the same semantic category as the target word, a condition where masker words were drawn from a semantic category unrelated to that of the target word, and a condition where maskers consisted of unintelligible speech-spectrum-shaped, speech-envelope-modulated noise. Two sets of data were collected: one in a traditional laboratory setting and one remotely, with participants using their home computer to complete a web browser version of the experiment. There was a substantial (but not total) overlap in the participants who completed the remote version of the experiment and the participants who completed the in-lab version of the experiment. Broadly, the results were consistent with previous findings indicating that participants with aphasia struggle more than controls on masked listening tasks, particularly when maskers consist of intelligible speech. Additionally, similarities between patterns of performance during remote versus in-lab testing provide qualified support for the use of remote testing paradigms. These findings add to the literature on the cocktail party problem in listeners with aphasia and contribute to our understanding of real-world communication challenges and barriers in this population.
Because this study was conducted twice, once in the lab and once remotely, a preliminary step in examining the data was to directly compare the results obtained in these two settings in order to determine whether they should be pooled for later analyses or kept separate from one another. This comparison revealed that while overall patterns of masking effects were similar—and results were strongly correlated—between the two settings, there was a clear significant effect of testing location, such that testing conducted in the lab resulted in better performance than testing conducted remotely.
There are several possible explanations for why performance was superior during in-lab testing relative to remote testing. One explanation is that in-lab testing took place in a highly-controlled environment, with all testing overseen by an experimenter. Furthermore, in-lab stimulus generation and calibration were performed in a rigorous manner and could be compared to numerous results from past studies conducted in the laboratory under the same conditions. In contrast, the remote testing setup allowed for less control and oversight over the testing conditions: even if a participant did their best to follow the instructions for creating an appropriate testing environment, there were likely more potential distractions in a home setting than in a sound-attenuated booth (e.g., unexpected noises from the street/hallway; more visual clutter in the testing room, etc.), which could have led to lower overall performance. A second possible contributing factor to the poorer performance in the remote testing data set is that participants tended to break the remote version of the experiment up into a higher number of shorter blocks, often spread across many days. In contrast, for the in-lab version, participants tended to sit and focus on the experiment for fewer, longer periods of time, perhaps in order to minimize the number of visits they would need to make to the lab. This could have resulted in participants being overall more focused or more “in set” during in-lab testing, relative to remote testing. For these reasons, the in-lab results will be viewed as the primary (more reliable) set of results from this point forward, with the remote testing results viewed as a secondary/supplementary data set for comparison.
Within the in-lab results, a significant group difference emerged, such that PWA performance was poorer than that of AMC. Additionally, there was a significant effect of condition, as well as a significant group-condition interaction effect. Together, these results suggest that not only did PWA listeners struggle more than AMC listeners overall, but also that they struggled in particular with the two intelligible speech masking conditions (while performing somewhat more similarly to AMC in the noise masking condition). These results are consistent with previous research demonstrating that listeners with aphasia perform more poorly on speech intelligibility tasks than controls, particularly when maskers consist of intelligible speech (Fitzhugh et al, Citation2021; Rankin et al, Citation2014; Villard & Kidd, Citation2019; Citation2020). This interpretation was also underscored by the error analyses, which suggested that while the majority of errors in both groups were masker errors, PWA may have been particularly prone to masker errors, indicating a high degree of confusion within this group between target and masker words. Based on these findings, results from the current study are consistent with the conclusion that PWA are more susceptible than AMC to IM.
For comparison, the remote testing results revealed a significant effect of condition on performance, but no significant effect of group and no interaction effect, despite the fact that the overall patterns of performance were broadly similar to (and correlated with) those seen in the in-lab results. This contrast may highlight another result of the differences between remote and in-lab testing, namely, that remote testing may have resulted not just in poorer performance overall, but may also have introduced a higher amount of variability into the data set, possibly necessitating the collection of a larger sample size in order for any differences to rise of the level of statistical significance. The strong correlations between the in-lab and remote data sets underscore the possibility that with a larger remote sample size, significant differences similar to those seen in the in-lab data set might have emerged. This information may be applicable to power calculations for future studies on auditory masking and/or auditory comprehension in aphasia that researchers might wish to conduct online. On a practical note, while the current study did not endeavor to expand the sample size of the remote testing group (as remote testing was not an element of the original experimental design of the study), recruiting a larger group of participants could be feasible for a future remote-testing study, as participants would not need to live near (or travel to) the testing site.
Interestingly, the results did not show strong evidence in support of an advantage of same-category over different-category maskers (or vice versa). This negative result was unexpected, given the known presence of linguistic-semantic processing deficits in PWA and how we expected such deficits to influence speech-on-speech masking. Visual inspection of suggested that, at the lowest (most difficult) TMR, PWA performed more poorly with different-category than same-category maskers; however, the statistical analyses did not support this conclusion. There are several possible explanations for the lack of an effect of the semantic relatedness of the masker to the target. One possibility is that, given the large inter-subject variability found with these measures, the study lacked the power that would have been needed for the group mean differences to reach statistical significance. Another possible explanation is that any genuine effect only emerges at very low TMRs where the task places heavy demands on processing ability. In that scenario, presenting the stimuli at lower TMRs (e.g., -15 dB TMR) would have further challenged participants—particularly PWA participants who are known to have particular difficulty at lower TMRs (Villard & Kidd, Citation2019)—and thereby brought forth clearer differences between different semantic conditions.
One important caveat that should be noted when considering the results of the study is that while the direct comparison between remote and in-lab testing clearly showed performance to be better overall in the lab, visual examination of appears to show that PWA performance was slightly poorer in the lab. This discrepancy is due to the fact that there was not a total overlap between remote PWA participants and in-lab PWA participants: two of the PWA who had participated remotely were not available to come to the lab to complete the in-lab version, and so they were replaced by two new PWA who completed the in-lab version only. Examination of individual performance levels showed that the two participants who completed only the remote version achieved very good levels of performance relative to the rest of the remote group, while the two participants who completed only the in-lab version achieved relatively poorer levels of performance relative to the rest of the in-lab group. This finding speaks to the aforementioned issue of sample size and the recommendation that future remote testing studies on PWA aim to recruit additional participants.
Findings from this study provide important information about the effects of auditory masking—particularly intelligible speech masking—on listeners with aphasia. Like previous studies, this study found that PWA performed more poorly than controls on a speech-on-speech masking task, even when age and hearing profile were accounted for. The fact that most of the PWA who participated in this study exhibited mild aphasia and high-level comprehension abilities underscores the observation that difficulty in understanding speech in masked listening environments is not typically detected by standard language assessments administered to individuals with aphasia. This work may therefore have important implications for educating PWA about possible difficulties they may encounter in non-ideal listening environments, as well as for better understanding possible barriers to community participation in PWA. It may also help to lay a foundation for future work investigating possible rehabilitative or compensatory approaches to improving the ability of PWA to understand target speech in multi-talker listening environments. Our findings also provide qualified support for the design and implementation of future remote testing paradigms in this population (qualified in the sense that some, but not all, of the laboratory-based findings were apparent in the remote testing findings), which may have implications for future studies designed to be conducted in a remote or hybrid setting.
One final note about this topic concerns possible relationships between remote testing and equity in research. The platform through which the remote experiment was programmed in the current study required use of a home computer/laptop (not a tablet or phone), stereo headphones, and a stable Internet connection, as well as the ability to create quiet testing conditions at home. To our knowledge, the majority of the participants recruited for this study did not encounter difficulty meeting these requirements; however, this may not be the case for all participant groups or samples. Future studies implementing a remote testing design should carefully consider how disparities in financial resources might impact study accessibility, and what steps might be taken to ensure all eligible individuals are able to participate.
Acknowledgements
Research reported in this publication was supported by a New Investigators Research Grant (PI: Villard) from the American Speech-Language-Hearing Foundation. Additional support was provided by the National Institute on Deafness and Other Communication Disorders, Award Number [R01 DC04545] (PI: Kidd) and Award Number [T32 DC013017] (PI: Moore), as well as Boston University’s Undergraduate Research Opportunities Program (recipient: Yap). The authors acknowledge and thank Luke Baltzell, Virginia Best, Andy Byrne, Adrian Cho, Christopher Conroy, Lorraine Delhorne, Chris Mason, and Elin Roverud for their contributions to this work.
Disclosure statement
No potential conflict of interest was reported by the authors.
Additional information
Funding
Notes
1 By the time the remote version of the experiment had been programmed and launched, in-person research visits were once again permitted at Boston University, with COVID-19 protocols in place; however, many participants still reported that they preferred to minimize in-person visits and to complete study visits remotely when possible
2 PWA7 encountered difficulty with the home technology setup that we were not able to troubleshoot remotely. Therefore, PWA7 was invited to complete the remote experiment in the lab, using an Internet browser at a regular lab workstation (NOT a sound-attenuated booth)..
References
- Beeson, P. M., Bayles, K. A., Rubens, A. B., & Kaszniak, A. W. (1993). Memory impairment and executive control in individuals with stroke-induced aphasia. Brain and Language, 45(2), 253–275. https://doi.org/10.1006/brln.1993.1045
- Brouwer, S. (2017). Masking release effects of a standard and a regional linguistic variety. The Journal of the Acoustical Society of America, 142(2), EL237–EL243. https://doi.org/10.1121/1.4998607
- Brouwer, S., Van Engen, K. J., Calandruccio, L., & Bradlow, A. R. (2012). Linguistic contributions to speech-on-speech masking for native and non-native listeners: Language familiarity and semantic content. The Journal of the Acoustical Society of America, 131(2), 1449–1464. https://doi.org/10.1121/1.3675943
- Brown, V. A., Dillman-Hasso, N. H., Li, Z., Ray, L., Mamantov, E., Van Engen, K. J., & Strand, J. F. (2022). Revisiting the target-masker linguistic similarity hypothesis. Attention, Perception, & Psychophysics, 1–16. https://doi.org/10.3758/s13414-022-02486-3
- Butterworth, B., Howard, D., & Mcloughlin, P. (1984). The semantic deficit in aphasia: The relationship between semantic errors in auditory comprehension and picture naming. Neuropsychologia, 22(4), 409–426. https://doi.org/10.1016/0028-3932(84)90036-8
- Cherry, E. C. (1953). Some experiments on the recognition of speech, with one and with two ears. The Journal of the Acoustical Society of America, 25(5), 975–979. https://doi.org/10.1121/1.1907229
- Dekerle, M., Boulenger, V., Hoen, M., & Meunier, F. (2014). Multi-talker background and semantic priming effect. Frontiers in Human Neuroscience, 8, 878. https://doi.org/10.3389/fnhum.2014.00878
- Farahbod, H., Rogalsky, C., Keator, L. M., Cai, J., Pillay, S. B., Turner, K., … & Saberi, K. (2023). Informational masking in aging and brain-lesioned individuals. Journal of the Association for Research in Otolaryngology, 24(1), 67–79. https://doi.org/10.1007/s10162-022-00877-9
- Fitzhugh, M. C., LaCroix, A. N., & Rogalsky, C. (2021). Distinct contributions of working memory and attentional control to sentence comprehension in noise in persons with stroke. Journal of Speech, Language, and Hearing Research, 64(8), 3230–3241. https://doi.org/10.1044/2021_JSLHR-20-00694
- Hétu, R., Riverin, L., Lalande, N., Getty, L., & St-Cyr, C. (1988). Qualitative analysis of the handicap associated with occupational hearing loss. British Journal of Audiology, 22(4), 251–264. https://doi.org/10.3109/03005368809076462
- Hsiao, E. Y., Schwartz, M. F., Schnur, T. T., & Dell, G. S. (2009). Temporal characteristics of semantic perseverations induced by blocked-cyclic picture naming. Brain and Language, 108(3), 133–144. https://doi.org/10.1016/j.bandl.2008.11.003
- Hula, W. D., & McNeil, M. R. (2008, August). Models of attention and dual-task performance as explanatory constructs in aphasia. In Seminars in Speech and Language, 29(3), 169–187. https://doi.org/10.1055/s-0028-1082882
- Jefferies, E., Baker, S. S., Doran, M., & Ralph, M. A. L. (2007). Refractory effects in stroke aphasia: a consequence of poor semantic control. Neuropsychologia, 45(5), 1065–1079. https://doi.org/10.1016/j.neuropsychologia.2006.09.009
- Kidd, G. Jr., Best, V. and Mason, C.R. (2008). Listening to every other word: Examining the strength of linkage variables in forming streams of speech. The Journal of the Acoustical Society of America. 124, 3793–3802. https://doi.org/10.1121/1.2998980
- Kertesz, A. (2007). WAB-R: Western Aphasia Battery-Revised. New York, NY: Grune & Stratton.
- Kidd, G., & Colburn, H. S. (2017). Informational masking in speech recognition. In J. C. Middlebrooks, J. Z. Simon, A. N. Popper, & R. R. Fay (Eds.), The Auditory System at the Cocktail Party, New York: Springer, 75–109. https://doi.org/10.1007/978-3-319-51662-2_4
- Kidd Jr, G., Mason, C. R., Swaminathan, J., Roverud, E., Clayton, K. K., & Best, V. (2016). Determining the energetic and informational components of speech-on-speech masking. The Journal of the Acoustical Society of America, 140(1), 132–144. https://doi.org/10.1121/1.4954748
- Kiran, S., & Thompson, C. K. (2003). Effect of typicality on online category verification of animate category exemplars in aphasia. Brain and Language, 85(3), 441–450. https://doi.org/10.1016/S0093-934X(03)00064-6
- Kramer, S. E., Kapteyn, T. S., & Houtgast, T. (2006). Occupational performance: Comparing normally-hearing and hearing-impaired employees using the Amsterdam Checklist for Hearing and Work. International Journal of Audiology, 45(9), 503–512. https://doi.org/10.1080/14992020600754583
- Lang, C. J., & Quitz, A. (2012). Verbal and nonverbal memory impairment in aphasia. Journal of Neurology, 259(8), 1655–1661. https://doi.org/10.1007/s00415-011-6394-1
- Meier, E. L., Lo, M., & Kiran, S. (2016). Understanding semantic and phonological processing deficits in adults with aphasia: Effects of category and typicality. Aphasiology, 30(6), 719–749. https://doi.org/10.1080/02687038.2015.1081137
- Mick, P. T., & Lin, F. R. (2013). Social isolation and hearing loss in the elderly. Otolaryngology—Head and Neck Surgery, 149(2_suppl), P110–P110. https://doi.org/10.1177/0194599813495815a228
- Middlebrooks, J. C., Simon, J. Z., Popper, A. N., & Fay, R. R. (Eds.). (2017). The Auditory System at the Cocktail Party (Vol. 60). New York: Springer.
- Murray, L. L. (2012). Attention and other cognitive deficits in aphasia: Presence and relation to language and communication measures. American Journal of Speech-Language Pathology 21(2), S51–S64. https://doi.org/10.1044/1058-0360(2012/11-0067)
- Oberfeld, D., & Kloeckner-Nowotny, F. (2016). Individual differences in selective attention predict speech identification at a cocktail party. Elife, 5, e16747. https://doi.org/10.7554/eLife.16747
- Potagas, C., Kasselimis, D., & Evdokimidis, I. (2011). Short-term and working memory impairments in aphasia. Neuropsychologia, 49(10), 2874–2878. https://doi.org/10.1016/j.neuropsychologia.2011.06.013
- Rankin, E., Newton, C., Parker, A., & Bruce, C. (2014). Hearing loss and auditory processing ability in people with aphasia. Aphasiology, 28(5), 576–595. https://doi.org/10.1080/02687038.2013.878452
- Schnur, T. T., Schwartz, M. F., Brecher, A., & Hodgson, C. (2006). Semantic interference during blocked-cyclic naming: Evidence from aphasia. Journal of Memory and Language, 54(2), 199–227. https://doi.org/10.1016/j.jml.2005.10.002
- Silkes, J. P., Baker, C., & Love, T. (2020). The time course of priming in aphasia: An exploration of learning along a continuum of linguistic processing demands. Topics in Language Disorders, 40(1), 54. https://doi.org/10.1097/TLD.0000000000000205
- Silkes, J. P., & Winterstein, K. (2017). Speech-language pathologists’ use of hearing screening for clients with aphasia: challenges, potential solutions, and future directions. American Journal of Speech-Language Pathology, 26(1), 11–28. https://doi.org/10.1044/2016_AJSLP-14-0181
- Villard, S. & Kidd, G. (2019). The effects of acquired aphasia on the recognition of speech under energetic and informational masking conditions. Trends in Hearing, 23, 1–22. https://doi.org/10.1177/2331216519884480
- Villard, S. & Kidd, G. (2020). Assessing the benefit of acoustic beamforming for listeners with aphasia using modified psychoacoustic methods. Journal of the Acoustical Society of America, 148(5), 2894–2911. https://doi.org/10.1121/10.0002454
- Villard, S. & Kiran, S. (2015). Between-session intra-individual variability in sustained, selective, and integrational non-linguistic attention in aphasia. Neuropsychologia, 66, 204–212. https://doi.org/10.1016/j.neuropsychologia.2014.11.026
- Villard, S. & Kiran, S. (2017). To what extent does attention underlie language in aphasia? Aphasiology, 31(10), 1226–1245. https://doi.org/10.1080/02687038.2016.1242711
- Villard, S., & Kiran, S. (2018). Between-session and within-session intra-individual variability in attention in aphasia. Neuropsychologia, 109, 95–106. https://doi.org/10.1016/j.neuropsychologia.2017.12.005
- Zhang, M., Pratt, S. R., Doyle, P. J., McNeil, M. R., Durrant, J. D., Roxberg, J., & Ortmann, A. (2018). Audiological assessment of word recognition skills in persons with aphasia. American Journal of Audiology, 27(1), 1–18. https://doi.org/10.1044/2017_AJA-17-0041