
ABSTRACT
This study first aimed to investigate disfluency clusters in typical and atypical Finnish adult speakers. Secondly, it aimed to observe possible fluency strategies in speakers representing different fluency levels. In addition to individual disfluency types, we examined different characteristics of disfluency clusters produced by 23 speakers in a fluency continuum. Three adult speaker groups participated in this study: typical speakers with high disfluency frequencies (GA), typical and atypical speakers with very high disfluency frequencies (GB) and atypical speakers with the highest disfluency frequencies (GC). Data were based on a narrative speech task, and disfluency clusters were analysed with both traditional methods and alternative methods. Two statistically significant differences between the speaker groups were found: 1) the length of the clusters was highest in GC compared to other groups, and 2) speakers in GC formulated their utterances more than other groups. Other results, although nonsignificant, were that 3) speakers in GA revised utterances more often than interrupted them compared to GB and GC speakers, and 4) clusters using repetitive words and phrases to maintain fluency were found in GA and GB only. In this study, different fluency levels revealed different strategies in both the production of single disfluencies and in disfluency clusters. It seems that more fluent speakers formulate their messages differently than less fluent speakers, and repetitions can be used to maintain fluency and possibly prevent difficult clusters, as noted with more fluent speakers.
Introduction
Typical disfluencies in adults
Disfluencies are part of typical fluent speech (Bortfeld et al., Citation2001; Fox Tree, Citation1995), indicating the natural processes of planning and production of speech and language (Levelt, Citation1989). Disfluencies can be classified in several ways, e.g., into hesitations and self-repairs (Lickley, Citation2015) or stuttering-like disfluencies (involuntary repetitions, prolongations and tense pauses) and other disfluencies (filled pauses, word and phrase repetitions, revisions and incomplete phrases) (Tetnowski & Scott, Citation2010). Both types occur in all speech: typical speakers may produce stuttering-like disfluencies, and persons who stutter (PWS) produce other disfluencies, too. The difference between the two speaker groups lies in the incidence rate of various disfluency types.
Theoretically, disfluencies can be seen as signs of covert errors (cognitive view) (Heeman, Citation1997; Levelt & Cutler, Citation1983; Shriberg, Citation1999) or as a natural part of conversation, often with a pragmatic or communicative function (strategic view) (Allwood et al., Citation1990; Clark & Wasow, Citation1998). For example, Lickley’s (Citation2015) classification of hesitations and repair-type disfluencies represents a cognitive point of view. Accordingly, hesitations are thought to be used to stall language formulation and to repair errors. Because of its clinical nature, speech-language pathology (logopedics) focuses on disordered speech and its symptoms, and thus, disfluencies are mostly examined from the cognitive perspective (Lickley, Citation2015; Moore & Korpijaakko-Huuhka, Citation1996).
From the strategic point of view, disfluencies are considered as functional communication tools (). Thus, interruptions may serve the speaker in formulating language by detecting errors in language structure, speech production or in rhetoric (Allwood et al., Citation1990; Arnold et al., Citation2003; Levelt, Citation1983; Peltonen & Lintunen, Citation2016; Postma, Citation2000; Segalowitz, Citation2010; Shriberg, Citation1994). With revisions, then, the speaker edits detected errors by deleting, reordering, inserting, and substituting (Postma, Citation2000; Segalowitz, Citation2010; Shriberg, Citation1994). In conversations with filled pauses, the speaker may maintain the floor, seek attention, or send a signal to the listener that some help is desired, or filled pauses can reflect that too many options are available for the speaker while planning the message (see Eklund & Wirén, Citation2010). With word and sentence repetitions, the speaker may create narrative cohesion for the listener by connecting utterances (Barr & Keysar, Citation2002; Peltonen & Lintunen, Citation2016). Repetitions may also be used to stall or restart the message. Based on factor analysis, Penttilä and Korpijaakko-Huuhka (Citation2019) proposed that interruptions and revisions serve as language formulation tools, filled pauses as message planning tools, and word and phrase repetitions as tools for maintaining fluency.
Table 1. Proposed functional fluency tools (modified after Penttilä & Korpijaakko-Huuhka, Citation2019, p. 35)
Fluency skills vary between speakers, and disfluency frequency depends on several factors, like the speaker’s age and sex, speech task, topic, and language (e.g., De Andrade & De Oliveira Martins, Citation2007, Citation2010; Beke et al., Citation2014; Shriberg, Citation2005). In typical English-speaking populations, disfluency frequency – the proposition of disfluent syllables in all syllables – has been approximately 6% with a wide variation (Fox Tree, Citation1995; Roberts et al., Citation2009). For example, Roberts et al. (Citation2009) assessed the fluency of 25 native speakers and found that the proportion of disfluencies ranged between 2.3% and 13.0% depending on the speech task (mean of 6.87% (SD = 2.71) in describing one’s work vs. 7.56% (SD = 2.27) in describing one’s hobby). In Hungarian spontaneous narratives about speakers’ lives, typical adults produced 16.86 (SD = 8.67) disfluencies in a 200-syllable sample (Bóna, Citation2018), or around 8.4 disfluencies per 100 syllables.
Previous studies of Finnish fluency have mainly focused on temporal aspects of speech like speech rate and pauses (e.g., Moore & Korpijaakko-Huuhka, Citation1996), psycholinguistic aspects of speech like slips of the tongue and self-repairs (e.g., Hokkanen, Citation2001), or on second language fluency (Peltonen, Citation2020). Only one fundamental study of disfluencies in Finnish-speaking adults exists (Penttilä et al., Citation2018; original publication in Finnish, its sequel in English by Penttilä & Korpijaakko-Huuhka, Citation2019). In that study, adults (N = 70) produced 0–7.8 disfluencies per 100 syllables in a story generation task (M = 2.3, SD = 2.25).
In various languages, the most common disfluency in typical speakers is filled pauses (Bortfeld et al., Citation2001; McDougall & Duckworth, Citation2017). Also, segment prolongations are very common disfluencies in typical speech (Eklund, Citation2001). Filled pauses indicate, for example, that speakers are not ready to continue their expression (Bortfeld et al., Citation2001; McDougall & Duckworth, Citation2017). Thus, Eklund and Wirén (Citation2010) remind that filled pauses serve several functions, possibly even more than just one function at the same time. In English, pauses are typically filled with uh, uhm and er (Roberts et al., Citation2009); in Hungarian with ö, m, öm and öh (Horváth, Citation2010); and in Finnish with öö, mm and ää (Penttilä & Korpijaakko-Huuhka, Citation2019; Penttilä et al., Citation2018). In Finnish-speaking adults, up to 28.0% of all disfluencies were filled pauses, while word repetitions accounted for 18.9%, followed by interruptions (18.4%) (Penttilä & Korpijaakko-Huuhka, Citation2019; Penttilä et al., Citation2018). Interestingly, the frequency of interruptions was highest in the most disfluent typical speakers (disfluency frequencies 5.6–7.8%) compared to other speakers (disfluency frequencies 0.0–5.2%). It seems that there are differences in the quality of disfluency types based on the disfluency frequency.
Disfluencies in atypical speech
In logopedics, the focus of (dis)fluency studies in adults has mostly been in stuttering-like disfluencies present, for example, in persisting developmental stuttering (Juste & De Andrade, Citation2011; Robb et al., Citation2009), after stroke or traumatic brain injury (TBI) (Jokel et al., Citation2007; De Nil et al., Citation2017), and in Parkinson’s disease (Goberman et al., Citation2010; Juste et al., Citation2018). Other research fields such as psychology (e.g., Lake et al., Citation2011) and computer science (e.g., Guinn & Habash, Citation2012) have increased their interest in disfluencies in adults without a classic fluency disorder (e.g., stuttering, cluttering) during the last decade. For example, disfluencies have been studied in autism spectrum disorder (ASD) (Lake et al., Citation2011) and dementia (Guinn & Habash, Citation2012). Logopedic fluency studies in adults without a classical fluency disorder (stuttering or cluttering) are rare (Wiklund & Laakso, Citation2019), although they could have both theoretical and clinical implications for speech therapy practice.
Lake et al. (Citation2011) investigated disfluencies from a strategic point of view in adults with ASD. They found that speakers with ASD (n = 13) produced fewer filled pauses (ums and uhs) and revisions than speakers in the control group (n = 13). In contrast, speakers with ASD produced more silent pauses and stuttering-like disfluencies compared to controls. Speakers with ASD have social and linguistic impairments which reflects, for example, a lack of interest in interacting with others (American Psychiatric Association [APA], Citation2013); thus, both filled pauses and revisions can be interpreted as listener-oriented features of speech (Lake et al., Citation2011).
While filled pauses are rarely produced by speakers with ASD (Lake et al., Citation2011), speakers with developmental intellectual disabilities produce more filled pauses than control speakers (Coppens-Hofman et al., Citation2013; Jankovics & Garai, Citation2019; Rossi et al., Citation2011). For example, Jankovics and Garai (Citation2019) noticed that adults with mild intellectual disability (MID; n = 10) used filled pauses more in both dialogue (interview) and monologue (picture story task) compared to control speakers (n = 10). Interestingly, in dialogue, control speakers produced revision more often than speakers with MID. Jankovics and Garai (Citation2019) interpreted that the filled pauses of speakers with MID reflected their lowered processing capacity of language planning. The higher frequency of revisions in the dialogue of the control group, on the other hand, was interpreted to indicate typical speakers’ attempts to (with revisions) improve the message for the communication partner. This finding aligns with Lake et al.’s (Citation2011) study in which speakers with ASD rarely revised their utterances.
In a small group (N = 10) of Finnish speakers with traumatic brain injury (TBI), the mean disfluency frequency was as high as 15.5% (SD = 10.02, range 7.0–38.4%) (Penttilä et al., Citation2019). Interruptions (38.1% of all disfluencies) and filled pauses (31.7%) were the two most common disfluency types followed by revisions (20.9%). Frequent interruptions found in speakers with TBI possibly reflected the speakers’ need to formulate their speech, although they did not have the skills required to repair the interrupted utterances (Penttilä et al., Citation2019). It is known that the impact of TBI on higher cognitive functions (e.g., attention, executive functions and language), social functioning and impairments can cause difficulties in organizing and structuring linguistic information, flow of thought, interaction and turn-taking (Davis & Coelho, Citation2004; McDonald et al., Citation2014; Raukola-Lindblom et al., Citation2020). Although the pathologies in ASD and TBI are different, there are similarities in the impairment of the speakers’ social and communication skills, and therefore, the low frequency of revisions in speakers with TBI (Penttilä et al., Citation2019) may be due to weakened communications skills (revisions as a listener-oriented feature; Lake et al., Citation2011) or language processes (revisions as a formulation strategy; Penttilä & Korpijaakko-Huuhka, Citation2019).
Disfluency clusters
Disfluency clusters are aggregates of disfluencies that occur within a word or in adjacent words, possibly indicating more severe speech planning difficulties than single disfluencies (Bóna, Citation2018, Citation2019: Robb et al., Citation2009). One way to categorize disfluency clusters is based on a disfluency taxonomy (Ambrose & Yairi, Citation1999; Yaruss, Citation1998). Accordingly, stuttering-like-disfluencies (SLDs) include at least two sound and syllable repetitions, prolongations or blocks in the same or adjacent words, and other disfluencies (ODs) consist of at least two filled pauses, revisions, interruptions or repetitions of words and phrases (LaSalle & Hu-man, Citation2015; Robb et al., Citation2009). As expected, MIX clusters contain both OD- and SLD-type disfluencies (Robb et al., Citation2009; Sawyer & Yairi, Citation2010).
Existing studies of disfluency clusters are mostly based on data from children with developmental stuttering (LaSalle & Huffman, Citation2015; Sawyer & Yairi, Citation2010) and from adults with persistent stuttering (Robb et al., Citation2009) or cluttering (Bóna, Citation2018, Citation2019; Myers et al., Citation2012, Citation2008). There are only a couple studies on disfluency clusters in typical adult speakers (Bóna, Citation2018, Citation2019; Myers et al., Citation2012), and even rarer are studies on disfluency clusters in atypical speech without classical fluency disorders (Penttilä et al., Citation2019).
Myers et al. (Citation2012) investigated disfluencies and disfluency clusters in fluent adults and in adults with developmental cluttering (PWC). The mean number of produced disfluency clusters for fluent adults was 3.2 (SD = 2.41) in 400 syllables. The most common disfluency cluster type was OD, which consists of filled pauses, revisions, and word repetitions. Bóna (Citation2018) studied disfluency clusters in nine adults with cluttering (PWC) and compared them to typical speakers (n = 9). In a 300-syllable speech sample, typical speakers produced a mean of 4.8 disfluency clusters (SD = 4.2). As expected, clusters in typical speech were short, and only 24.5% of them consisted of more than two disfluencies. Contrarily, Penttilä et al. (Citation2019) found that speakers with TBI without a diagnosed fluency disorder produced more clusters (M = 6.3, SD = 3.46, range 2–14) than typical speakers. The clusters were also longer than in typical speech: 76.2% consisted of more than two disfluencies, typically multiple revisions. In some cases, repeated attempts to revise the message resulted in forgetting the topic, reflecting problems with higher cognitive functions typical of people with TBI (McDonald et al., Citation2014).
Purpose of the present study
As disfluent speech increases in certain developmental (e.g., autism; Wiklund & Laakso, Citation2019), acquired (e.g., traumatic brain injury; Penttilä et al., Citation2019) and neurodegenerative (e.g., dementia; Guinn & Habash, Citation2012) diseases, it is important to increase our knowledge of disfluencies at different fluency levels, especially at the weaker end of the fluency continuum. In this pilot study, we explored disfluencies and disfluency clusters with both traditional and alternative methods (see Methods section below), especially in relation to the frequency of disfluencies on a fluency continuum. Investigating (dis)fluency at different fluency levels on this continuum should increase our understanding of possible fluency-improving strategies used by typical and atypical speakers and of speech production processes in general.
In this study, we examined disfluencies and disfluency clusters found in three speaker groups: speakers with high (M = 5.51%, SD = 0.41), very high (M = 7.53%, SD = 1.20) and the highest disfluency frequency (M = 22.1%, SD = 10.87) levels. We addressed the following research questions:
What kinds of disfluencies and disfluency clusters are produced in speaker groups of different fluency levels?
Do the disfluencies or disfluency clusters differ in these speaker groups?
Do the clusters differ in their linguistic functions between the fluency levels?
Based on the previous literature, we expect to find some differences between the groups, especially in relation to the quality of disfluency types (Jankovics & Garai, Citation2019; Lake et al., Citation2011; Penttilä & Korpijaakko-Huuhka, Citation2019). As to the linguistic functions and fluency strategies of disfluency clusters, no research has been published so far. Therefore, this pilot study will be the first to report possible functional aspects of disfluency clusters.
Methods
Participants
A total of 23 speakers were chosen for this study, of which 14 were typical speakers and 9 atypical. The 14 typical speakers were selected from a corpus of 70 typical Finnish speakers (Penttilä, Citation2019; Penttilä et al., Citation2018). These 70 were classified with cluster analysis (centroid linkage) into five groups based on their disfluency frequency: very high fluency (n = 17), high fluency (n = 17), average fluency (n = 22), fluency lower than average (n = 3) and low fluency (n = 11). The 14 selected speakers belonged to the last two groups, thus representing the highest disfluency frequencies of the 70 typical speakers (). Seven of these selected speakers were male and seven were female. Their mean age was 44.4 years (SD = 15.1, range 29–89).
Table 2. Participant groups
The nine atypical speakers, who suffer from TBI, were also selected for this study from a larger dataset (N = 20) (Penttilä, Citation2019; Penttilä et al., Citation2019). Their brain injury was verified with CT or MRI. They showed various communication disorders (aphasia, apraxia of speech and dysarthria) due to their injury, and they suffered from multifaceted cognitive deficits in memory, attention, problem solving and executive functions. None of them, however, stuttered. Eight of these speakers were male and one was female. Their mean age was 46.3 years (SD = 11.6, range 34–64).
For this study, these 23 speakers were classified into three groups according to their disfluency frequency in a semispontaneous speech sample with hierarchical cluster analysis. Disfluency frequencies differed statistically significantly between each speaker group (Kruskal-Wallis: H(2, 23 = 19,076, p = .001). Group A (GA) consisted of eight typical speakers with high disfluency frequencies: 4.9–6.0%. Group B (GB) had 10 speakers with (n = 4) and without (n = 6) TBI with very high disfluency frequencies: 6.1–10.0%. Group C (GC) consisted of five speakers with TBI with the highest disfluency frequencies: 10.1–39.7% ().
Speech sample
The 23 participants were asked to generate a story based on a 9-frame comic strip, Ferd’nand, by Henning Dahl Mikkelsen (year unknown). The narrative speech samples were recorded using a Zoom H2 device (see Penttilä & Korpijaakko-Huuhka, Citation2019; Penttilä et al., Citation2019). The same narrative task has commonly been used in speech and language studies in Finland (e.g., Korpijaakko-Huuhka & Lind, Citation2012; Moore & Korpijaakko-Huuhka, Citation1996) as well as in clinical settings. The transcribed stories varied in length; the mean number of syllables in the stories was 196.4 (SD = 36.6) with a wide variation (range 144–298). Although the length of the text might influence speech fluency, we used all the speech samples because this method works well in clinical practice to assess speech disorders. The differences between the speech samples were compensated by calculating the frequency of disfluencies and disfluency clusters per 100 syllables.
Analyses of disfluencies and disfluency clusters
From the orthographic transcripts, frequencies of the following disfluency types were counted: (a) stuttering-like disfluencies (SLDs), including repetitions (sound, syllable and part-word), involuntary prolongations and blocks, and (b) other disfluencies (ODs) including filled pauses, word repetitions, phrase repetitions, interruptions and revisions (Ambrose & Yairi, Citation1999). The total disfluency frequency is the total number of SLDs and ODs per 100 syllables. The analyses’ reliability was double-checked by the principle investigator N.P.
A disfluency cluster was defined as the occurrence of two or more disfluencies in the same word and/or consecutive words (Colburn, Citation1985; Sawyer & Yairi, Citation2010). A disfluency cluster started when at least two disfluencies occurred adjacent to each other and ended when speakers either managed to continue their message fluently or when they abandoned the message and started a new utterance on a different topic. Each cluster was classified by type as SLD, OD or MIX (Sawyer & Yairi, Citation2010). The total number of clusters and the number of each cluster type per speaker were determined. Next, the mean length of clusters was calculated based on the number of disfluent units, i.e. individual disfluencies, in each cluster. For example, a MIX-type cluster “he um he wou-wou-would go” contains three units.
In addition to the traditional way to classify disfluency clusters into SLD, OD and MIX types, they were further evaluated based on their disfluency characteristics into five functional groups, four of which (formulation, planning, maintenance, articulation) were based on the factors found in Penttilä and Korpijaakko-Huuhka (Citation2019) study. The fifth cluster class (combination) was created for this study. The function of each cluster was interpreted based on the most common disfluency type(s) in the disfluency cluster. Accordingly, if the most common disfluency units in a cluster were revisions or interruptions, the function of the cluster was interpreted to be ‘language formulation’ (see ). If most units were filled pauses, it was thought to indicate ‘message planning’. If most of the cluster included word and phrase repetitions, the function was considered ‘fluency maintenance’. Finally, if the units included mostly stuttering-like disfluencies, the cluster was thought to indicate ‘articulation’ difficulties. When an equal number of disfluencies (e.g., filled pause+interruption+filled pause+revision) carried two different functions (e.g., language formulation and message planning, respectively), the function was named as a “combination strategy”.
Results will be presented as distributions of different features, as well as with other descriptive statistics. Because of the small number of participants, group differences were tested with the nonparametric Kruskal–Wallis test and correlations with Spearman’s rank order correlation test. Statistical significance was set at p ≤ .05, and significance p-values were adjusted by the Bonferroni correction in multiple comparisons.
Results
Disfluencies and disfluency clusters
Our first research question asked what kinds of disfluencies and disfluency clusters are produced in speaker groups representing different fluency levels. We found out that the most common single disfluency type in each speaker group was filled pauses (). A total of 112 disfluency clusters were analysed: 29 in GA, 45 in GB and 38 in GC. The most common cluster type in each speaker group was OD, secondly MIX. No stuttering-like clusters (SLD) were found, even if some speakers in all groups produced a few stuttering-like sound or syllable repetitions in their clusters.
Table 3. Descriptives of disfluencies and disfluency clusters
Differences between the speaker groups
The second research question concerned possible differences in disfluencies and disfluency clusters between the speaker groups. Only statistical difference between the groups was the length of the clusters (X2(2, 23) = 7089, p = .029). In GA, 65.5% of the clusters contained two units (disfluencies), in GB 44% and in GC only 34.2%. With a pairwise comparisons, we tested the equality of the distributions with each pair (GA = GB, GA = GC, GB = GC) and noted that the clusters were statistically longer in GC than in GA (X2(1, 23) = −10 187, p = .024). Significance values were adjusted by the Bonferroni correction.
In addition, multiple nonstatistical differences were found. Based on single disfluencies, speakers in GA revised utterances more often than they interrupted them compared to GB and GC speakers (). As for disfluency clusters, speakers in GC produced more mixed clusters (MIX) than speakers in GA and GB. Also, the number of clusters was highest in GC.
Functions of disfluency clusters
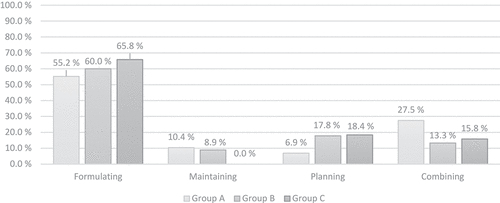
Our third research question asked if the clusters differ in their linguistic functions between the fluency levels. As seen in , the most common function of disfluency clusters in each speaker group represented language formulation with the help of revisions and interruptions. This function differed between groups statistically significantly (X2(2, 23), 7333, p = .026). With pairwise comparisons, we tested the equality of the distributions with each pair (GA = GB, GA = GC, GB = GC) and noted that speakers in GC formulated their message in the clusters statistically more often (X2(2, 23), −10 200, p = .022) than speakers in GA. Significance values were adjusted by the Bonferroni correction.
Figure 1. Functions of disfluency clusters in each speaker group
When different variables were examined in all participants (N = 23), we found that the length of clusters correlated with the number of MIX clusters (rs = 0.511, p = .013), the number of all clusters (rs = 0.488, p = .018), and to combined clusters containing formulation and planning strategies (rs = 0.492, p = .017). In addition, several variables impacted the number of clusters; formulation clusters (rs = 0.763, p = .000), planning clusters (rs = 0.681, p = .000) and combination clusters (rs = 0.543, p = .007) increased the number of clusters, as well as the number of interruptions (rs = 0.568, p = .005) and revisions (rs = 0.446, p = .033).
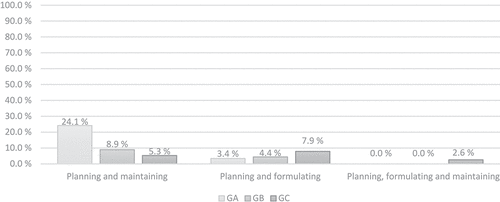
Other significant differences between the functions of disfluency clusters were not found, although there were different proportions of maintaining, planning and combination clusters among the groups. Clusters of repetitive words and phrases functioning to maintain fluency were found in GA and GB only. Planning the message as indicated by filled pauses was lowest in GA, but it increased in GB and GC. Almost one-third of all disfluency clusters in GA were labeled as combination strategies as they consisted of equal numbers of different disfluencies. In contrast, in GB and GC, less than one-sixth of all the clusters were these combinations. Unlike other speaker groups, the most common functions of the combined clusters in GA were planning and maintaining (). Clusters including mostly stuttering-like disfluencies were not found; therefore, clusters indicating articulation difficulties (fourth factor in Penttilä & Korpijaakko-Huuhka, Citation2019) were not found.
Figure 2. Functions in combination clusters in each speaker group
Discussion
The present study aimed to examine the characteristics of disfluency features in three speaker groups with different fluency levels: typical speakers with high disfluency frequencies (GA), typical and atypical speakers with very high disfluency frequencies (GB) and atypical speakers with the highest disfluency frequencies (GC). Two statistically significant results were found: 1) the length of the clusters was highest in GC compared to other groups, and 2) speakers in GC formulated their utterances more than other groups. Other results, although nonsignificant, were that 3) speakers in GA revised utterances more often than interrupted them compared to GB and GC speakers, and 4) clusters using repetitive words and phrases to maintain fluency were found in GA and GB only. This Discussion section is ordered according to these findings.
Disfluency clusters in different fluency levels
The length of disfluency clusters varied statistically significantly according to fluency level. In GA, 65.5% of the clusters contained two units (disfluencies), which is close to Bóna’s (Citation2018) finding that in typical speakers, 75.5% of the clusters contain only two units. In GB and GC, the proportions of short (two units) clusters were lower: 44% and 34.2%, respectively. The high proportion of longer clusters (3 or more units) in the latter two speaker groups may be due to lower fluency skills resulting from aphasia or other cognitive deficits caused by TBI (McDonald et al., Citation2014). Therefore, these lower fluency skills probably manifested in longer and more complicated clusters, especially in multiple revisions without satisfactory outcomes, thus intermitting speech flow.
The mean number of disfluency clusters in the speech task increased, as expected, with increasing disfluency frequency, from 3.6 in GA to 4.5 in GB and 7.6 in GC. Still, this result was not statistically significant. Previous studies have shown that fluent adults produce approximately 3–5 (Myers et al., Citation2012; Bóna, Citation2018, respectively) disfluency clusters per speech sample. Our results match nicely with the range found in previous studies, as GA participants were all typical adult speakers, as were half of the GB speakers. The results of different studies do not seem critically dependent on the speech samples’ size: 300 syllables in study by Bóna (Citation2018), 400 syllables in Myers et al. (Citation2012), and 144–298 syllables in this study.
Language formulation as a fluency strategy
The most common function of disfluency clusters for all groups was language formulation (including interruptions and/or revisions). Speakers in GA, however, formulated their utterances during speaking statistically significantly less than speakers in GC (p = .022). Strategically, in future studies, it would be interesting to also consider formulation as a listener-oriented strategy as Lake et al. (Citation2011) did. Accordingly, speech therapy interventions could focus on supporting patients to formulate their language output instead of trying to decrease occurring disfluencies.
The result that speakers in GA formulated their utterances less often than speakers in GC may be explained by the fact that speakers in GC had TBI with multiple cognitive deficits. Still, we can search for other explanations by observing the proportional differences of revisions and interruptions in these speaker groups. For example, according to Jankovics and Garai (Citation2019) and Lake et al. (Citation2011) typical speakers revise their messages more frequently than those with MID or ASD. In our study, typical speakers in group A (with high disfluency frequencies) revised their message twice (18.1%) as often as they interrupted (9.6%) it. In contrast, group B of both typical and atypical speakers (with very high disfluency frequencies), and group C of atypical speakers only (with the highest disfluency frequencies), more often interrupted (GB:23.0% and GC:33.3%) than revised (GB:20.1% and GC:20.8%). Although these proportional differences between the three groups were not statistically significant, we can speculate that perhaps the speakers in GA had a different and maybe more efficient formulation strategy than speakers with lower fluency skills (GB; GC). It is possible that speakers with better fluency skills improve their expressions using multiple revisions, such as inserting and substituting words, while those with lower fluency skills interrupt their speech without necessarily revising it. This is something that would be interesting to study in the future by analysing the subfunctions (e.g., insertions, substitutions) of disfluencies in formulation clusters.
Maintaining fluency with repetitions
As shown in different studies, repetitions are good tools for creating time, structuring, and connecting utterances (Barr & Keysar, Citation2002; Peltonen & Lintunen, Citation2016). In this study, speakers in GA repeated words and phrases more, both separately and in clusters, compared to groups with lower fluency skills (GB; GC). Additionally, unlike GC, both GA and GB produced disfluency clusters by repeating words and phrases which function only for maintaining fluency. Although these differences were not significant, they should be noted.
There may be several reasons why speakers in GA repeated words more often than the other groups and why only GA and GB speakers had fluency maintaining clusters. It has been assumed that disfluency clusters occur because the speaker detects an error and tries to correct it (Penttilä et al., Citation2019; Robb et al., Citation2009). Also, disfluencies occurring in clusters seem to indicate more severe speech planning difficulties than single disfluencies (Bóna, Citation2018, Citation2019; Robb et al., Citation2009). As the repetitions occurred more often in GA, which also had the lowest number of disfluency clusters and the shortest clusters, it may be possible that the fluency maintaining clusters do not indicate more severe planning difficulties. Rather, they probably prevented other, possibly more severe, disfluency clusters (formulation, planning, and combination clusters) from occurring. This hypothesis is supported by the fact that these clusters containing repetitions did not statistically influence the number of disfluency clusters like the other functions did. This model of thinking should be considered with caution as it is based on a very small sample.
Methodological considerations and future directions
When observing these study results, one should keep in mind that several different analyses were done on speech samples from a relatively small number of people. Still, some statistical observations with nonparametric tests were completed. Statistically significant differences were found only in the length of clusters and in the amount of formulation clusters between groups GA and GC. Other discussed differences are based on descriptive differences.
The selection of subjects for this study was reliable, as the classification of speakers was based on a hierarchical cluster analysis of speakers’ disfluency frequencies showing statistically significant differences between the three speaker groups. The three groups contained either typical (GA) or atypical speakers (GC) or both (GB). Thus, this study shows that the relation of disfluency frequencies with fluency strategies can be observed despite the speakers’ background. In the future, it would be beneficial to study this relationship in larger groups of speakers in order to examine the separate roles of aetiology, age, sex, and educational background. For example, as GA had more females than the other two groups, and since both the reported differences involved the GA group, sex-based differences should be observed in future studies. In addition, this study did not use a control group of fluent adults with average fluency skills, which may be a useful direction for future studies.
Some studies have measured disfluency frequencies based on words (Robb et al., Citation2009), and others are based on syllables (Jokel et al., Citation2007). Because of the special morphosyntactic structure of the Finnish language (see Helasvuo, Citation2008), syllables are more commonly used instead of words in Finnish studies. Therefore, cross-language comparisons are unfortunately limited because of these differences between Finnish and English, as well as many other languages.
The analyses used in this study were both traditional (disfluencies, disfluency frequency, disfluency clusters; Sawyer & Yairi, Citation2010) and alternative (functions of disfluency clusters; Penttilä & Korpijaakko-Huuhka, Citation2019). The alternative classification of fluency functions used in this study represents strategic thinking, which possibly opens a new perspective to other fluency studies, especially in the field of logopedics. This classification originally results from a factor analysis based on a corpus of speech samples and disfluencies of 70 speakers (Penttilä et al., Citation2018). The principle investigator guaranteed the reliability of the results by double-checking the analyses.
The results of this pilot study should be observed carefully due to the uncommon method of analysis as well as to the small group sizes and short speech samples. First, the names of the clusters (e.g., formulation clusters, planning clusters) are oversimplifications. Second, all the interpretations about the disfluency functions must be considered with caution, as it is difficult to tell from the outside, based solely on the transcripts, what is happening in the speakers’ minds. In addition, as formulation clusters statistically differentiated GA from GC, these clusters and their occurrences should be further studied with a larger data set, for example, by analysing their subfunctions: correcting, inserting, and substituting words and phrases (Arnold et al., Citation2003; Postma, Citation2000; Segalowitz, Citation2010).
The nature of the task used in fluency studies needs further consideration. In this study, the analyses of disfluency and disfluency clusters were performed on a semi-spontaneous speech sample based on a 9-frame comic strip (Ferd’nand by Henning Dahl Mikkelsen). Semi-spontaneous speech refers to speech elicited by situational pictures or retold stories (see Prins & Bastiaanse, Citation2004). The story generation task in this study, the ‘scarecrow story’, has commonly been used both in clinical and research settings in Finland (see Korpijaakko-Huuhka & Lind, Citation2012; Penttilä et al., Citation2018). Performing the task requires speakers to generate utterances instead of simply repeating or reading them. Stuttering studies have shown that both disfluencies and the number of clusters increase as syntactic complexity increases (e.g., Robb et al., Citation2009), and in typical speakers, the type of speech task impacts disfluency frequency (e.g., Roberts et al., Citation2009). Although this task may have restricted lexical and grammatical choices, it enabled more reliable comparisons between subjects compared to unpredictable spontaneous or totally fictional narratives. Still, data from dialogues must be considered in the future.
Conclusions
Different fluency levels revealed different strategies in both the production of single disfluencies and in disfluency clusters. First, the need to formulate utterances increased statistically with increasing disfluency frequency, as did the length of the clusters. Second, speakers with lower disfluency frequencies mostly revised their output, while speakers with higher disfluency frequencies most typically interrupted their speech. Third, repetitions can be used to maintain fluency and prevent difficult clusters, as noted in speakers with lower disfluency frequencies. Further analysis of the functions of disfluencies and disfluency clusters are needed, as the knowledge gained might have a clinical role in diagnostics and rehabilitation in speech therapy practice.
Disclosure of potential conflicts of interest
The authors report no conflict of interest.
Acknowledgments
We thank all the participants who volunteered to record their speech samples. The authors also appreciate the anonymous reviewers for their insightful comments. We would also like to thank statistician Jyrki Ollikainen for his advice on the statistical designs of this study, as well as M.A. Sirpa Myllymäki for the assistant work.
References
- Allwood, J., Nivre, J., & Ahlsén, E. (1990). Speech management: On the non-written life of speech. Nordic Journal of Linguistics, 13(1), 3–48. https://doi.org/https://doi.org/10.1017/S0332586500002092
- Ambrose, N., & Yairi, E. (1999). Normative disfluency data for early childhood stuttering. Journal of Speech, Language and Hearing Research, 42(4), 895–909. https://doi.org/https://doi.org/10.1044/jslhr.4204.895
- American Psychiatric Association (APA). (2013). Diagnostic and statistical manual of mental disorders (DSM-V) (5th ed.). American Psychiatric Association.
- Arnold, J., Fagnano, M., & Tanenhaus, M. (2003). Disfluencies signal theee, um, new information. Journal of Psycholinguistic Research, 32(1), 25–36. https://doi.org/https://doi.org/10.1023/A:1021980931292
- Barr, D., & Keysar, B. (2002). Anchoring comprehension in linguistic precedents. Journal of Memory and Language, 46(2), 391–418. https://doi.org/https://doi.org/10.1006/jmla.2001.2815
- Beke, A., Gósy, M., Horváth, V., Gyarmathy, D., & Neuberger, T. (2014). Disfluencies in spontaneous narratives and conversations in Hungarian. In S. Fuchs, M. Grice, A. Hermes, L. Lancia, & D. Mücke (Eds.), Proceedings of the 10th international seminar on speech production (ISSP) (pp. 29–32). International Seminar on Speech Production. http://www.issp2014.uni-koeln.de/wp-content/uploads/2014/Proceedings_ISSP_revised.pdf
- Bóna, J. (2018). Disfluencies and disfluency clusters in cluttered, stuttered and typical speech. Beszédkutatás, 2018(26), 221–235. https://core.ac.uk/download/pdf/199193489.pdf#page=222
- Bóna, J. (2019). Clustering of disfluencies in typical, fast and cluttered speech. Journal of Clinical Linguistics & Phonetics, 33(5), 393–405. https://doi.org/https://doi.org/10.1080/02699206.2018.1513075
- Bortfeld, H., Leon, S., Bloom, J., Schober, M., & Brennan, S. (2001). Disfluency rates in conversation: Effects of age, relationship, topic, role, and gender. Language and Speech, 44(2), 123–147. https://doi.org/https://doi.org/10.1177/00238309010440020101
- Clark, H., & Wasow, T. (1998). Repeating words in spontaneous speech. Cognitive Psychology, 37(3), 201–242. https://doi.org/https://doi.org/10.1006/cogp.1998.0693
- Colburn, N. (1985). Clustering of disfluency in nonstuttering childrens' early utterances. Journal of Fluency Disorders, 10(1), 51–58. https://doi.org/https://doi.org/10.1016/0094-730X(85)90005-1
- Coppens-Hofman, M., Terband, H., Maassen, B., van Schrojenstein Lantman-de Valk, H., van Zaalen-op´t Hof, Y., & Snik, A. (2013). Dysfluencies in the speech of adults with intellectual disabilities and reported speech difficulties. Journal of Communication Disorders, 46, 46(5–6), 484–494. https://doi.org/https://doi.org/10.1016/j.jcomdis.2013.08.001
- Davis, G., & Coelho, C. (2004). Referential cohesion and logical coherence of narration after closed head injury. Brain and Language, 89(3), 508–523. https://doi.org/https://doi.org/10.1016/j.bandl.2004.01.003
- De Andrade, C. R. F., & De Oliveira Martins, V. (2007). Fluency variation in adolescents. Clinical Linguistics & Phonetics, 21(10), 771–782. https://doi.org/https://doi.org/10.1080/02699200701502161
- De Andrade, C. R. F., & De Oliveira Martins, V. (2010). Speech fluency variation in elderly. Pró-fono Revista De Atualizaçăo Científica, 22(1), 13–18. https://doi.org/https://doi.org/10.1590/s0104-56872010000100004
- De Nil, L., Theys, C., & Jokel, R. (2017). Stroke-related acquired neurogenic stuttering. In P. Coppens & J. Patterson (Eds.), Aphasia rehabilitation. Clinical challenges (pp. 173–202). Jones & Bartlett Learning.
- Eklund, R. (2001). Prolongations: A dark horse in the disfluency stable. In ISCA tutorial and research workshop (ITRW) on disfluency in spontaneous speech, pp. 5–8, August 29–31 2001. University of Edinburgh.
- Eklund, R., & Wirén, M. (2010). Effects of open and directed prompts on filled pauses and utterance production. Proceedings of FONETIK 2010, 2–4 June 2010, pp. 23–28. Lund, Sweden.
- Fox Tree, J. (1995). The effects of false starts and repetitions on the processing of subsequent words in spontaneous speech. Journal of Memory and Language, 34(6), 709–738. https://doi.org/https://doi.org/10.1006/jmla.1995.1032
- Goberman, A., Blomgren, M., & Metzger, E. (2010). Characteristics of speech disfluency in Parkinson disease. Journal of Neurolinguistics, 23(5), 470–478. https://doi.org/https://doi.org/10.1016/j.jneuroling.2008.11.001
- Guinn, C., & Habash, A. (2012). Language analysis of speakers with dementia of the Alzheimer’s type. AAAI fall symposium: artificial intelligence for gerontechnology, 8–13.
- Heeman, P. (1997). Speech repairs, intonational boundaries and discourse markers: Modeling speakers’ utterances in spoken dialog. [PhD thesis]. Computer Science Department, University of Rochester.
- Helasvuo, M.-L. (2008). Aspects of the grammar of Finnish. In A. Klippi & K. Launonen (Eds.), Communication disorders across languages. Research in logopedics: Speech and language therapy in Finland (pp. 9–18). Multilingual Matters.
- Hokkanen, T. (2001). Slips of the tongue. Errors, repair, and a model [PhD thesis. Studia Fennica Linguistica 10]. Finnish Literature Society
- Horváth, V. (2010). Filled pauses in Hungarian: Their phonetic form and function. Acta Linguistica Hungarica, 57(2), 288–306. https://doi.org/https://doi.org/10.1556/ALing.57.2010.2-3.6
- Jankovics, J., & Garai, L. (2019). Disfluencies in mildly intellectually disabled young adults’ spontaneous speech. In R. Rose & R. Eklund (Eds.), Proceedings of DiSS 2019, The 9th workshop on disfluency in spontaneous speech (pp. 79–82). ELTE Eötvös Loránd University.
- Jokel, R., De Nil, L., & Sharpe, K. (2007). Speech disfluencies in adults with neurogenic stuttering associated with stroke and traumatic brain injury. Journal of Medical Speech-Language Pathology, 15(3), 243–261. ISSN 1065-1438.
- Juste, F., & De Andrade, C. (2011). Speech disfluency types of fluent and stuttering individuals: Age effects. Folia Phoniatrica Et Logopaedica, 63(2), 57–64. https://doi.org/https://doi.org/10.1159/000319913
- Juste, F. S., Sassi, F. C., Costa, J. B., & de Andrade, C. R. F. (2018). Frequency of speech disruptions in Parkinson’s Disease and developmental stuttering: A comparison among speech tasks. PloS One, 13(6), e0199054. https://doi.org/https://doi.org/10.1371/journal.pone.0199054
- Korpijaakko-Huuhka, A.-M., & Lind, M. (2012). The impact of aphasia on textual coherence: Evidence from two typologically different languages. Journal of Interactional Research in Communication Disorders, 3(1), 47–70. https://doi.org/https://doi.org/10.1558/jircd.v3i1.47
- Lake, J., Humphreys, K., & Cardy, S. (2011). Listener vs. speaker-oriented aspects of speech: Studying the disfluencies of individuals with autism spectrum disorders. Psychonomic Bulletin & Review, 18(1), 135–140. https://doi.org/https://doi.org/10.3758/s13423-010-0037-x
- LaSalle, L., & Huffman, G. (2015). Speech sample measures in Japanese children and adults who stutter. Journal of Speech, Language and Hearing, 18(2), 64–73. https://doi.org/https://doi.org/10.1179/2050572814Y.0000000049
- Levelt, W. (1983). Monitoring and self-repair in speech. Cognition, 14(1), 41–104. https://doi.org/https://doi.org/10.1016/0010-0277(83)90026-4
- Levelt, W. (1989). Speaking: From intention to articulation. A Bradford Book. The MIT Press.
- Levelt, W., & Cutler, A. (1983). Prosodic marking in speech repairs. Journal of Semantics, 2(2), 205–217. https://doi.org/https://doi.org/10.1093/semant/2.2.205
- Lickley, R. (2015). Fluency and disfluency. In M. A. Redford (Ed.), The handbook of speech production (pp. 445–474). John Wiley & Sons, Inc.
- McDonald, S., Togher, L., & Code, C. (2014). The nature of cognitive deficits and psychosocial function following TBI. In S. McDonald, L. Togher, & C. Code (Eds.), Social and communication disorders following traumatic brain injury (pp. 48–88). Psychology Press.
- McDougall, K., & Duckworth, M. (2017). Profiling fluency: An analysis of individual variation in disfluencies in adult males. Speech Communication, 95, 16–27. https://doi.org/https://doi.org/10.1016/j.specom.2017.10.001
- Moore, K., & Korpijaakko-Huuhka, A.-M. (1996). The clinical assessment of Finnish fluency. In M. Ball & M. Duckworth (Eds.), Advances in clinical phonetics. Studies in speech pathology & clinical linguistics, 6 (pp. 171–196). John Benjamins.
- Myers, F., Bakker, K., St. Louis, K., & Raphael, L. (2012). Disfluencies in cluttered speech. Journal of Fluency Disorders, 37(1), 9–19. https://doi.org/https://doi.org/10.1016/j.jfludis.2011.10.001
- Myers, F., St. Louis, K., & Faragasso, K. (2008). Disfluency clusters associated with cluttering. Bulgarian Journal of Communication Disorders, 2, 10–19.
- Peltonen, P. (2020). Individual and interactional speech fluency in L2 English from a problem-solving perspective: A mixed-methods approach [Academic dissertation]. University of Turku.
- Peltonen, P., & Lintunen, P. (2016). Integrating quantitative and qualitative approaches in L2 fluency analysis: A study of Finnish-speaking and Swedish-speaking learners of English at two school levels. Journal of Applied Linguistics, 4(2), 209–238. https://doi.org/https://doi.org/10.1515/eujal-2014-0018
- Penttilä, N. (2019). Miten puhe sujuu? Tyypillisen ja poikkeavan puheen sujuvuuden piirteitä [How does speech flow? Fluency features in typical and disordered speech]. Tampere University.
- Penttilä, N., & Korpijaakko-Huuhka, A.-M. (2019). Disfluencies in typical Finnish-speaking adults. The Phonetician Journal of the International Society of Phonetic Sciences, 27(116), 28–41. http://isphs.org/Phonetician/ThePhonetician116.pdf
- Penttilä, N., Korpijaakko-Huuhka, A.-M., & Kent, R. (2018). Tavallista sujumattomuutta: Aikuisten puheen sujuvuuden kvantitatiivinen analyysi [Typical fluency in Finnish adults]. Puhe Ja Kieli, 38(3), 153–173. https://doi.org/https://doi.org/10.23997/pk.77384
- Penttilä, N., Korpijaakko-Huuhka, A.-M., & Kent, R. (2019). Disfluency clusters in speakers with and without neurogenic stuttering following traumatic brain injury. Journal of Fluency Disorders, 59, 33–51. https://doi.org/https://doi.org/10.1016/j.jfludis.2019.01.001
- Postma, A. (2000). Detection of errors during speech production: A review of speech monitoring models. Cognition, 77(2), 97–131. https://doi.org/https://doi.org/10.1016/S0010-0277(00)00090-1
- Prins, R., & Bastiaanse, R. (2004). Analyzing the spontaneous speech of aphasic speakers. Aphasiology, 18(12), 1075–1091. https://doi.org/https://doi.org/10.1080/02687030444000534
- Raukola-Lindblom, M., Vuorinen, E., & Vartiainen, R. (2020). Recovering social participation – Experience with a relational group intervention for traumatic brain injury patients. NeuroRehabilitation, 47(1), 55–64. https://doi.org/https://doi.org/10.3233/NRE-203083
- Robb, M., Sargent, A., & O’Beirne, G. (2009). Characteristics of disfluency clusters in adults who stutter. Logopedics Phoniatrics Vocology, 34(1), 1401–5439. https://doi.org/https://doi.org/10.1080/14015430902748519
- Roberts, P. M., Meltzer, A., & Wilding, J. (2009). Disfluencies in non-stuttering adults across sample lengths and topics. Journal of Communication Disorders, 42(6), 414–427. https://doi.org/https://doi.org/10.1016/j.jcomdis.2009.06.001
- Rossi, N., Sampaio, A., Goncalves, O., & Giacheti, C. (2011). Analysis of speech fluency in Williams syndrome. Research in Developmental Disabilities, 32(6), 2957–2962. https://doi.org/https://doi.org/10.1016/j.ridd.2011.05.006
- Sawyer, J., & Yairi, E. (2010). Characteristics of disfluency clusters over time in preschool children who stutter. Journal of Speech Language and Hearing Research, 53(5), 1191–1205. https://doi.org/https://doi.org/10.1044/1092-4388(2010/09-0067)
- Segalowitz, N. (2010). Cognitive bases of second language fluency. Routledge.
- Shriberg, E. (1994). Preliminaries to a theory of speech disfluencies. Academic dissertation. University of California.
- Shriberg, E. (1999). Phonetic consequences of speech disfluency [Paper presentation]. The international congress of phonetic sciences. San Francisco, CA, USA.
- Shriberg, E. (2005). Spontaneous speech: How people really talk and why engineers should care. Proceedings of interspeech (pp. 1781–1784).
- Tetnowski, J. A., & Scott, K. S. (2010). Fluency and fluency disorders. In J. S. Damico, N. Müller, & M. J. Ball (Eds.), The handbook of language and speech disorders (pp. 431–454). Wiley-Blackwell.
- Wiklund, M., & Laakso, M. (2019). Ungrammatical utterances and disfluent speech as causes of comprehension problems in interactions of preadolescents with high function autism. Clinical Linguistics & Phonetics, 33(7), 654–676. https://doi.org/https://doi.org/10.1080/02699206.2019.1578415
- Yaruss, J. (1998). Real-time analysis of speech fluency: Procedures and reliability training. American Journal of Speech-language Pathology, 7(2), 25–37. https://doi.org/https://doi.org/10.1044/1058-0360.0702.25