
ABSTRACT
The present study aimed to examine the impact of COVID-19 social isolation upon aspects of emotional and social cognitive function. We predicted that greater impairments in emotional and social cognition would be observed in people who experienced more disruption to their usual social connectivity during COVID-19 social isolation. Healthy volunteers (N = 92) without prior mental health problems completed assessments online in their own homes during the most stringent period of the first COVID-19 “lockdown” in the UK (March – May 2020). Measures included two questionnaires probing levels of social isolation, anxiety levels, as well as five neuropsychological tasks assessing emotional and social cognition. Reduced positive bias in emotion recognition was related to reduced contact with friends, household size and communication method during social isolation. In addition, reduced positive bias for attention to emotional faces was related to frequency of contact with friends during social isolation. Greater cooperative behaviour in an ultimatum game was associated with more frequent contact with both friends and family during social isolation. The present study provides important insights into the detrimental effects of subjective and objective social isolation upon affective cognitive processes.
In January 2020 the World Health Organization (WHO) recognised the widespread transmission of SARS-CoV2 causing coronavirus disease 2019 (COVID-19), as a global pandemic. As a measure to contain the spread of infection, governments around the world introduced measures including social distancing, societal lockdown and, for some people, complete social isolation. However, these social distancing measures for combating the viral outbreak may also have unintended consequences on mental health (Vatansever et al., Citation2020). A recent survey revealed that widespread concerns about the effect of social isolation on wellbeing, including increased anxiety, depression, stress, and other negative feelings, were ranked higher than the prospect of becoming physically unwell with COVID-19 itself (Holmes et al., Citation2020).
Loneliness is one of the core indicators of wellbeing and is a robust predictor of depression, anxiety and suicidal ideation (Beutel et al., Citation2017). Loneliness may emerge from both perceived social isolation, manifested by feelings of disconnection and/or objective isolation such as living alone and lack of contact with others (Yanguas et al., Citation2018). For people living with mental health problems, loneliness is often manifested by reduced social networks, problems with interpersonal relationships, unemployment and lack of community integration, which contribute to impaired quality of life. These key functional outcomes are robustly linked to social cognitive ability; the mental operations needed to perceive, interpret and process information for adaptive social interactions (Green et al., Citation2019). A fundamental question remains as to whether these impairments are inherent vulnerability markers of mental health problems, whereby people with impaired social cognitive skills have difficulty with forming normal social support networks, or whether they are a secondary consequence of prolonged periods of isolation and poor social connections resulting from symptoms (Bland et al., Citation2020). COVID-19 social isolation presents an unprecedented opportunity to experimentally examine the effects of social isolation on markers of emotional and social cognition in individuals without prior mental health disorders to investigate whether social isolation impacts social cognitive functioning. This has critical implications for our understanding of impairments in emotional and social cognition in people with mental health problems.
Disrupted affective cognition is a core feature of many mental health disorders (Bland et al., Citation2016). The most widely investigated assessment of social cognitive function is the recognition of emotional facial expressions, with the interpretation of ambiguous faces as negative, linked to depression and anxiety (Surguladze et al., Citation2004). Indeed, there is mounting evidence that this social cognitive function is a sensitive marker for therapeutic interventions such as antidepressant drugs (Harmer et al., Citation2010). In addition, evidence suggests that greater loneliness and social dysconnectivity is associated with less prosocial behaviour (Huang et al., Citation2016). In the present study we aimed to ascertain whether individual experiences of social connection due to government enforced COVID-19 Social Isolation (CSI) negatively impacts aspects of emotional and social cognitive function. We hypothesised that people who experienced greater social connectivity disruption during COVID-19 lockdown would display greater disruption to emotional and social processes. Specifically, we hypothesised that greater social disruption would lead to greater negative biases in emotional face recognition and emotional attention bias as well as reduced prosocial behaviour.
Materials and methods
Participants
We initially recruited 107 healthy volunteers via Prolific Academic. Inclusion criteria were: at least 18 years old, no self-reported previous or current psychiatric disorders, no current use of psychoactive medication, and fluent in English. The research ethics committee at Manchester Metropolitan University approved this study (ref: 22384). All procedures complied with the ethical standards of the relevant national and institutional committees on human experimentation and with the Helsinki Declaration of 1975, as revised in 2008.
Fifty-five participants were either working from home (n = 51), students currently studying (n = 4), no longer working including furloughed (n = 35), homemaker (n = 1) or on maternity leave (n = 1). Fifteen participants were still travelling to work and were excluded from further analyses, given they were not confined to their homes during the CSI period. The remaining 92 participants were aged between 19–64 years with a mean age of 32.32 years (s.d. = 10.62). The sample comprised 42 male and 50 female participants, with a mean of 14.83 years of education.
Procedure
Data collection took place during the most stringent period of UK government enforced CSI (21st April – 10th May). Participants completed two questionnaires; a newly developed COVID-19 related social isolation questionnaire, the State-Trait Anxiety questionnaire (Spielberger et al., Citation1970); and five online tasks probing emotional and social cognition, administered via PsychoPy (Peirce, Citation2007). All participants completed the tasks on a laptop or desktop computer in their own homes and were allowed up to 2 h to complete the study. Participants were reimbursed for their time at £5 per hour.
Measures
COVID-19 social isolation questionnaire
Participants first completed a COVID-19 social isolation questionnaire, which probed level of social isolation. Specifically, participants were asked to report how many other people they currently lived with, how often they had contact with friends and family at present (both face-to-face and virtual), and also prior to COVID-19, rating on 8-point scale: hourly/a few times a day/daily/every few days/weekly/fortnightly/monthly/other, please specify (scored as 1 = least contact and 8 = most contact). In order to ascertain whether COVID-19 had impacted on the frequency of contact with friends and family, a difference score “contact frequency change” was calculated. Participants were also asked how disconnected they felt from family and friends rating on a 100-point scale from “not at all” to “extremely”. Finally, participants were also asked about the communication methods they used at present, as well as before COVID-19: text based, phone call, video call, face to face.
Tasks
The neuropsychological tasks were taken from the EMOTICOM neuropsychological test battery (full task descriptions can be found in Bland et al. (Citation2016)). These tasks were previously administered in a testing room at a university site, however due to the nature of COVID-19 social isolation, these tasks were adapted for online use where participants were sent a web link to the questionnaires and task.
Emotional recognition task (ERT)
We utilised two versions of the ERT; one with face stimuli and one with eyes stimuli only. There are ten different images for each of the four emotions (happy, sad, anger and fear), each showing different levels of intensity. Participants must decide which is the appropriate emotion. Accuracy for each emotional intensity was combined to form an average accuracy score for each emotion and converted to a proportion (0-1). Emotion recognition affective bias scores were calculated by subtracting accuracy scores for sad faces from accuracy scores for happy faces (emotion recognition affective bias = happy accuracy–sad accuracy) so that the higher the score, the greater the positive bias.
Affective go no-go task (AGN)
We utilised two versions of the AGN; one with face stimuli and one with word stimuli. The test consists of several blocks, each of which presents a series of faces or words from three different affective categories: positive, negative, and neutral. Participants are given a target emotion and asked to press a button only when the target emotion (e.g. happy) is present and to ignore the distracting emotion (e.g. sad). Criterion scores were calculated to assess response bias which reflect the minimum level of internal certainty needed to decide that a particular stimulus is present, whereby high criterion scores represent more conservative behaviour with greater uncertainty that a target is present. Alternatively, lower scores represent more liberal responding bias to a target. Criterion was calculated as: c = −0.5*(z(Hit)+z(False Alarm)). Emotional attention affective bias scores were calculated by subtracting criterion scores of happy target stimuli from criterion scores of sad target stimuli (emotional attention affective bias = sad criterion–happy criterion) so that the higher the score, the greater the positive bias.
Ultimatum game (UG)
The Ultimatum Game assesses cooperative behaviour; fairness sensitivity and punishment tendency by choosing to accept or reject monetary offers made by a computerised avatar opponent. Participants first worked together to build a put of money. Next, participants are informed whether they get to decide how the money is split or whether it is up to the opponent. If the opponent divides the money, the participant gets the choice to either accept or reject their offer. These offers have seven levels where the opponent gets 50%, 60%, 65%, 70%, 75%, 80% or 90% of the joint winnings. If the participant accepts, they each get the allotted amount, and if they reject, they both get nothing. When the participant divides, they can choose from four divisions where the opponent receives 20%, 30%, 40% or 50% of the joint winnings. The proportion of offers accepted was calculated as the number of trials that participants chose to accept the offer from their opponent from the total number of trials. Offer sensitivity was calculated in the middle of the range, using the formula: Offer sensitivity = [2*(% accepted at 60) + 1*(% accepted at 65)−0*(% accepted at 70)−1*(% accepted at 75)−2*(% accepted at 80)]/overall % accepted]. The total value of offers made by the participant was calculated by averaging the percentage proposed to the avatar opponent when participants acted as the proposer (proposer offer value).
Statistical analysis
All statistical analyses were conducted in SPSS 24.0. Two-step hierarchical regression analyses were conducted for each task to investigate whether aspects of CSI predicted scores in aspects of emotional and social cognition. In each hierarchical regression, age was entered into step 1 in order to examine whether age contributed significantly to differences in emotional and social cognition scores, given that age was negatively correlated with frequency of contact with friends (r = −0.242, p = 0.02) and family (r = −0.411, p < 0.001). Anxiety levels however, as measured by the STAI, were not related to social connectivity (all p > 0.10) and the inclusion of anxiety into the regression models did not influence the results and was therefore not included in the model. The three predictor variables were then entered into step 2: (a) frequency of contact during CSI, (b) contact frequency change from pre COVID-19 levels and (c) feelings of being disconnected. Regression analyses were conducted separately for friends and family social connectivity. Multicollinearity was examined using tolerance and VIF statistics and found to be acceptable in all cases. Highest VIF values were 1.5, and lowest tolerance values were 0.65. Univariate analyses, covarying for age, were conducted to investigate the effects of methods of communication and household size upon social cognition. The statistical significance level was set to p < 0.05 (two-tailed). Given the uncertainty of the first COVID-19 lockdown, a-priori power analyses was not feasible and data collection data was terminated when government restrictions first eased (11th May 2020). A post-hoc power analysis suggested that with 92 participants we had at least 80% power to detect effect size of R2 = 0.28 at p = 0.05 (two-tailed).
Bayesian analyses were also performed using JASP (JASP Team (2020), version 0.14.1) in order to provide Bayes Factors, i.e. a ratio of the likelihood of the null hypothesis to the likelihood of the experimental hypothesis. This allows additional evidence beyond hierarchical regression, to demonstrate support for a null hypothesis when considering the possibility of subtle effects. On the basis of Jeffreys (Citation1961) we considered Bayes Factors (BF10) < 0.01 to be extreme evidence for the null hypothesis, 0.01–0.033 to be very strong evidence for the null, 0.033–0.1 to be strong evidence for the null, 0.1–0.33 to be moderate evidence for the null, and 0.33–1 to be not worth more than a bare mention. Alternatively, we considered BF10 > 100 to be extreme evidence for the experimental hypothesis, 100–130 to be very strong evidence for the experimental hypothesis, 30–10 to be strong evidence for the experimental hypothesis, 10–3 to be moderate evidence for the experimental hypothesis, and 3–1 to be not worth more than a bare mention.
Results
Model 1: emotion recognition affective bias
Decreased frequency of contact with friends during CSI, compared to pre-CSI levels, significantly predicted emotion recognition affective bias scores, which was driven by greater accuracy in recognising sad facial expressions. Hierarchical regression analyses revealed that the when age was entered into step 1, the model was significant [F(1, 85) = 6.45, p = 0.013, R2 = 0.07] and age significantly predicted emotional recognition affective bias scores (β = 0.27, t = 2.54, p = 0.01). When the three social connectivity predictor variables were added into step 2, the model remained significant [F(3,85) = 3.94, p = 0.006, R2 = 0.16] but age no longer significantly predicted scores (β = 0.13, t = 1.18, p = 0.24, BF10 = 1.89). Indeed, the Bayesian analysis showed that a model comprising the three predictors produced a higher Bayes Factor (BF10 = 7.61) compared to a model including the three predictors plus age (BF10 = 4.89). Reduced contact with friends significantly predicted more negative affective bias scores (β = 0.25, t = 2.09, p = 0.03, BF10 = 2.03). This appeared to be driven by increased accuracy in the recognition of sad faces; when entering happy and sad recognition into separate regression models, decreased contact frequency remained predictive of sad (β = −0.26, t = −2.61, p = 0.03, BF10 = 2.18) but not happy recognition performance (β = 0.10, t = 0.80, p = 0.42, BF10 = 0.29). In addition, affective bias scores were significantly predicted by feelings of being disconnected during CSI (β = 0.31, t = 2.81, p = 0.04, BF10 = 2.77) which again was driven by increased accuracy in the recognition of sad (β = −0.31, t = −2.81, p = 0.006, BF10 = 5.83) compared to happy faces (β = 0.01, t = 0.78, p = 0.93, BF10 = 0.26). Finally, present contact with friends did not significantly predict emotion recognition affective bias scores, although Bayesian analysis failed to provide strong evidence this null finding (β = 0.09, t = 0.09, p = 0.44, BF10 = 1.88) suggesting it is not possible to completely discount the possibility that there may be subtle effects of present contact with friends.
By contrast, connectivity with family was not predictive of emotion recognition affective bias scores [F(3,85) = 2.21, p = 0.085] nor any of the predictor variables (all p > 0.28). Bayesian analysis indicated anecdotal support for the null hypothesis that social connectivity with family was not predictive of emotional recognition bias scores (all BF10 0.36–0.40).
Similar regression models were constructed to predict bias on the eyes emotion recognition tasks, but neither of the models were significant (ps > 0.39) nor any of the friends or family predictor variables (ps > 0.40). Bayesian analysis, however, revealed that there was evidence just past the Bayes Factor threshold of 0.33 to indicate there was potentially a very subtle effect of present contact with friends (BF10 = 0.38) and family (BF10 = 0.35) influencing emotional attention bias scores.
Model 2: affective attention bias (AGN)
Decreased frequency of contact with friends during CSI significantly predicted emotion attentional bias scores, which was driven by a higher criterion score for sad faces, i.e. more liberal responding, to sad faces. Similar to the above analyses, performance on the faces AGN was used in nested regression analyses as the dependent variable. Hierarchical regression analyses revealed that the when age was entered into step 1, the model was not significant [F(1,85) = 0.32, p = 0.57, R2 = 0.004] and age did not significantly predict emotional attention affective bias scores (β = 0.06, t = 0.57, p = 0.57). When the three social connectivity predictor variables were added into step 2, the model was significant [F(3,85) = 2.76, p = 0.03, R2 = 0.12]. Less frequent contact with friends during CSI significantly predicted lower positive bias scores (β = 0.30, t = 2.47, p = 0.01, BF10 = 3.37). This appeared to be driven more by liberal responding to sad faces; when entering happy and sad criterion scores into separate regression models, less frequent contact with friends remained predictive of decreased sad criterion scores (β = 0.25, t = 1.97, p = 0.04, BF10 = 1.93), but not happy criterion scores (β = 0.25, t = 1.97, p = 0.053, BF10 = 0.15). Indeed, bayesian analysis indicated that the model with the highest Bayes Factor included only present contact with friends (BF10 = 7.47). Feelings of being disconnected with friends and contact frequency change was not predictive of emotional attention affective bias scores (ps > 0.27). Bayesian analysis, was also in favour of the null hypothesis that feelings of being disconnected (BF10 = 0.55) and contact frequency change with friends (BF10 = 0.45) did not influence emotional attention bias scores.
By contrast, connectivity with family was not predictive of emotional attention affective bias scores [F(3,85) = 0.20, p = 0.94] nor any of the predictor variables (all p > 0.51). Bayesian analysis indicated moderate support for the null hypothesis that social connectivity with family was not predictive of emotional attention bias scores (all BF10 0.11–0.12).
Similar regression models were constructed to predict bias on the words affective go no task, but neither of the models were significant (p > 0.80) nor any of the friends or family predictor variables (p > 0.24). Bayesian analysis further suggested moderate support for this null finding for both social connectivity with friends (all BF10 0.17–0.27) and family (all BF10 0.12–0.17).
Model 3: cooperative behaviour (UG)
We found that contact with friends and family during CSI predicted the value of offers proposed. Specifically, hierarchical regression analyses revealed that the when age was entered into step 1, the model was not significant [F(3,85) = 2.37, p = 0.13, R2 = 0.02] and age did not significantly predict emotional recognition affective bias scores (β = 0.17, t = 1.55, p = 0.13). When the three social connectivity predictor variables were added into step 2, the model was significant [F(3,85) = 2.58, p = 0.04, R2 = 0.12]. Whilst age remined non-significant (β = 0.07, t = 0.58, p = 0.57), present contact frequency with friends significantly predicted proposer offer value (β = 0.29, t = 2.28, p = 0.025, BF10 = 2.03) but difference in frequency of contact and feelings of being disconnected from family did not (ps > 0.10). Bayesian analysis, was also in favour of the null hypothesis that feelings of being disconnected (BF10 = 0.44) and contact frequency change with friends (BF10 = 0.55) did not influence emotional attention bias scores.
Social contact with family also significantly predicted proposer offer value. When the three social connectivity predictor variables were added into step 2, the model was significant [F(3,85) = 5.02, p = 0.001, R2 = 0.20] and age became a significant predictor of proposer value (β = 0.28, t = 2.48, p = 0.02) suggesting the older the participants, the higher the offer. Higher offers were also predicted by greater contact frequency with family (β = 0.45, t = 3.64, p < 0.001, BF10 = 31.28). There was a trend towards offers being significantly predicted by feelings of being disconnected during CSI (β = 0.21, t = 1.89, p = 0.063, BF10 = 3.50) but difference in frequency of contact was not significant (β = 0.04, t = 0.33, p = 0.063, BF10 = 1.02). Bayesian analysis indicated that the model with the highest Bayes Factor (BF10 = 64.42) included age, present contact with family and feelings of being disconnected with family.
Methods of communication
Given that emotion recognition bias, emotional attention bias to faces and cooperative behaviour were predicted by social connectivity, we further analysed whether this was influenced by the type of communication participants usually used to stay socially connected; asynchronous (text communication, n = 50) or synchronous (voice/video calling, n = 42). Univariate analyses, covarying for age, revealed that communication type did not affect emotional attention bias scores. However, it did significantly impact emotion recognition affective bias [F(1,87) = 3.96, p = 0.035, ηp2 = 0.09] and cooperative behaviour [F(1,87) = 4.30, p = 0.017, ηp2 = 0.10]. Specifically, people who mostly communicated by voice and video call during CSI had more positive affective bias in emotion recognition, and greater value of offers proposed, compared to those who mostly used asynchronous text-based communication. The difference in affective bias appeared to be driven by lower sad and greater happy recognition accuracy for predominantly synchronous communicators [F(1,38) = 5.89, p = 0.02, ηp2 = 0.13)], while there was no difference for predominantly asynchronous communicators [F(1,43) = 0.90, p = 0.35, ηp2 = 0.02)]. Importantly, method of communication was not significantly related to frequency of contact with friends either before CSI [F(1,89) = 0.17, p = 0.67, ηp2 = 0.00)] or during CSI [F(1,89) = 0.58, p = 0.56, ηp2 = 0.01)] suggesting that differences in communication method were not merely reflecting frequency of contact ().
Figure 1. Scatter plot to show accuracy in the Emotion Recognition Task (ERT) for happy and sad faces in relation to change in contact with friends during COVID-19.
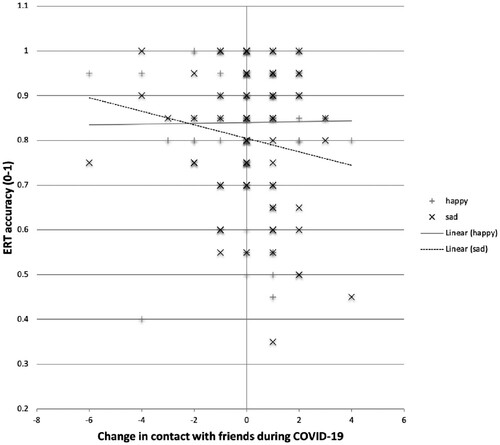
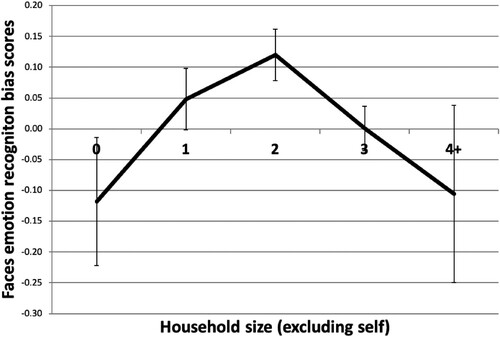
Figure 2. Line graph showing faces emotion recognition bias scores across household size. Error bars indicate standard error of the mean.
Household size
Univariate analysis, controlling for age, revealed household size significantly affected faces emotion recognition bias [F(4,77) = 2.51, p = 0.037, ηp2 = 0.14]. illustrates that living with two other people showed the most positive bias, whereas living alone or with more than 4 other people showed a negative affective bias. Neither emotional attentio bias nor cooperative behaviour were significantly associated with household size (both p > 0.40).
Discussion
This study examined the association between aspects of emotion and social cognition and measures of social connectivity, both prior to and during CSI. We found that reduced positive bias in emotion recognition was associated with reduced contact with friends, household size and communication method during CSI. In addition, decreased positive biases in emotional attention was related to reduced frequency of contact with friends during CSI, which appeared specific to the faces version, as we did not identify any significant associations with attentional bias towards emotional words. Finally, we found that cooperative behaviour in the ultimatum game was significantly modulated by frequency of contact with both friends and family during CSI. Together, these results suggest that reduced contact with an individual’s social support network disrupts markers of emotional and social cognition.
Social disconnection
Positive affective biases are typically displayed by healthy control participants and represent a participant’s greater accuracy in identifying happiness relative to sadness. Reduced positive biases or negative affective biases, i.e. the tendency to be less accurate in recognising happiness and more accurate in recognising sadness have been observed in depression (Harmer et al., Citation2010). Our results show that reduced contact with friends during CSI was significantly associated with lower positive bias scores in emotional recognition. This appeared to be driven by more accurate recognition of sad faces. This is line with previous studies suggesting that loneliness is linked to heightened perception of negative facial cues of emotion (Vanhalst et al., Citation2017). Importantly, affective bias scores were related to changes in levels of contact with friends, suggesting that people who were used to seeing their friends more prior to CSI, had lower positive biases compared to those who were used to seeing friends less frequently. Nevertheless, level of contact with friends during CSI was not predictive of emotion recognition affective bias scores suggesting that perceived level of isolation (i.e. previous baseline of usual contact) and feeling disconnected, are better predictors of affective bias in emotion recognition compared to objective measures of isolation. Indeed, perception of isolation can be entirely unrelated to the time spent with others, whereby the former is strongly linked with symptoms of anxiety and depression (Santini et al., Citation2020).
By contrast we found that present contact with friends during CSI was predictive of emotional attention bias scores in the faces version of the go/no-go task. We observed that individuals who had less contact with friends during CSI exhibited more negative criterion biases, which was driven by more liberal responding to sad faces. In contrast to the pattern for emotional recognition, contact frequency changes relative to pre-CSI was not predictive of affective attentional bias scores. This may suggest that objective isolation, as opposed to subjective isolation is a better predictor of emotional attention processes. Surprisingly, this effect was exclusively observed for faces and not words. This may indicate differences in test sensitivity as previously observed in studies comparing emotional face and word attentional bias (Pishyar et al., Citation2004), or could potentially reflect that reduced face-to-face contact during COVID-19 lockdown affects the processing of faces but not words. Future studies should explore the relationship between face- and text-based contact and attentional biases towards emotional faces and words.
Cooperative behaviour was also predicted by contact with friends, and particularly, contact with family during CSI. We found that individuals who had greater contact with both friends and family during CSI exhibited more cooperative behaviour. Previous studies suggest that attachment styles with parents can actually predict proposers’ cooperative behaviour in the Ultimatum Game (Almakias & Weiss, Citation2012) and that greater loneliness and social dysconnectivity is associated with less prosocial behaviour (Huang et al., Citation2016). In contrast to emotion recognition affective bias and similarly to emotional attention affective bias, we did not find that cooperative behaviour was predicted by contact frequency changes with family and friends prior to CSI suggesting that pro-social behaviour is reflective of present social connectivity irrespective of CSI enforced changes to usual levels of contact.
Methods of communication
We further found that emotion recognition affective bias scores were related to the method that individuals mostly used to communicate. People who mostly communicated during CSI by synchronous methods such as voice or video call, showed greater positive bias in emotion recognition compared to those who mostly used text-based communication. This is supported by previous research suggesting detrimental effects to wellbeing with high engagement of text-based, rather than call-based interaction, therefore, potentially sacrificing opportunities for multi-layered social interactions (Panova & Lleras, Citation2016). Importantly, we observed no significant relationship between communication method and frequency of contact. This suggests that the quality of interactions is potentially more pertinent for wellbeing than frequency of contact.
Household size
Emotion recognition affective bias scores were also significantly affected by household size, whereby participants living with two other people showed the most positive bias, whereas living alone or with more than four other people was associated with a negative affective bias. This finding is in line with previous research suggesting that living alone is detrimental for mental health (Stahl et al., Citation2017). It may also be the case that isolating with a large family or house sharing with several tenants causes greater disruption to markers of social cognitive function. Future research is needed to investigate the household dynamics and the effect upon social cognition and, importantly, mental health consequences.
Limitations
There are several limitations to the present study. First, our sample size may have not been sufficient to detect more subtle effects. Particularly, when exploring participants’ communication methods and household sizes, the sample sizes were small when broken down into sub-groups. Future research should examine household configuration and dynamics to shed light onto the factors that contribute to differing affective bias scores. Similarly, more work is needed to investigate the valence of social interactions, which are likely to play an important role in understanding COVID-19 social connectivity. Whilst the present study aimed to examine the effects of COVID-19 social isolation on aspects of emotional and social cognition, future studies should investigate the impact of stress, depression and other factors of importance. Indeed, it is important to explore how COVID-specific isolation links with validated loneliness scales. In addition, the normative data collected prior to CSI was obtained in a lab environment and not administered online as is the case for the present study, making these datasets difficult to compare. Furthermore, the ultimatum game rewarded participants differently compared to the normative study, which again raises difficulties in making direct comparisons.
Conclusions
This study sheds light on the impact of reduced social contact on aspects of emotional and social cognition. Disruption to these social cognitive markers has been previously identified in mental health disorders and may reflect a key indicator of social wellbeing. Our results provide important insights into the detrimental effects of subjective and objective social isolation upon affective cognitive processes and suggest that the pathway to social cognitive deficits in mental health disorders may be mediated by reduced social connectivity. Nevertheless, it remains unclear whether the impact of social isolation is transient and returns to typical levels upon normal social connectivity resuming or whether the impact continues longer-term. This has critical implications for the treatment of disrupted social cognitive processes during lockdowns and also for the importance of return to schools, work and social community places and venues, such as parks and restaurants, for promoting social communication and mental health resilience.
Supplementary_Material
Download MS Word (27.6 KB)Acknowledgements
The authors would like to thank Dr Niki Ray, Professor Paul Holmes and colleagues at Manchester Metropolitan University for supporting this research.
Disclosure statement
BJS consults for Cambridge Cognition, Greenfield BioVentures and Cassava Sciences. She receives funding from the Wallitt Foundation and Eton College. Her research is conducted within the NIHR Brain Injury MedTech and in vitro diagnostics Cooperative (MIC, Cambridge) and the NIHR Cambridge Biomedical Research Centre (Mental Health and Neurodegeneration Themes). TWR provides consultancy for Cambridge Cognition, Lundbeck, Greenfield Bioventures, Cassava, Takeda and Unilever, and has research grants with Shionogi and GlaxoSmithKline.
Correction Statement
This article has been republished with minor changes. These changes do not impact the academic content of the article.
References
- Almakias, S., & Weiss, A. (2012). Ultimatum Game behavior in light of attachment theory. Journal of Economic Psychology, 33(3), 515–526. https://doi.org/https://doi.org/10.1016/j.joep.2011.12.012
- Beutel, M. E., Klein, E. M., Brähler, E., Reiner, I., Jünger, C., Michal, M., Wiltink, J., Wild, P. S., Münzel, T., Lackner, K. J., & Tibubos, A. N. (2017). Loneliness in the general population: Prevalence, determinants and relations to mental health. BMC Psychiatry, 17(1), 97. https://doi.org/https://doi.org/10.1186/s12888-017-1262-x
- Bland, A. R., Roiser, J. P., Mehta, M. A., Sahakian, B. J., Robbins, T. W., & Elliott, R. (2020). COVID-19 induced social isolation; implications for understanding social cognition in mental health. Psychological Medicine, 1–3. https://doi.org/https://doi.org/10.1017/S0033291720004006
- Bland, A. R., Roiser, J. P., Mehta, M. A., Schei, T. S., Boland, H., Campbell-Meiklejohn, D., Seara-Cardoso, A., Emsley, R., Munafo, M., Penton-Voak, I., Viding, E., Voon, V., Sahakian, B. J., Robbins, T. W., & Elliott, E. (2016). EMOTICOM: A neuropsychological test battery to evaluate emotional, motivational and social cognition. Frontiers in Behavioural Neuroscience. 10, 25. https://doi.org/https://doi.org/10.3389/fnbeh.2016.00025
- Green, M. F., Horan, W. P., & Lee, J. (2019). Nonsocial and social cognition in schizophrenia: Current evidence and future directions. World Psychiatry, 18(2), 146–161. https://doi.org/https://doi.org/10.1002/wps.20624
- Harmer, C. J., Cowen, P. J., & Goodwin, G. M. (2010). Efficacy markers in depression. Journal of Psychopharmacology, 25(9), 1148–1158. https://doi.org/https://doi.org/10.1177/0269881110367722
- Holmes, E. A., O'Connor, R. C., Perry, V. H., Tracey, I., Wessely, S., Arseneault, L., Ballard, C., Christensen, H., Silver, R. C., Everall, I., Ford, T., John, A., Kabir, T., King, K., Madan, I., Michie, S., Przybylski, A. K., Shafran, R., Sweeney, A., Worthman, C. M., Yardley, L., Cowan, K., Cope, C., Hotopf, M., & Bullmore, E. (2020). Multidisciplinary research priorities for the COVID-19 pandemic: A call for action for mental health science. The Lancet Psychiatry, 7(6), 547–560.
- Huang, H., Liu, Y., & Liu, X. (2016). Does loneliness necessarily lead to a decrease in prosocial behavior? The roles of gender and situation. Frontiers in Psychology, 7, 1388. https://doi.org/https://doi.org/10.3389/fpsyg.2016.01388
- Jeffreys, H. (1961). Theory of probability (3rd ed.). Oxford University Press, Clarendon Press.
- Panova, T., & Lleras, A. (2016). Avoidance or boredom: Negative mental health outcomes associated with use of information and communication technologies depend on users’ motivations. Computers in Human Behavior, 58, 249–258. https://doi.org/https://doi.org/10.1016/j.chb.2015.12.062
- Peirce, J. W. (2007). Psychopy: Psychophysics software in python. Journal of Neuroscience Methods, 162(1–2), 8–13. https://doi.org/https://doi.org/10.1016/j.jneumeth.2006.11.017
- Pishyar, R., Harris, L. M., & Menzies, R. G. (2004). Attentional bias for words and faces in social anxiety. Anxiety, Stress, & Coping, 17(1), 23–36. https://doi.org/https://doi.org/10.1080/10615800310001601458
- Santini, Z. I., Jose, P. E., York Cornwell, E., Koyanagi, A., Nielsen, L., Hinrichsen, C., Meilstrup, C., Madsen, K. R., & Koushede, V. (2020). Social disconnectedness, perceived isolation, and symptoms of depression and anxiety among older Americans (NSHAP): a longitudinal mediation analysis. The Lancet Public Health, 5(1), Article e62–e70. https://doi.org/https://doi.org/10.1016/S2468-2667(19)30230-0
- Spielberger, C. D., Gorsuch, R. L., & Lushene, R. E. (1970). Manual for the state-trait anxiety inventory. Consulting Psychologists Press.
- Stahl, S. T., Beach, S. R., Musa, D., & Schulz, R. (2017). Living alone and depression: The modifying role of the perceived neighborhood environment. Aging & Mental Health, 21(10), 1065–1071. https://doi.org/https://doi.org/10.1080/13607863.2016.1191060
- Surguladze, S. A., Young, A. W., Senior, C., Brébion, G., Travis, M. J., & Phillips, M. L. (2004). Recognition accuracy and response bias to happy and sad facial expressions in patients with major depression. Neuropsychology, 18(2), 212–218. https://doi.org/https://doi.org/10.1037/0894-4105.18.2.212
- Vanhalst, J., Gibb, B. E., & Prinstein, M. J. (2017). Lonely adolescents exhibit heightened sensitivity for facial cues of emotion. Cognition and Emotion, 31(2), 377–383. https://doi.org/https://doi.org/10.1080/02699931.2015.1092420
- Vatansever, D., Wang, S., & Sahakian, B. J. (2020). Covid-19 and promising solutions to combat symptoms of stress, anxiety and depression. Neuropsychopharmacology, 46(1), 217–218. https://doi.org/https://doi.org/10.1038/s41386-020-00791-9
- Yanguas, J., Pinazo-Henandis, S., & Tarazona-Santabalbina, F. J. (2018). The complexity of loneliness. Acta Bio-Medica : Atenei Parmensis, 89(2), 302–314. https://doi.org/https://doi.org/10.23750/abm.v89i2.7404