
ABSTRACT
Online platforms like Instagram cover potentially distressing imagery with a sensitive-content screen (blurred imagery plus a content warning). Previous research suggests people typically choose to “uncover” and view screened content. In three studies, we investigated whether the presence of screens mitigates the negative emotional impact of viewing content. In Study 1, participants viewed positive and neutral images, and screens (with an option to view the negative images beneath) for a 5-minute period. In Study 2, half the participants saw a grey mask in place of the typical sensitive-content screen. In addition, each image appeared for a fixed period (5 s) and participants had no option to uncover it. Study 3 was like Study 2 except half the participants saw negative images preceded by a sensitive-content screen and half saw negative images without screens. Overall, participants reported a significant increase in state anxiety and negative affect from pre-to post task when they were exposed to sensitive-content screens, whether or not they were also exposed to the negative imagery beneath. Our data suggest sensitive-content screens cause negative responses – state anxiety and negative affect – that do not translate to an emotional benefit when people view negative content.
Despite their popularity and positive influences (e.g. enhancing social relationships; Kross et al., Citation2013), online platforms sometimes expose people to distressing content (e.g. McHugh et al., Citation2018). To mitigate the impact of exposure, several platforms (e.g. Instagram, Facebook) use sensitive-content screens, a form of trigger warning (Bridgland, Jones, et al., Citation2023), to alert users to graphic content. These screens provide an option to uncover or leave content covered. This process appears based – in part – on the idea that warnings help people avoid potentially distressing content (e.g. Boysen et al., Citation2021), or reduce negative reactions towards content (George & Hovey, Citation2020). Yet, until our first investigation, there was no empirical evidence to support or refute these claims. We asked Instagram users what they would do when encountering a screened image: ∼80% of participants said they would uncover it (Bridgland, Bellet, et al., Citation2023). Indeed, a similar proportion (∼85%) uncovered the first screened image when interacting with a mock Instagram feed, while 52.7% of participants uncovered every image (Simister, Bridgland, & Takarangi, Citation2023). These findings suggest that many people still view potentially distressing content. But we do not know whether sensitive-content screens mitigate the negative emotional impact of viewing this content. Thus, here, we compared people’s change in anxiety and negative affect when exposed to: screened negative content with an option to uncover the content (Study 1), sensitive-content screens alone vs. grey mask screens (Study 2), and negative content with vs. without sensitive-content screens (Study 3).
Previous research demonstrates that people, including those with psychopathological symptoms, engage with screened content over multiple opportunities (Bridgland, Bellet, et al., Citation2023; Simister, Bridgland, & Takarangi, Citation2023). Thus, it is critical to consider whether this uncovering behaviour (i.e. deliberately viewing potentially distressing content) is detrimental. On the one hand, perhaps uncovering behaviour is like therapeutic exposure to distressing stimuli. However, exposure therapy – an efficacious treatment for anxiety conditions (e.g. PTSD, phobia; Abramowitz et al., Citation2019) – requires prolonged and sustained exposure to stimuli, and therapeutic guidance, neither of which characterise exposure to potentially distressing social media content.
On the other hand, perhaps uncovering behaviour is similar to indirect trauma exposure. We know people sometimes experience PTSD-like symptoms after indirect trauma exposure (i.e. “secondary traumatization”; Figley, Citation1995); examples include mental-health workers (Hensel et al., Citation2015) and first responders (e.g. Carleton et al., Citation2018). Indeed, the DSM-5 acknowledges indirect trauma exposure via witnessing an event(s), learning that an event(s) occurred to a close family member/friend, or via “repeated or extreme exposure to aversive details” of an event(s), as a precursor to PTSD (APA, Citation2013). However, these criteria only include indirect exposure that is work-related or involves witnessing others’ trauma in person. Although the probability of developing PTSD from indirect exposure appears lower than for direct (May & Wisco, Citation2016), indirect exposure (e.g. via media coverage of natural disasters) can lead to traumatic stress symptoms (e.g. distressing intrusive thoughts; Bridgland et al., Citation2021). Furthermore, cumulative exposure to trauma, whether direct (e.g. repeated event; e.g. Harvey et al., Citation2016) or indirect (e.g. duration of exposure to graphic media; e.g. Holman et al., Citation2020), has more impact on symptoms than a single exposure. We note that, unlike other indirect exposure, social media exposure may not necessarily be sustained. Yet, given that social media algorithms feed users content based on previous engagement, exposure could beget further exposure. Indeed, short individual exposures may have greater impact at scale (Funder & Ozer, Citation2019).
Therefore, we expected uncovering behaviour on social media would have a cumulative negative impact. To test our predictions, in Study 1 we used a simulated Instagram task: participants viewed negative, neutral, and positive images, for 5 minutes. Negative images were covered with a sensitive-content screen that participants could choose to uncover or not. Participants clicked through images at their own pace. We operationalised negative impact as participants’ state anxiety and negative affect pre-to-post task. We operationalised uncovering behaviour as uncovering all screens versus not, and as time spent viewing negative images. We predicted that participants with higher uncovering behaviour would show worse outcomes (i.e. greater increases in anxiety and negative affect) from pre-to-post task.
Transparency and openness
The Flinders University Human Research Ethics Committee approved this research. We have reported all measures, conditions, and data exclusions. The data reported in Study 1 were collected as part of a larger study (Simister, Bridgland, & Takarangi, Citation2023). Pre-registrations can be found at: https://osf.io/2fdr7 (Study 1); https://osf.io/p7tgk (Study 2); and https://osf.io/8d342 (Study 3). The data, including a variable codebook, and all supplementary files, are located at: https://osf.io/yas2p. We used SPSS (Version 25) and JASP (Version 0.12.2), therefore there is no separate analysis code.
Study 1
Method
Participants
Because our primary analyses in the larger study were correlations, which tend to stabilise at 260, our target was N = 260 (Schönbrodt & Perugini, Citation2013, Citation2018). A sensitivity analysis for a repeated-measures ANOVA with two between-factors (due to high rates of uncovering images, determined during pilot testing, we grouped participants according to those who uncovered all images and those who did not) showed that N = 260 provides 80% power to detect small-medium (f = 0.15) effects (G*Power; Faul et al., Citation2007; Lakens, Citation2022).
To promote data quality and minimise bots/server farmers, per our pre-registration, we screened out participants who failed a captcha, scored fewer than 8/10 on an English proficiency test (Moeck et al., Citation2022), did not select Instagram and/or selected “Konnect” (a bogus platform included to detect inattentive responses) when asked about social media use. We recruited 300 participants from the United States via Amazon’s Mechnical Turk,Footnote1 but excluded one who failed all three attention checks, one who experienced technical issues, one who did not follow instructions, and 34 who reported uncovering screens due to perceived task requirements (e.g. thinking they had to uncover). Our final sample comprised 263 participants, aged 18–71 years (M = 35.4, SD = 8.5) who were 51.7% female, 47.5% male, 1.1% non-binary (one participant preferred not to report gender). Our sample was predominantly Caucasian (72.6%, n = 191); other participants were of African-American (8.7%), Asian (7.2%), and Latinx (2.7%), or other (6.1%; e.g. mixed race/bi-race) descent; 2.7% of participants specified nationality (e.g. American/U.S.A.). Most participants (54.4%) reported income between $45,000–$140,000 and were predominantly (66.9%) college graduates (see Supplementary Table S1).
Materials and procedure
Following informed consent procedures, we asked participants to report demographic information, and two questions about Instagram use: “In the last 7 days, how many days did you use Instagram?”, “In the last 30 days, on an average day, how many hours did you use Instagram?” (Bridgland, Bellet, et al., Citation2023). To increase our cover story’s believability (how life experiences shape Instagram use), we asked participants how often (not at all – very often) they viewed different types of images (fashion, food etc.) on Instagram.
Participants then completed the short-form State-Trait Anxiety Inventory (STAI-6; 6-items e.g. I am worried, I feel calm; 1 = not at all to 4 = very much; current study α = .87 [Time 1], .91 [Time 2]; Marteau & Bekker, Citation1992) to assess current anxiety, and the Positive and Negative Affect Schedule (PANAS; 10-positive and 10-negative items e.g. excited, distressed; 1 = very slightly or not at all, 5 = extremely; Watson et al., Citation1988) to assess current negative affect. Scores for each scale were summed (range: 10–50), with higher scores indicating higher positive/negative affect (current study; Positive Affect: α = .91 [Time 1], .91 [Time 2], Negative Affect: α = .92 [Time 1], .93 [Time 2]). Because we did not pre-register analyses using the Positive Affect subscale, these data appear in Supplementary Table S3.Footnote2
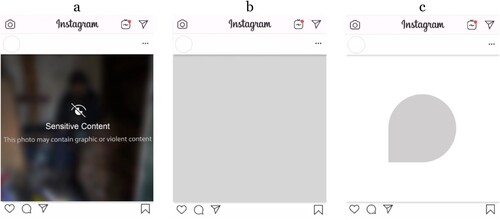
Next, participants completed our Instagram task. This task included the 70 most negative, positive, and neutral images (210 total) from the Nencki Affective Picture System (NAPS; Marchewka et al., Citation2014, p. 1 = negative to 9 = positive), which include content commonly found on Instagram (e.g. people, faces, animals, objects, landscapes). To promote attention to the images, we told participants we would ask them questions about the images at the end of the task. All images appeared in a typical Instagram frame (see ) with non-functional like and comment buttons, and no further image information (i.e. captions or hashtags; but see Simister, Bridgland, Williamson, et al., Citation2023). Consistent with Instagram formatting, a warning screen covered/blurred negative images ((a)). We randomly assigned participants to view one of two possible warnings to see whether our results would differ/generalise, based on wording: one contained wording Instagram introduced in ∼2020, “This photo may contain graphic or violent content”; the other had Instagram’s 2017 wording, “This photo contains sensitive content which some people may find offensive or disturbing”. When participants saw a sensitive-content screen, they could: uncover it and view the negative image underneath, or leave it covered and move to the next image. To promote ecological validity, participants viewed images one at a time, in a randomised order, at their own pace. However, all participants’ “exposure time” was capped at 5 minutes, meaning the total number of images each participant viewed varied. Following the Instagram task, all participants repeated the PANAS and STAI, and additional measures not analysed here (see Simister, Bridgland, & Takarangi, Citation2023). They completed feedback questions (e.g. Have you seen sensitive screens on your own Instagram?) and reported whether they stopped the task for an extensive period/encountered technical issues. We debriefed participants, and paid $2.50 USD for their participation.
Figure 1. Screen stimuli: (a) example of sensitive-content screen with warning and blurred image (all studies), (b) opaque grey screen with no warning (Study 2), (c) example of greyscale geometric shape used as filler stimuli (Study 3).
Results and discussion
We first examined participants’ social media and Instagram use. On average, participants reported that they used 3.59 (SD = 1.00) social media sites (see Supplementary Table S2 for full detail). Around a third of participants (34.2%) reported previously seeing a sensitive-content screen on Instagram.
Because participants’ progress through the Instagram task was self-paced, we next considered their overall exposure to negative content. On average, participants saw 61.53 (SD = 32.96, mdn = 55, range = 9–171) images during the task. As expected, around a third (M = 19.98, SD = 11.11, mdn = 18, range = 2–56) were negative images. Of these negative images, across the entire task, participants uncovered 70.7% (SD = 38.2%) on average. There were no statistically significant differences in uncovering behaviour based on warning wording (first image behaviour, χ2(1) = 0.0002, p = .99; uncovered all, or not, χ2(1) = 0.09, p = .77; proportion of screens uncovered, rs = .07, p = .23). Therefore, we collapsed all analyses across warnings.
Next, we turned to our primary research question: does exposure to a simulated Instagram feed featuring sensitive-content screens – with an uncovering option – have a negative impact? Recall we were also interested in whether uncovering behaviour would have cumulative effects (e.g. participants who uncovered more images/spent more time viewing negative images would have greater increases in state anxiety and negative affect, pre-to-post task).
We classified participants as uncovering all images (51.7%) or not. We expected that participants who uncovered all images would show greater increases in state anxiety and negative affectFootnote3 from T1 (pre-task) versus T2 (post-task) compared with participants who did not uncover all, due to greater exposure to negative material. We ran two 2 (uncovering behaviour: uncovered all, did not uncover all) × 2 (time: T1, T2) mixed ANOVAs on the STAI and PANAS negative affect subscale (). Overall, state anxiety and negative affect were higher (i.e. more negative) at T2 compared with T1; a main effect of time for anxiety, F(1, 261) = 222.24, p < .001, ηp2 = .460, and negative affect, F(1, 261) = 119.42, p < .001, ηp2 = .314. At T2, participants reported experiencing anxiety levels between “somewhat” and “moderately” according to the scale anchors. The shiftFootnote4 was greater than that induced by the well-known Trier Social Stress Test (TSST; Degroote et al., Citation2020), but lower than the combination of TSST and Cold Pressor Test (MAST; Shilton et al., Citation2017). Participants’ negative affect at T2 was consistent with responding “a little” for each negative item, on average. There was no difference in anxiety or affect between participants who uncovered all and those who did not; a nonsignificant main effect of uncovering behaviour, Fs < 2, ηp2s < .006. Against expectations, the effect of time on anxiety and affect did not depend on whether participants uncovered all images or not; a nonsignificant interaction between uncovering behaviour and time (anxiety: F(1, 261) = 2.97, p = .09, ηp2 = .011; affect: F(1, 261) = 1.04, p = .31, ηp2 = .004).
Table 1. Means (and standard deviations) for state anxiety and negative affect, by uncovering behaviour and time (Study 1).
We further predicted that our other measures of uncovering behaviour – the proportion of negative images uncovered, whether participants uncovered the first screened image they saw or not, and average negative image viewing timeFootnote5 – would relate to change in state anxiety and negative affect (computed by subtracting T1 scores from T2 scores, where positive values indicate increased anxiety/affect). Indeed, the more images participants uncovered, the more anxiety (r = .14 [95% CI: 0.02, 0.26], p = .02) and negative affect (r = .14 [95% CI: 0.02, 0.26], p = .02) they reported over time. However, these effects were small. Correlations for first image behaviour and viewing time (rs = –.08 – .12) were of similar size but did not reach significance. In retrospect, it seems unlikely first image behaviour would relate to changes in anxiety and affect. Perhaps viewing time (duration) has a negligible additional impact on participants’ reactions, beyond seeing the image at all (see Feinstein et al., Citation2014).
Together, our data show participants’ state anxiety and negative affect increased from pre-to-post task. This pattern of results occurred regardless of exposure to neutral and positive content – in addition to the sensitive-content screens and negative content – during the task, and despite participants’ opportunity to regulate their emotions via situation selection (i.e. leave all negative images covered; Gross, Citation2015). Interestingly, there was only limited (correlational) evidence uncovering behaviour had cumulative negative effects. This pattern is unsurprising given that, via uncovering behaviour, almost all participants (94.7%) were exposed to at least one negative image and most were exposed to multiple negative images. Thus, perhaps we found a small association between uncovering more images and negative impact, but no differences on negative impact according to whether participants uncovered all images or not, because we were not well-positioned to capture the impact of low-level exposure (e.g. one or two images). Further, although we cannot test it using our data, participants’ reactions to a small set of negative images may have been at ceiling. However, another possibility is that the negative impact we observed occurred not only because of participants’ deliberate exposure to negative images, but also because of exposure to sensitive-content screens. Indeed, all participants were exposed to screens – albeit a varying number due to self-pacing – regardless of whether they chose to uncover them. Put differently, perhaps the screens themselves produced anxiety. We explored this possibility in Study 2.
Study 2
Warnings about impending distress – whether content warnings for images or films (e.g. De Wied et al., Citation1997), or the risks associated with research participation (see Stirling et al., Citation2022) – aim to benefit people. Indeed, people may attempt to brace or “prepare” for the worst to mitigate the negative impact of upcoming negative events (e.g. Sweeny et al., Citation2015). However, perhaps when people view a warning, they instead begin to anticipate the negative reactions (e.g. distress, anxiety, panic etc.) they may have when they view the material related to the warning. Indeed, extant evidence on warnings – as well as adjacent literature on bracing (Sweeny et al., Citation2015) and nocebo effects (e.g. Myers et al., Citation1987) – fits with this idea. For example, participants reported anxiousness and nervousness more than any other emotion when asked to imagine encountering content with a trigger warning; they also reported more anticipated negative affect for video and essay titles accompanied by a warning (vs. no warning; Gainsburg & Earl, Citation2018). Similarly, participants who saw a trigger warning prior to watching a distressing film believed the film would be more negative than unwarned participants (Sanson et al., Citation2019). Relatedly, viewing a warning increases people’s anticipatory anxiety and negative affect prior to viewing negative content (e.g. Bridgland et al., Citation2019; Bridgland & Takarangi, Citation2022), and imagining encountering a warning (e.g. on television) is just as anxiety-provoking as imagining encountering trauma-related content itself (e.g. a television show depicting a traumatic event; Bridgland et al., Citation2022). Strikingly, others have found viewing trigger warnings prompts an increase in physiological stress responses (e.g. heart rate, respiration rate, skin conductance; Bruce et al., Citation2021) like seeing a reminder of one’s own traumatic experience (Pineles et al., Citation2011).
Here, then, we examined whether exposure to sensitive-content screens alone has a similar effect to warnings in other contexts, causing participants to experience increased anxiety and negative affect. Since these outcomes might be influenced by the number of images/screens participants see, or by the speed participants move through the task, we fixed the number of images and introduced an image-response delay to limit participants’ ability to rush through images. Indeed, although we explicitly instructed participants not to, some Study 1 participants rushed through the task: the average time to uncover (or move to the next image) was < 1s for 8% of participants (M = 8.3, SD = 15.9; collapsed across image valence: M = 4.0, SD = 3.6).
We predicted incidental exposure to screens (without an option to uncover) during the Instagram task would increase people’s state anxiety and negative affect relative to T1, and relative to a comparison group who viewed grey mask screens in place of sensitive-content screens.
Method
Participants
At 80% power, to detect d = 0.4, Brysbaert (Citation2019) recommends a minimum of n = 52 participants for a paired-samples design, and n = 100 participants per group for a two independent-groups design. Therefore, we aimed to collect 200 participants; 225 participants completed the study. We used the same screening procedures and CloudResearch settings as in Study 1. We excluded one participant who failed an embedded attention check, 20 who failed to achieve 6/8 on forced choice questions about the positive and neutral image content (e.g. Which of the following did you see? [select one]; “mountain”, “waterfall”), and one who used social networking sites during their participation. We retained three participants who briefly left the task (a few seconds to 5-minutes). Thus, our final sample comprised 203 participants (warning condition: n = 99; control condition: n = 104). Due to a programming error, we did not collect any demographic information. However, CloudResearch provided data for n = 220 participants (including participants we excluded) that suggested our sample was similar to Study 1: predominantly female (57%), aged < 21 (2%), 21–30 (36%), 31–40 (38%), 41–50 (15%), 51+ (8%); White/Caucasian (79%,), Black/African American (9%), Asian (7%), Multiracial (4%), or Pacific Native (0.1%).
Materials and procedure
Participants signed up for an “Instagram engagement” study. Similar to Study 1, after informed consent procedures, we asked participants about their Instagram use and types of content they viewed. Participants then completed the state anxiety (current study α = .91 [Time 1], .91 [Time 2]) and negative affect (α = .91 [Time 1], .92 [Time 2]) subscale. To make our focus on negative adjectives less obvious, we included four positive adjectives (as fillers) that we do not analyse.
Next, we randomly assigned participants to either the warning or control condition. All participants viewed 20 neutral, 20 positive, and 20 negative NAPS images (Marchewka et al., Citation2014), presented in Instagram frames for 5-seconds each (total time = 5-minutes). In the warning condition, we presented sensitive-content screens ((a)), but participants did not see the accompanying negative image. In the control condition, participants instead encountered grey mask screens with no accompanying warning, in the same Instagram frame ((b)). Prior to beginning the task, we told all participants the images would appear for a fixed duration, they would not be able to interact with (i.e. uncover, like, comment, etc.) screens or images, and they should pay attention because we would ask questions about the images. We also told them they may see screens where a negative image has been covered by a blur or a grey screen. After the image task, participants completed the anxiety and affect measures again. Since participants were passively viewing images – rather than clicking through as in Study 1 – we gave participants an 8-item forced choice test about the neutral and positive image content. We also asked them what they believed was underneath the masked images (open-text response). Finally, we asked participants whether they had seen sensitive-content screens on their Instagram feed before (yes/no), and if they had left the task at any point during the study (if so, when/for how long). We debriefed participants, who received $1.25 USD for their participation.
Results and discussion
We first examined participants’ social media and Instagram use. Participants reported they regularly used an average of 2.60 (SD = 1.30) social media sites (see Supplementary Table S2). Less than half our participants (43.8%) indicated they had previously seen a sensitive-content screen on Instagram. The proportion was higher in the warning condition (54.5%; similar to Bridgland, Bellet, et al., Citation2023) than in the control condition (33.6%; similar to Study 1; χ2 (1) = 8.99, p = .003, φ = 0.21; see Supplementary Table S4). Since both studies were completed in the second half of 2020, it is unlikely participants had become more familiar with warnings between studies. Participants in the warning condition were exposed to the same number of warning screens (20) that participants in Study 1 saw, on average. Yet Study 2 participants were exposed to screens for 100 s in total (compared to an average total exposure time of 40 s in Study 1). Thus, perhaps the increased fluency of exposure in Study 2 made participants more likely to believe they had seen the screens before, outside the study context (Jacoby et al., Citation1989). However, there were no overall differences between participants who had previously seen or not seen the screens for changes in anxiety (p = .46, d = 0.10) or affect (p = .87, d = 0.02). Therefore, it seems unlikely this group difference had a meaningful effect on our main findings. All other patterns of social media use, and rates of leaving the task were broadly similar across conditions (see Supplementary Tables S5 and S6).
We next turned to our primary research aims. Recall we predicted exposure to sensitive-content screens alone (without an option to uncover) would increase people’s state anxiety and negative affect relative to T1, and to a comparison group viewing control images.
To test this hypothesis, we ran two 2 (condition: warning, control) × 2 (time: T1, T2) mixed ANOVAsFootnote6 on the STAI and PANAS negative affect subscale separately (). Overall, state anxiety and negative affect were higher (i.e. more negative) at T2 compared with T1; a main effect of time for state anxiety, F(1, 201) = 8.47, p = .004, ηp2 = .04, and for negative affect, F(1, 201) = 4.21, p = .04, ηp2 = .02. State anxiety was higher in the warning condition compared to the control condition overall, a main effect for condition, F(1, 201) = 5.50, p = .02, ηp2 = .03; this difference was not statistically significant for negative affect, F(1, 201) = 3.67, p = .06, ηp2 = .02. Importantly, however, the effect of time on state anxiety and negative affect depended on whether participants saw warning screens or control screens, a significant interaction (anxiety: F(1, 201) = 10.30, p = .002, ηp2 = .05; affect: F(1, 201) = 6.88, p = .01, ηp2 = .03). Indeed, as predicted, participants in the warning condition reported more anxiety at T2 compared to T1, t(98) = 3.83, p < .001, d = 0.39, 95% CI [0.18, 0.59]. Similarly, negative affect increased relative to T1, t(98) = 2.76, p = .01, d = 0.38 [0.18, 0.59].Footnote7 By contrast, participants in the control condition reported similar anxiety at T2 compared to T1, t < 1, d = 0.02, 95% CI [−0.17, 0.22] and similar negative affect over time (M = 12.57, SD = 4.42, t < 1, d = 0.05 [−0.14, 0.24]). In sum, our results suggest exposure to sensitive-content screens alone has a negative impact on participants by increasing state anxiety (to “somewhat” anxious, on average) and negative affect (participants’ scores rose to midway between “not at all” and “a little” on average). The raw change in state anxiety is comparable to that induced by a fearful video-clip (Tovilovic et al., Citation2009) and slightly lower than that of a speech preparation task (e.g. Gonzalez-Bono et al., Citation2002).
Table 2. Means (and standard deviations) for state anxiety and negative affect, by condition and time (Study 2).
An interesting issue is the extent to which screens have this effect because participants are more likely to believe there was negative content beneath the warning screens (warning condition), than beneath the grey mask screens (control condition), despite both screens feasibly acting as “warning signals”. To investigate this possibility, two coders – blind to condition – grouped participants’ open-text responses based on whether participants believed what was under the blur/warning or grey mask was negative (or “sensitive”, “graphic”, etc.). Three discrepancies were resolved by a third coder. Using this coding, we only retained participants in the warning condition who reported the warning covered negative images (e.g. “injuries or people who were hurt”; n = 89; 89.9% of the group). We divided the control condition into two groups, which pilot testing suggested would be roughly equal in size: [1] participants who reported that the grey mask covered negative content (n = 47; 45.2% of the group), and [2] participants who responded “don’t know” or reported that the grey mask covered non-negative images (e.g. neutral, positive, similar to the not-covered images, etc.; n = 57). We ran two 3 (group: warning + belief, control + belief, control + no belief) × 2 (time: T1, T2) mixed ANOVAsFootnote8 on the STAI and PANAS negative affect subscales separately. For state anxiety, there were significant main effects of time (F(1, 190) = 3.94, p = .05, ηp2 = .02) and group (F(2, 190) = 3.37, p = .04, ηp2 = .03). For negative affect, these main effects were not statistically significant (Time: F(1, 190) = 1.83, p = .18, ηp2 = .01; Group: F(2, 190) = 2.64, p = .07, ηp2 = .03). As expected, the effect of time on anxiety and affect depended on group, a significant interaction (anxiety: F(2, 190) = 6.14, p = .003, ηp2 = .06; affect: F(2, 190) = 4.45, p = .01, ηp2 = .05). To follow up these significant interactions, we compared the warning + belief and control + belief groups. Consistent with our original hypothesis, warning participants reported a greater change in anxiety (M = 1.31, SD = 3.02) compared to control participants (M = –.02, SD = 2.27, t(118.24) = 2.90, p = .004, d = 0.48, 95% CI [0.12, 0.84]). Similarly, negative affect changed more in the warning group (M = 1.28, SD = 4.12) relative to the control group (M = 0.21, SD = 1.65, t(127.21) = 2.14, p = .03, d = 0.31 [−0.05, 0.66]).Footnote9 We next focused on the control + belief and control, no belief groups: although participants who believed there was negative content underneath the grey screen reported a greater change in negative affect over time, compared to participants who did not mention negative content, this difference was not statistically significant and small, d = 0.23, p = .25. There was also no difference for change in state anxiety, d = 0.03, p = .89. However, we note the smaller sample size for this comparison.
In summary, our data show that exposure to sensitive-content screens increases people’s state anxiety and negative affect, compared to exposure to grey mask screens – even when participants believe both screen types cover negative images. This finding aligns with other research demonstrating that warnings – as well as anticipating negative outcomes more generally – cause a noxious anticipatory period marked by anxiety and negative affect. It is thus possible that the negative impact of exposure to sensitive-content screens themselves contributed to the increased anxiety and negative affect we observed in Study 1, where most participants were also exposed to varying numbers of negative images, over a 5-minute period. However, our data also raise the possibility that exposure to warnings alone, in both Studies 1 and 2, led to increased anxiety and negative affect. Although people appear to feel anxious in anticipation of negative content (i.e. when they see a sensitive-content screen), perhaps sensitive-content screens ameliorate their reactions to the negative content underneath the screen. Another possibility is the impact of warnings and content is additive; indeed, comparing the post-task means across studies suggests that negative impact was greater when participants were exposed to both warnings and negative content (Study 1) than only warnings (Study 2). However, because exposure to negative content varied across participants in Study 1, we systematically tested this possibility in Study 3.
Study 3
Trigger warning advocates claim warnings help people “mentally prepare” to cope with distressing content, mitigating negative reactions that could occur if people encountered such content unaware (George & Hovey, Citation2020). Yet the trigger warning literature suggests the negative anticipatory period people experience when they see a trigger warning is unlikely to reflect mental preparation. Indeed, trigger warnings do not prompt strategies like reappraisal (e.g. reminding oneself to focus on non-emotional aspects) to come to mind (Bridgland et al., Citation2022) or increase “preparation time” before viewing distressing imagery (Bridgland & Takarangi, Citation2022). On the contrary, participants appear to spend less time lingering on sensitive-content screens versus control screens, within the first two trials of a task involving viewing trauma imagery (Bridgland & Takarangi, Citation2022).
If warnings do not prompt preparation, then perhaps when people view a warning, they anticipate and expect negative reactions (e.g. distress, anxiety, etc.) that they subsequently manifest when they see the content. This process would be consistent with the nocebo effect literature and would be additive in the sense that both the warning and content contribute to participants’ negative reactions to the task. Indeed, a recent meta-analysis of 12 experiments found trigger warnings do not mitigate emotional reactions towards a range of negative stimuli (vs. viewing the stimuli with no warning) – including for participants with a history of trauma and probable PTSD (Bridgland, Jones, et al., Citation2023). Thus, trigger warnings appear to lead to negative anticipatory periods with no observable emotional payoffs.
Together, the literature suggests several possibilities for how sensitive-content screens affect people’s reactions to negative material. If advocates’ claims about preparation are true, then exposure to potentially distressing images without warnings should increase people’s state anxiety and negative affect relative to baseline, and to a comparison group exposed to potentially distressing images with warnings. If exposure to warnings and content have an additive impact, then the opposite should be true: exposure to potentially distressing images with warnings should increase people’s state anxiety and negative affect relative to baseline, and relative to participants exposed to potentially distressing images without warnings. However, if warning screens have neither emotional payoffs (e.g. via preparation) nor do they manifest anticipated negative reactions, then increases in people’s state anxiety and negative affect may be similar whether people are exposed to images with or without warnings. That is, perhaps sensitive-content screens are neither meaningfully helpful nor harmful (see Sanson et al., Citation2019).
Method
Participants
We used a similar sample size rationale to Study 2, with a small increase given Brysbaert (Citation2019) recommends n = 110 participants per group to seek moderate evidence for the null hypothesis (our third prediction; BF < 0.33), for a two independent-groups design. We aimed to collect 220 participants; 258 participants completed the study. We used identical screening procedures and participant qualifications to our prior studies but added a “cultural check” question to verify worker country location in the U.S. (we showed participants a picture of an eggplant and asked them what it is called [we expected participants from the United States to answer: “eggplant”]; Moeck et al., Citation2022). We excluded 30 participants who failed to get 6/8 forced choice questions about the positive and neutral image content correct, six participants who reported technical issues (e.g. photos not loading), and two who failed our cultural check question. We retained three participants who reported leaving the task (a few seconds to 30 s). Thus, our analyses focus on the remaining 220 participants (image + warning condition: n = 110; image-only condition: n = 110).
Participants were aged 20–74 years (M = 38.11, SD = 10.17) and 58.6% female, 40.5% male, 0.9% non-binary (one participant preferred not to report gender). Our sample was mostly Caucasian (71.4%, n = 157); other participants were of African-American (6.8%), Asian (7.3%), and Latinx (5.9%), Pacific Islander (0.5%) or other (3.2%; e.g. mixed race/bi-race) descent; 5.0% of participants specified nationality (e.g. American/U.S.A.). Most participants (50.9%) reported income between $45,000-$140,000 and were predominantly (56.4%) college graduates.
Materials and procedure
The initial phase of the study was identical to Study 2. We randomly assigned participants to either the image + warning, or image-only condition. As in Study 2, all participants viewed 20 neutral, 20 positive, and 20 negative randomised NAPS images for 5-seconds each. In the image + warning condition, participants viewed a screened version of the negative image ((a)) for 5-seconds. Unlike Study 1, participants could not uncover the screen; rather, the negative image automatically appeared after the screen. In the image-only condition, negative images appeared without a preceding warning; to equate for time on task, these participants saw 20 black/greyscale geometric shapes ((c)), set in an Instagram frame and randomly intermixed with the images. Total task time was therefore 400 s (6.66 mins) for all participants. We gave participants the same instructions and questions (e.g. familiarity with sensitive-content screens) as in Study 2. We additionally asked participants how closely they paid attention to the images (1 = not at all closely, 7 = very closely), and whether they closed their eyes/looked away from the images (if so, how many images). We debriefed participants, who received $1.50 USD for their participation.
Results and discussion
We first examined participants’ social media and Instagram use. Participants reported using an average of 3.58 (SD = 1.05) social media sites (Supplementary Table S2). Most participants (79.5%) indicated they had previously seen a sensitive-content screen on Instagram. This increased familiarity with screens relative to Studies 1 and 2 may reflect increased use of screens over time (Studies 1 and 2 occurred in 2020; Study 3 occurred in March/April 2022). The pattern of social media use, familiarity with sensitive-content screens, leaving the task, looking away from images, demographics, and paying attention, appeared similar between conditions. However, there were more females in the warning condition (65.5%), than the control condition (51.8%; χ2 (1) = 4.27, p = .04; see Supplementary Tables S6–S10).
We next turned to our primary research aims. Recall we had competing predictions about whether exposure to distressing images without a warning (control) would increase people’s state anxiety and negative affect compared to baseline, and compared to people who see distressing images with a sensitive-content screen. We again ran two 2 (condition: image + warning, image-only) × 2 (time: T1, T2) mixed ANOVAsFootnote10 on the STAI and PANAS negative affect subscale (). As in our previous studies, anxiety and negative affect were higher (i.e. more negative) at T2 compared with T1; here, there was a large main effect of time for state anxiety, F(1, 218) = 380.01, p < .001, ηp2 = 0.64, and for negative affect, F(1, 218) = 249.65, p < .001, ηp2 = 0.53. At T2, participants reported experiencing average anxiety levels between “somewhat” and “moderately”, and negative affect of at least “a little”. The raw changes in state anxiety across both conditions were higher than for the combined social and physiological stress induction (Shilton et al., Citation2017), and the task of recalling a personal anxiety-provoking event while viewing fearful faces (Geeraerts et al., Citation2005).
Table 3. Means (and standard deviations) for state anxiety and negative affect, by condition and time (Study 3).
State anxiety was higher in the image + warning condition compared to the image-only condition overall, a main effect for condition, F(1, 218) = 5.45, p = .02, ηp2 = 0.02; the pattern was similar for negative affect, F(1, 218) = 4.64, p = .03, ηp2 = 0.02. These differences by condition may be driven by a small difference at T1 despite random allocation (see ). Importantly, the effect of time on negative impact did not depend on whether participants saw negative images with or without warning screens: there was no significant interaction for anxiety, F < 1, or negative affect,Footnote11 F(1, 218) = 2.43, p = .12, ηp2 = 0.01. That is, against advocates’ claims, participants in the image + warning condition reported similar changes in anxiety and negative affect to participants in the image-only condition.
To quantify evidence that our data favoured the null hypothesis (Bayes Factors <1) relative to the alternative hypothesis of a greater difference for the image + warning group, we obtained Bayes Factors (BF10; using the default prior in JASP, a Cauchy distribution centred around zero with a 0.707 width parameter; JASP Team, Citation2022), using T1-T2 difference scores. We followed Wetzels et al.’s (Citation2011) guidelines: anecdotal = 1–0.3, substantial = 0.3–0.1, strong = 0.1–0.03, very strong = 0.03–0.01, decisive <0.01. We found strong evidence (BF10 = 0.16) for no difference between groups for state anxiety, and anecdotal evidence (BF10 = 0.46) for no difference between groups for negative affect. Interestingly, the evidence favours a greater increase in negative affect when participants saw negative images with warnings.
In summary, our Study 3 data show that exposure to negative images during a simulated Instagram task increases people’s state anxiety and negative affect, regardless of whether those images are preceded by a sensitive-content screen or not.
This data pattern does not support the idea that warnings and content have additive impact, because exposure to potentially distressing images and warnings did not increase people’s state anxiety and negative affect relative to participants exposed to potentially distressing images without warnings. Study 2 shows that warnings increase anxiety and negative affect, but these effects were small-medium and presumably smaller than the impact of negative images themselves. Importantly, there is no evidence sensitive-content screens ameliorate people’s reactions to the negative content that follows them, despite advocates claims. This finding is consistent with existing literature (see Bridgland, Jones, et al., Citation2023).
General discussion
Our prior research demonstrates sensitive-content screens fail to deter most people from exposing themselves to potentially distressing content (e.g. Bridgland, Bellet, et al., Citation2023; Simister, Bridgland, & Takarangi, Citation2023). Across three experiments we found sensitive-content screens also fail to reduce the negative emotional impact when people do view potentially distressing content. We first considered whether deliberate exposure to distressing content increased participants’ state anxiety and negative affect; it did, and there was some evidence this effect is cumulative. We next considered whether exposure to sensitive-content screens themselves – in the absence of distressing content – increased participants’ state anxiety and negative affect. Again, it did, though the effect was smaller than exposure to distressing content. Finally, we considered whether seeing a sensitive-content screen, or not, prior to viewing distressing content changed participants’ state anxiety and negative affect. It did not. Thus, although sensitive-content screens in their current form are unlikely harmful, they are not helpful.
Turning to our first key finding, we found some evidence for a cumulative impact using our Instagram task, consistent with evidence from the indirect trauma literature that a longer duration of exposure to graphic media increases traumatic stress symptoms (e.g. Holman et al., Citation2020). However, perhaps the pattern would have been more robust had we directly manipulated exposure (e.g. by controlling the number of images participants saw, as in Studies 2 and 3), rather than relying on participants’ naturalistic decision-making behaviour when presented with uncovering opportunities. Here, people who uncovered more images were perhaps those who felt comfortable to continue uncovering, while participants who felt discomfort may have discontinued uncovering. Alternatively, participants may reach an exposure threshold – or an emotional response threshold to exposure – at which additional exposure has limited impact. Indeed, Feinstein et al. (Citation2014) found the frequency (i.e. daily, weekly, monthly) that journalists were exposed to graphic content was associated with increased psychopathological symptoms (e.g. PTSD, depression, anxiety), while exposure duration (i.e. 1–6 h) was only related to intrusions. Therefore, perhaps the frequency with which people encounter sensitive material on Instagram over time, rather than how often they see such material in a single session, has a greater influence on their reactions to that material. However, other research suggests both greater duration of exposure to graphic media (i.e. hours per day) and frequency of exposure (i.e. how often they reported seeing the images; Thompson et al., Citation2019) contribute to increased posttraumatic stress symptoms. Future research could therefore differentiate between exposure frequency and duration. Certainly, it is possible small negative effects caused by warnings and negative content may accumulate and have more potent emotional consequences with repetition, by affecting large numbers of people, and by having cascading effects on users’ other social media behaviour (e.g. self-triggering; Anvari et al., Citation2022; Funder & Ozer, Citation2019).
Our second key finding, that participants experienced increased state anxiety and negative affect following exposure to sensitive-content screens in the absence of distressing content, is consistent with a growing body of literature (e.g. Bridgland et al., Citation2019). This literature includes evidence that bracing leads to anticipatory emotions, and that people often “feel” the effects of reactions they are warned about (Spacapan & Cohen, Citation1983). However, considering data from Studies 2 and 3, although we know viewing warnings increases state anxiety and negative affect, this effect appears negligible when it is additional to exposure to negative content itself. Future research could investigate this issue further by tracking people’s anxiety/affect over the course of the task (vs. pre-to-post task). Indeed, this issue is a limitation of all three studies, which assess the entire task’s negative impact rather than momentary fluctuations.
Finally, our third key finding, that warnings do not mitigate negative reactions to subsequent content, is consistent with recent meta-analysis data showing trigger warnings create negative anticipation without any observable emotional payoffs (Bridgland, Jones, et al., Citation2023). Although we did not directly measure whether sensitive-content screens prompted emotional “preparation” (e.g. asking participants what they are doing when they see a screen), there is also no indirect evidence of helpful preparation (i.e. reduced negative affect for warned vs. unwarned participants). Here again, we argue sensitive-content screens, and trigger warnings, may fail to function as intended because they do not provide people with implementable strategies (e.g. emotion regulation) that could reduce the impact of exposure to potentially distressing imagery (Bridgland et al., Citation2022). How warnings might be adapted to provide such information is a critical focus for future research. For example, participants given acceptance (experience emotions without judgment) or reappraisal (reframe thoughts in unemotional or positive terms) instructions experience significantly lower levels of negative emotions when watching negative films compared to when they are given no instructions (Wolgast et al., Citation2011). Therefore, we might expect a similar pattern of results to emerge in future warning research.
Overall, our findings have implications for trigger warning use in applied settings. Using trigger warnings may become a “box-ticking exercise”. Adding a trigger warning to content (e.g. social media post) does not absolve social media platforms from making other efforts to present distressing content in a conscientious and evidence-based way (e.g. developing new policy based on emerging research), or from providing other wraparound mental health support (e.g. funding and developing educational programmes about online safety). Our results suggest sensitive-content screens do not work as intended, thus other protections may be necessary.
While our results add to the growing body of work showing warnings have little benefit for immediate emotional reactions to distressing material, future work should focus on other outcomes. For instance, warnings may change other appraisals such as feelings of respect or understanding. Indeed, we know feelings of institutional betrayal predict people’s preferences for trigger warnings on campus (Bruce & Roberts, Citation2020). Therefore, trigger warnings may have other costs/benefits beyond the scope of the present study.
Across our studies, there are several limitations. First, we used a general population of Instagram users, and did not examine reactions to sensitive-content screens among sub-samples with mental health vulnerabilities (e.g. clinical depression). However, previous research found no evidence trigger warnings influence emotional reactions or increase avoidance of material among sub-populations (see Bridgland, Jones, et al., Citation2023). Second, in Studies 2 and 3, we removed participants’ control over what they viewed and for how long, creating a less ecologically valid passive encoding task that could also have increased anxiety (e.g. Havranek et al., Citation2015). Due to this methodological feature, in Study 3 we also could not examine the impact of deliberate exposure to negative content post-warning, a condition that is more ecologically valid (yet gives rise to potential problems with internal validity, e.g. time on task). Third, participants in Study 3’s image-only condition saw filler images intermixed with regular images; participants potentially ascribed meaning to those images (e.g. the images might be flagging negative content). However, these filler images were programmed to appear randomly and did not precede negative content specifically. Fourth, during consent, we informed participants in all studies about the potentially graphic nature of the images. It is possible this information acted as an overall warning. For example, perhaps participants experienced a general increase in anxiety because they were in a situation where negative images might be shown. Unfortunately, this limitation is difficult to remedy methodologically, given ethical constraints. But, in future research we could ask participants whether they believed they would not see negative images unless they chose to.
We have no reason to believe our results depend on particular characteristics of the participants, materials, or context, and thus believe our results would be reproducible with similar participants (i.e. crowdsourced online participants who use Instagram), similar image stimuli and warning statements, and likely with other measures of emotional impact and other social media formats.
In sum, our findings across three studies suggest exposure to sensitive-content screens alone, as well as in combination with potentially distressing content, leads to an increased anxious and negative affect state. However, the presence of screens, and any reactions they produce, does not offset any emotional burden resulting from viewing negative content. Social media platforms should look beyond sensitive-content screens to protect people’s well-being in the face of potentially distressing content.
Disclosure statement
No potential conflict of interest was reported by the author(s).
Additional information
Funding
Notes
1 Participants had previous experience of >1000 tasks, a 95% approval rating, and we used the “Block Low Quality Participants” CloudResearch option.
2 For the purposes of the larger study (Simister, Bridgland, & Takarangi, Citation2023), approximately half the participants (n = 134) first completed a battery of questionnaires measuring well-being, depression, anxiety and stress symptoms, trauma history, post-traumatic stress symptoms, centrality of trauma, and history of self-triggering; the remaining participants completed these questionnaires later in the session.
3 Although we did not pre-register analyses for the positive affect subscale, the pattern was the same as negative affect albeit in the opposite direction (decreasing over time). See Supplementary Table S3.
4 To compare to studies using the full version of the STAI, we multiplied individual participants’ mean scores by 20.
5 After pre-registration we realised it was not feasible to calculate two of the subsidiary ways we proposed to operationalise uncovering behaviour (i.e., time spent viewing the first uncovered negative image, proportion of images participants uncovered after the first image they uncovered).
6 At the request of reviewers, we report these pre-registered ANOVAs as our primary analyses; analyses using difference scores appear in supplementary material. According to a sensitivity analysis for a 2 × 2 repeated measures ANOVA (within-between interaction), our final sample size of 203 gives us adequate power to detect a small-medium effect (the smallest effect we would be interested in based on practical significance and financial constraints): 80% power to detect effect size F(V) (“as in Cohen, 1988”) = 0.20 (ηp2 = 0.04), 90% power to detect F(V) = 0.22 (ηp2 = 0.047), and 95% power to detect F(V) = 0.25 (ηp2 = 0.06).
7 When we analysed the data according to whether participants reported seeing sensitive-content screens on their own Instagram or not, we noticed these effects were larger (STAI: d = 0.44; PANAS: d = 0.37) among participants who had not seen the screens before than among those who had (STAI: d = 0.33; PANAS: d = 0.21).
8 We only pre-registered planned contrasts; we ran the 3 × 2 ANOVAs at the request of a reviewer.
9 We used Welch’s t-tests here due to unequal variances (and group sizes).
10 At the request of reviewers, we now report these pre-registered ANOVAs as our primary analyses; analyses using difference scores appear in our supplementary material.
11 When we analysed the data according to whether participants reported seeing sensitive-content screens on Instagram or not, the pattern of results was similar for those who had seen the screens before (n = 175). However, among participants who had not seen screens before, there was a significant interaction between time and condition for negative affect, F(1, 43) = 5.07, p = .03, ηp2 = 0.11. Participants who were warned (n = 21) reported a greater increase in negative affect from T1 (M = 13.10, SD = 5.21) to T2 (M = 25.24, SD = 10.24), compared to those in the control condition (n = 24, T1: M = 13.75, SD = 5.21; T2: M = 20.79, SD = 7.81). These data work against the idea that warnings are helpful; nevertheless, we recommend cautious interpretation due to the low sample size in these sub-analyses.
References
- Abramowitz, J. S., Deacon, B. J., & Whiteside, S. P. (2019). Exposure therapy for anxiety: Principles and practice. Guilford Press.
- American Psychiatric Association. (2013). Diagnostic and statistical manual of mental disorders (5th ed.). American Psychiatric Publishing.
- Anvari, F., Kievit, R., Lakens, D., Pennington, C. R., Przybylski, A. K., Tiokhin, L., Wiernik, B. M., & Orben, A. (2022). Not all effects are indispensable: Psychological science requires verifiable lines of reasoning for whether an effect matters. Perspectives on Psychological Science. Advance online publication. https://doi.org/10.1177/17456916221091565
- Boysen, G. A., Isaacs, R. A., Tretter, L., & Markowski, S. (2021). Trigger warning efficacy: The impact of warnings on affect, attitudes, and learning. Scholarship of Teaching and Learning in Psychology, 7(1), 39–52. https://doi.org/10.1037/stl0000150
- Bridgland, V. M. E., Jones, P. J., & Bellet, B. W. (2023). A meta-analysis of the effects of trigger warnings, content warnings, and content notes. Clinical Psychological Science. Advance online publication. https://doi.org/10.1177/2167702623118662
- Bridgland, V. M. E., Barnard, J. F., & Takarangi, M. K. T. (2022). Unprepared: Thinking of a trigger warning does not prompt preparation for trauma-related content. Journal of Behavior Therapy and Experimental Psychiatry, 75. https://doi.org/10.1016/j.jbtep.2021.101708
- Bridgland, V. M. E., Bellet, B. W., & Takarangi, M. K. T. (2023). Curiosity disturbed the cat: Instagram’s sensitive-content screens do not deter vulnerable users from viewing distressing content. Clinical Psychological Science, 11(2), 290–307. https://doi.org/10.1177/21677026221097618
- Bridgland, V. M. E., Green, D. M., Oulton, J. M., & Takarangi, M. K. T. (2019). Expecting the worst: Investigating the effects of trigger warnings on reactions to ambiguously themed photos. Journal of Experimental Psychology: Applied, 25(4), 602–617. https://doi.org/10.1037/xap0000215
- Bridgland, V. M. E., Moeck, E. K., Green, D. M., Swain, T. L., Nayda, D. M., Matson, L. A., Hutchison, N. P., & Takarangi, M. K. T. (2021). Why the COVID-19 pandemic is a traumatic stressor. PLOS ONE, 16(1), e0240146. https://doi.org/10.1371/journal.pone.0240146
- Bridgland, V. M. E., & Takarangi, M. K. T. (2022). Something distressing this way comes: The effects of trigger warnings on avoidance behaviors in an analogue trauma task. Behavior Therapy, 53(3), 414–427. https://doi.org/10.1016/j.beth.2021.10.005
- Bruce, M., & Roberts, D. (2020). Trigger warnings in context: The role of institutional betrayal in the trigger warning debate. College Student Journal, 54(4), 484–490.
- Bruce, M. J., Stasik-O’Brien, S. M., & Hoffmann, H. (2021). Students’ psychophysiological reactivity to trigger warnings. Current Psychology, 1–10. https://doi.org/10.1007/s12144-021-01895-1
- Brysbaert, M. (2019). How many participants do we have to include in properly powered experiments? A tutorial of power analysis with reference tables. Journal of Cognition, 2(1), 1–38. https://doi.org/10.5334/joc.72
- Carleton, R. N., Afifi, T. O., Turner, S., Taillieu, T., Duranceau, S., LeBouthillier, D. M., Sareen, J., Ricciardelli, R., MacPhee, R. S., Groll, D., Hozempa, K., Brunet, A., Weekes, J. R., Griffiths, C. T., Abrams, K. J., Jones, N. A., Beshai, S., Cramm, H. A., Dobson, K. S., … Asmundson, G. J. G. (2018). Mental disorder symptoms among Canadian first responder and other public safety personnel. Canadian Journal of Psychiatry, 63(1), 54–64. https://doi.org/10.1177/0706743717723825
- Degroote, C., Schwaninger, A., Heimgartner, N., Hedinger, P., Ehlert, U., & Wirtz, P. H. (2020). Acute stress improves concentration performance. Experimental Psychology, 67(2), 88–98. https://doi.org/10.1027/1618-3169/a000481
- De Wied, M., Hoffman, K., & Roskos-Ewoldsen, D. R. (1997). Forewarning of graphic portrayal of violence and the experience of suspenseful drama. Cognition and Emotion, 11(4), 481–494. https://doi.org/10.1080/026999397379890
- Faul, F., Erdfelder, E., Lang, A.-G., & Buchner, A. (2007). G*power 3: A flexible statistical power analysis program for the social, behavioral, and biomedical sciences. Behavior Research Methods, 39(2), 175–191. https://doi.org/10.3758/BF03193146
- Feinstein, A., Audet, B., & Waknine, E. (2014). Witnessing images of extreme violence: A psychological study of journalists in the newsroom. JRSM Open, 5(8), 1–7. https://doi.org/10.1177/2054270414533323
- Figley, C. R. (1995). Systemic traumatization: Secondary traumatic stress disorder in family therapists. In Integrating family therapy: Handbook of family psychology and systems theory (pp. 571–581). American Psychological Association. https://doi.org/10.1037/10172-033
- Funder, D. C., & Ozer, D. J. (2019). Evaluating effect size in psychological research: Sense and nonsense. Advances in Methods and Practices in Psychological Science, 2(2), 156–168. https://doi.org/10.1177/2515245919847202
- Gainsburg, I., & Earl, A. (2018). Trigger warnings as an interpersonal emotion-regulation tool: Avoidance, attention, and affect depend on beliefs. Journal of Experimental Social Psychology, 79, 252–263. https://doi.org/10.1016/j.jesp.2018.08.006
- Geeraerts, B., Vandenberghe, J., Van Oudenhove, L., Gregory, L. J., Aziz, Q., Dupont, P., Demyttenaere, K., Janssens, J., & Tack, J. (2005). Influence of experimentally induced anxiety on gastric sensorimotor function in humans. Gastroenterology, 129(5), 1437–1444. https://doi.org/10.1053/j.gastro.2005.08.020
- George, E., & Hovey, A. (2020). Deciphering the trigger warning debate: A qualitative analysis of online comments. Teaching in Higher Education, 25(7), 825–841. https://doi.org/10.1080/13562517.2019.1603142
- Gonzalez-Bono, E., Moya-Albiol, L., Salvador, A., Carrillo, E., Ricarte, J., & Gomez-Amor, J. (2002). Anticipatory autonomic response to a public speaking task in women. Biological Psychology, 60(1), 37–49. https://doi.org/10.1016/s0301-0511(02)00008-x
- Gross, J. J. (2015). The extended process model of emotion regulation: Elaborations, applications, and future directions. Psychological Inquiry, 26(1), 130–137. https://doi.org/10.1080/1047840x.2015.989751
- Harvey, S. B., Milligan-Saville, J. S., Paterson, H. M., Harkness, E. L., Marsh, A. M., Dobson, M., Kemp, R., & Bryant, R. A. (2016). The mental health of fire-fighters: An examination of the impact of repeated trauma exposure. Australian & New Zealand Journal of Psychiatry, 50(7), 649–658. https://doi.org/10.1177/0004867415615217
- Havranek, M. M., Bolliger, B., Roos, S., Pryce, C. R., Quednow, B. B., & Seifritz, E. (2015). Uncontrollable and unpredictable stress interacts with subclinical depression and anxiety scores in determining anxiety response. The International Journal on the Biology of Stress, 19(1), 53–62. https://doi.org/10.3109/10253890.2015.1117449
- Hensel, J. M., Ruiz, C., Finney, C., & Dewa, C. S. (2015). Meta-analysis of risk factors for secondary traumatic stress in therapeutic work with trauma victims. Journal of Traumatic Stress, 28(2), 83–91. https://doi.org/10.1002/jts.21998
- Holman, E. A., Garfin, D. R., Lubens, P., & Silver, R. C. (2020). Media exposure to collective trauma, mental health, and functioning: Does it matter what you see? Clinical Psychological Science, 8(1), 111–124. https://doi.org/10.1177/2167702619858300
- Jacoby, L. L., Kelley, C. M., & Dywan, J. (1989). Memory attributions. In H. L. Roediger & F. I. M. Craik (Eds.), Varieties of memory and consciousness: Essays in honor of Endel Tulving (pp. 391–422). Erlbaum.
- JASP Team. (2022). JASP (Version 0.16.3) [Computer software].
- Kross, E., Verduyn, P., Demiralp, E., Park, J., Lee, D. S., Lin, N., Shablack, H., Jonides, J., & Ybarra, O. (2013). Facebook use predicts declines in subjective well-being in young adults. PLoS One, 8(8), e69841. https://doi.org/10.1371/journal.pone.0069841
- Lakens, D. (2022). Sample size justification. Collabra: Psychology, 8(1). https://doi.org/10.1525/collabra.33267
- Marchewka, A., Żurawski, Ł, Jednoróg, K., & Grabowska, A. (2014). The Nencki Affective Picture System (NAPS): Introduction to a novel, standardized, wide-range, high-quality, realistic picture database. Behavior Research Methods, 46(2), 596–610. https://doi.org/10.3758/s13428-013-0379-1
- Marteau, T. M., & Bekker, H. (1992). The development of a six-item short-form of the state scale of the Spielberger State—Trait Anxiety Inventory (STAI). British Journal of Clinical Psychology, 31(3), 301–306. https://doi.org/10.1111/j.2044-8260.1992.tb00997.x
- May, C. L., & Wisco, B. E. (2016). Defining trauma: How level of exposure and proximity affect risk for posttraumatic stress disorder. Psychological Trauma: Theory, Research, Practice, and Policy, 8(2), 233–240. https://doi.org/10.1037/tra0000077
- McHugh, B. C., Wisniewski, P., Rosson, M. B., & Carroll, J. M. (2018). When social media traumatizes teens: The roles of online risk exposure, coping, and post-traumatic stress. Internet Research, 28(5), 1169–1188. https://doi.org/10.1108/IntR-02-2017-0077
- Moeck, E. K., Bridgland, V. M. E., & Takarangi, M. K. T. (2022). Food for thought: Commentary on Burnette et al. (2021) “Concerns and recommendations for using Amazon MTurk for eating disorder research”. International Journal of Eating Disorders, 55(2), 282–284. https://doi.org/10.1002/eat.23671
- Myers, M. G., Cairns, J. A., & Singer, J. (1987). The consent form as a possible cause of side effects. Clinical Pharmacology & Therapeutics, 42(3), 250–253. https://doi.org/10.1038/clpt.1987.142
- Pineles, S. L., Mostoufi, S. M., Ready, C. B., Street, A. E., Griffin, M. G., & Resick, P. A. (2011). Trauma reactivity, avoidant coping, and PTSD symptoms: A moderating relationship? Journal of Abnormal Psychology, 120(1), 240–246. https://doi.org/10.1037/a0022123
- Sanson, M., Strange, D., & Garry, M. (2019). Trigger warnings are trivially helpful at reducing negative affect, intrusive thoughts, and avoidance. Clinical Psychological Science, 7(4), 778–793. https://doi.org/10.1177/2167702619827018
- Schönbrodt, F. D., & Perugini, M. (2013). At what sample size do correlations stabilize? Journal of Research in Personality, 47(5), 609–612. https://doi.org/10.1016/j.jrp.2013.05.009
- Schönbrodt, F. D., & Perugini, M. (2018). “At what sample size do correlations stabilize?” Corrigendum. Journal of Research in Personality, 74, 194. https://doi.org/10.1016/j.jrp.2018.02.010
- Shilton, A. L., Laycock, R., & Crewther, S. G. (2017). The Maastricht Acute Stress Test (MAST): Physiological and subjective responses in anticipation, and post-stress. Frontiers in Psychology, 8(567), 1–10. https://doi.org/10.1080/09658211.2021.1955925
- Simister, E. T., Bridgland, V. M. E., & Takarangi, M. K. T. (2023). To look or not to look: Instagram’s sensitive screens do not deter vulnerable people from viewing negative content. Behavior Therapy. Advance online publication. https://doi.org/10.1016/j.beth.2023.06.001
- Simister, E. T., Bridgland, V. M. E., Williamson, P., & Takarangi, M. K. T. (2023). Mind the information-gap: Instagram’s sensitive-content screens are more likely to deter people from viewing potentially distressing content when they provide information about the content. Media Psychology. Advance online publication. https://doi.org/10.1080/15213269.2023.2211774
- Spacapan, S., & Cohen, S. (1983). Effects and aftereffects of stressor expectations. Journal of Personality and Social Psychology, 45(6), 1243–1254. https://doi.org/10.1037/0022-3514.45.6.1243
- Stirling, N. S., Nixon, R. D., & Takarangi, M. K. (2022). No more than discomfort: The trauma film paradigm meets definitions of minimal-risk research. Ethics & Behavior, 1–17. https://doi.org/10.1080/10508422.2021.1997603
- Sweeny, K., Reynolds, C., Falkenstein, A., Andrews, S., & Dooley, M. (2015). Two definitions of waiting well. Emotion, 16(1), 129–143. https://doi.org/10.1037/emo0000117
- Thompson, R. R., Jones, N. M., Holman, E. A., & Silver, R. C. (2019). Media exposure to mass violence events can fuel a cycle of distress. Science Advances, 5. https://doi.org/10.1126/sciadv.aav3502
- Tovilovic, S., Novovic, Z., Mihic, L., & Jovanovic, V. (2009). The role of trait anxiety in induction of state anxiety. Psihologija, 42(4), 491–504. https://doi.org/10.2298/psi0904491t
- Watson, D., Clark, L. A., & Tellegen, A. (1988). Development and validation of brief measures of positive and negative affect: The PANAS scales. Journal of Personality and Social Psychology, 54(6), 1063–1070. https://doi.org/10.1037/0022-3514.54.6.1063
- Wetzels, R., Matzke, D., Lee, M. D., Rouder, J. N., Iverson, G. J., & Wagenmakers, E. J. (2011). Statistical evidence in experimental psychology: An empirical comparison using 855 t tests. Perspectives on Psychological Science, 6(3), 291–298. https://doi.org/10.1177/1745691611406923
- Wolgast, M., Lundh, L. G., & Viborg, G. (2011). Cognitive reappraisal and acceptance: An experimental comparison of two emotion regulation strategies. Behaviour Research and Therapy, 49(12), 858–866. https://doi.org/10.1016/j.brat.2011.09.011