
Abstract
The ontogenetic diet shift to piscivory can be energetically beneficial for fish growth and allows larger, more energetically profitable prey to be consumed. A shift to piscivory may be easier for longer individuals within a cohort due to larger gape size, and an early shift is likely advantageous, potentially leading to increased growth rates and survival. Such length-dependent ontogenetic diet shifts may explain the intracohort variability in length that is common for age-0 walleye (Sander vitreus). The objectives of this study were to describe seasonal intracohort variability in length, identify the timing of the shift to piscivory and determine if the onset of piscivory was length-dependent in age-0 walleye. Walleye initially fed on zooplankton, but shifted to piscivory during July of 2010 and June of 2011. The onset of piscivory in age-0 walleye was associated with length-dependent differences during both years, in which longer individuals within the cohort became piscivorous earlier than shorter individuals within the same cohort. Intracohort variability in length was detected and increased postontogenetic diet shift. Age-0 walleye that experience a growth advantage could benefit from increased survival and feeding opportunities.
Introduction
Several ontogenetic diet shifts commonly occur during fishes first year of life as endogenous feeding on yolk shifts to exogenous feeding on zooplankton, other invertebrates, and fish. The ontogenetic diet shift to piscivory can be energetically beneficial for fish development and allows larger, more energetically profitable prey to be consumed (Galarowicz and Wahl Citation2005). The shift to piscivory generally occurs once the predator’s gape is large enough to allow for the consumption of fish (Bremigan and Stein Citation1994) or when piscivory becomes energetically advantageous (Galarowicz and Wahl Citation2005; Graeb et al. Citation2006). Piscivory may provide a more stoichiometrically balanced diet, providing essential nutrients that increase assimilation of all other nutrients and increase growth rates (McIntyre and Flecker Citation2010). Though the shift to piscivory is known to provide an energetic advantage, the mechanisms that control the onset of piscivory are not fully understood.
Variability in the timing of the shift to piscivory among species is common (Mittelbach and Persson Citation1998) and has been attributed to differences in feeding behavior, morphology, and life-history patterns (Graeb et al. Citation2005). Within a population, variability in length can lead to individual differences in the timing of ontogenetic diet shifts (Vander Zanden et al. Citation1998; Post Citation2003; Yasuno et al. Citation2012). Early hatched age-0 largemouth bass (Micropterus salmoides) were longer and became piscivorous earlier than late hatched members of the same cohort (Post Citation2003; Yasuno et al. Citation2012). Furthermore, after shifting to piscivory, earlier hatched largemouth bass experienced significantly faster growth rates compared to bass hatched later (Post Citation2003). While age-0 walleye (Sander vitreus) have been found to shift to piscivory at anywhere from 10 to 100 mm (Walker and Applegate Citation1976; Li and Ayles Citation1981; Mathias and Li Citation1982; Schademann Citation1987; Johnson et al. Citation1988), questions remain as to whether this transition is length-dependent.
Initial intracohort variability in length of age-0 walleye can occur in both naturally reproducing and stocked populations (Roseman Citation1997; Quist et al. Citation2004), likely because of variability in egg characteristics (Moodie et al. Citation1989) and hatch dates (Mion et al. Citation1998; Katt et al. Citation2011). Resultant small, initial differences in length may lead to differences in the timing of ontogenetic diet shifts. We hypothesized that these initial differences in length within a cohort of age-0 walleye would influence food habits, the timing of the onset of piscivory, and intracohort variability in length. The objectives of this study were to (1) describe seasonal intracohort variability in length, (2) identify the timing of the shift to piscivory, and (3) determine if the timing of the shift to piscivory is length-dependent for age-0 walleye in Harlan County Reservoir.
Materials and methods
Study site
Harlan County Reservoir is located in south-central Nebraska and is primarily used for irrigation, flood control, and recreation. The reservoir was constructed between 1947 and 1952 and is owned and operated by the U.S. Army Corp of Engineers. Harlan County Reservoir receives direct inflow from the Republican River. At conservation pool the reservoir is approximately 5,362 surface hectares with a mean depth of 4 m and a maximum depth of 18 m (USBR 2010). Long fetch and prevailing high winds allow only weak thermal stratification during summer (Olds et al. Citation2011). As with many irrigation reservoirs, frequent water-level fluctuations in Harlan County Reservoir create a dynamic environment but zooplankton are spatially homogenous throughout the reservoir (Maline et al. Citation2011). The reservoir is classified as eutrophic to hypereutrophic based on the trophic state index (Carlson Citation1977; Olds et al. Citation2011). The Nebraska Game and Parks Commission manages the fishery primarily for walleye and white bass (Morone chrysops), but other popular sport fishes include black crappie (Pomoxis nigromaculatus), channel catfish (Ictalurus punctatus), and white crappie (Pomoxis annularis). Gizzard shad (Dorosoma cepedianum) is the most abundant prey fish in this reservoir (Olson et al. Citation2007; Sullivan et al. Citation2011). The walleye population in Harlan County Reservoir is largely supported by stocking walleye fry (OTC marks corrected for false positives averaged 91% [SE = 2.2%] over 7 years; Uphoff Citation2012; Woiak Citation2014; Miller Citation2017) which occurred during both years of this study.
Recent concerns related to variable recruitment of walleye within Harlan County Reservoir have led to the investigation of possible factors influencing these intracohort length differences. A better understanding of intracohort variability in length and timing of the onset of piscivory may identify factors that limit walleye recruitment in this reservoir. Observations of age-0 walleye from Harlan County Reservoir reveal initial (preshift to piscivory) differences in length that may lead to intracohort variability in length at the onset of piscivory and subsequent increased difference in growth rates within a cohort; however, empirical evidence to support this premise for walleye is currently lacking.
Fish sampling
Age-0 walleye were sampled during 9 periods from 10 May (approximately two weeks after walleye fry stocking) through 16 November 2010 and during six periods from 16 May through 11 October 2011. Gears used to collect age-0 walleye included push nets in May, seines in June, and bottom trawls, gill nets, and a boat electrofisher (July through October). Push nets consisted of two icthyoplankton nets mounted to the front of a boat with a metal frame so that the top of each net was just below the water surface during sampling at a speed of 0.5 m/s. Each icthyoplankton net was circular with the larger net having a diameter of 1.0 m (1.8-mm mesh) and the smaller net having a diameter of 0.5 m (0.75-mm mesh). Bag seines were 15.25 m long and consisted of 0.63-cm bar-mesh netting. Bottom trawls were 4.88-m wide and consisted of 1.27-cm bar-mesh netting throughout with a 0.63-cm bar-mesh cod-end liner. Experimental monofilament gill nets (1.83 × 60.96 m) consisted of two equal sized 30.48-m complements of 1.27- and 1.90-cm bar mesh. The boat electrofisher was a Smith-Root model SR-16S and target output was 5–8 A of pulsed-DC current at 100–200 V (Schoenebeck et al. Citation2015). All sampled fish were immediately placed on ice, measured (total length [mm]) and weighed (g) at the laboratory, and then dissected to remove the otoliths and viscera. Age was assigned based on fish length and was verified by reading whole-view and cracked otoliths under a dissecting microscope.
Gut-content analysis
The viscera were removed from age-0 walleye and placed in a 4% formalin solution. Stomach contents of age-0 walleye were enumerated and weighed in the laboratory. The timing of the shift to piscivory was identified using a combination of the presence of piscivorous fish (defined as having fish in the diet) and the percent of fish stomach contents by weight and the mean lengths of piscivorous and nonpiscivorous age-0 walleye during the transitional periods of 2010 and 2011 were compared. Lengths of piscivorous and nonpiscivorous walleye from July 2010 were compared using a t-test assuming equal variances and lengths from June 2011 were compared using a Mann–Whitney U test because the data were nonparametric and variances were unequal. We also used logistic regression to predict the length of the shift to piscivory for each year.
Results
Intracohort variability in length increased throughout the growing season during both years of the study (). Totals of 211 and 182 age-0 walleye were examined for gut-content analysis during 2010 and 2011, respectively, and food habits of age-0 walleye were similar between years ( and ). During both years, exogenously feeding age-0 walleye were initially zooplanktivorous (largely Calanoid Copepods) and macroinvertebrates were only a minor component of the diet prior to walleye shifting to piscivory in which gizzard shad were the dominant item consumed ( and ). The onset of piscivory for age-0 walleye occurred between 14 June and 6 July 2010 which saw an increase in the percent of piscivorous fish from 6% (1 fish) to 69% of fish and an increase of the stomach contents by weight from 12.6% to 97.8% (). The onset of piscivory occurred between 20 May and 16 June 2011 which saw an increase in the percent of piscivorous fish from 0% to 33% and an increase of the stomach contents by weight from 0.0% to 85.4% (). Therefore, individual diets and respective lengths of age-0 walleye collected on 6 July 2010 and 16–25 June 2011 were used to investigate if the shift to piscivory was length dependent.
Figure 1. Mean length by month (solid line) plus/minus two times the monthly sample standard deviation (dashed line) for age-0 walleye collected from Harlan County Reservoir, Nebraska during 2010 and 2011.
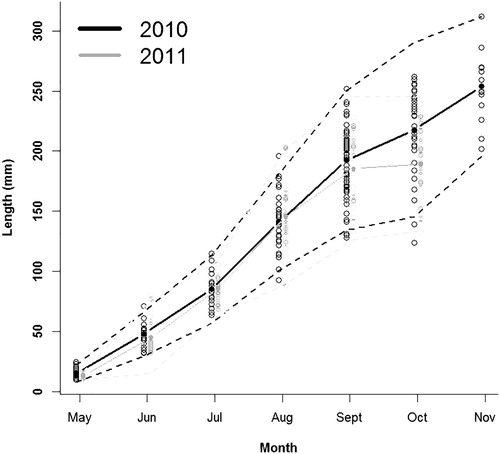
Figure 2. Percentage of piscivorous and nonpiscivorous age-0 walleye for each sampling period during 2010 and 2011 from Harlan County Reservoir, Nebraska. Walleye with empty stomachs were not included.
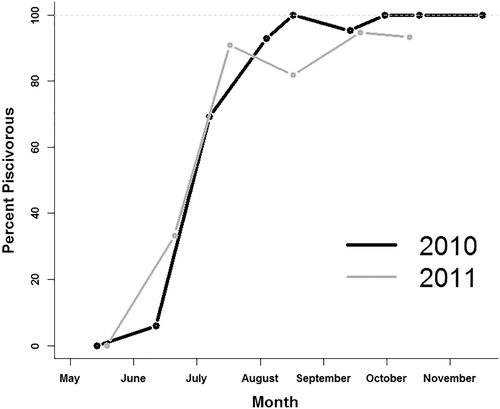
Table 1. Mean percent composition by weight for stomach contents from age-0 walleye in Harlan County Reservoir, Nebraska, during May through November 2010.
Table 2. Mean percent composition by weight for stomach contents from age-0 walleye in Harlan County Reservoir, Nebraska, during May through October 2011.
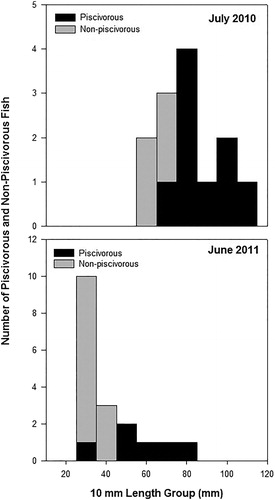
Age-0 walleye displayed a length-dependent diet shift to piscivory during 2010 and 2011 as longer age-0 walleye shifted to piscivory earlier than shorter age-0 walleye (). Piscivorous age-0 walleye (mean TL ± SE = 93 ± 4.2) were longer (t-stat = 3.42, df = 11, P = 0.002) than nonpiscivorous members of their cohort (mean TL ± SE = 70 ± 3.2) during 2010. The same relationship was true during 2011 when the mean length of piscivorous age-0 walleye (mean TL ± SE = 61 ± 6.0) was greater (Mann–Whitney U = 11.5, df =17, P = 0.011) than the mean length of nonpiscivorous age-0 walleye (mean TL ± SE = 37 ± 1.2). The predicted length of age-0 walleye at the shift to piscivory was 77 mm in 2010 and 47 mm in 2011 (). In subsequent sampling events following these periods of shift fish made up greater than 98% of the diet by weight. Therefore, while the onset of piscivory was initially length-dependent, eventually all lengths of age-0 walleye became piscivorous.
Figure 3. Length frequency distribution of piscivorous and nonpiscivorous age-0 walleye during July 2010 and June 2011 from Harlan County Reservoir, Nebraska.
Discussion
Age-0 walleye food habits are an important component in understanding possible biotic limitations to their growth and survival. Age-0 walleye followed a similar ontogenetic diet shift pattern during both years of this study, shifting from zooplankton to piscivory during June and July and then consuming mostly fish during the rest of the sampling season. Several studies have illustrated macroinvertebrates as an intermediate prey type between zooplankton and fish (Mathias and Li Citation1982; Galarowicz and Wahl Citation2005); however, the importance of macroinvertebrates to the diet of age-0 walleye in Harlan County Reservoir was low, as it was in several South Dakota systems (Jackson et al. Citation1992; Beck et al. Citation1998). Availability of more energetically profitable prey can reduce consumption of less profitable prey (Galarowicz et al. Citation2006). Age-0 walleye may not utilize an intermediate prey type between zooplankton and fish in this system because of the fast growth rates of age-0 walleye (Schumann et al. Citation2018) and the availability of gizzard shad (Sullivan et al. Citation2011; Miller et al. Citation2018).
This study demonstrates the onset of piscivory within a cohort of age-0 walleye can be length-dependent. Expectations were that early differences in age-0 walleye length would allow the longer fish in a cohort to shift to piscivory sooner than the shorter fish of that cohort due to gape limitations. Initial intracohort variability in length occurred in Harlan County Reservoir, as it has in other stocked and naturally reproducing walleye populations (Roseman Citation1997; Quist et al. Citation2004). Both population types can experience initial intracohort variability in length due to differences in hatch date of larval walleye. For example, walleye fry stocking in Harlan County Reservoir occurred over a 12 day period in 2011 and walleye hatching was observed over a four week period in tributaries to Lake Erie (Mion et al. Citation1998). Similar to age-0 largemouth bass (Post Citation2003; Yasuno et al. Citation2012), initial intracohort variability in length of age-0 walleye resulted in intracohort differences in the onset of piscivory, with longer walleye within the cohort shifting to piscivory earlier than shorter walleye within the cohort. However, length-dependent differences in diet did not persist as all lengths of age-0 walleye eventually shifted to piscivory. The length threshold between piscivorous and nonpiscivorous age-0 walleye was around 77 mm in 2010 and 47 mm in 2011, which is among reported lengths of age-0 walleye shifting to piscivory in previous studies (Walker and Applegate Citation1976; Li and Ayles Citation1981; Mathias and Li Citation1982; Schademann Citation1987; Johnson et al. Citation1988). Although the shift to piscivory was length-dependent within each year’s cohort, the difference in the lengths at which the shift to piscivory occurred was different among years suggesting walleye can shift to piscivory at a range of lengths instead of a set length threshold that needs to be achieved. This may also suggest other factors may be more responsible for the time of the shift such as the density of appropriately sized prey (e.g. age-0 gizzard shad). The peak abundance of larval gizzard shad in Harlan County Reservoir has historically varied annually over the past 12 years from late May to late June and (Sullivan et al. Citation2011; Miller et al. Citation2018). Interestingly, the week of peak larval gizzard shad density fell within the window of the observed shift to piscivory during both 2010 (14 June) and 2011 (10 June) suggesting the availability of prey is important to the timing of the shift for age-0 walleye. Both years had relatively low peak larval shad densities (1.0 larval shad per m3, SE = 0.2 in 2010 and 1.7, SE = 0.7 in 2011) compared to the 12-year average of 2.4 larval gizzard shad per m3 (SE = 0.5). The average length of available larval gizzard shad was (16.17 mm, SE = 0.05 in 2010 and 12.25 mm, SE = 0.03 in 2011). Given the timing of peak larval shad abundance matched the timing of the walleye shift to piscivory, we postulate that the peak of larval gizzard shad density could be a determining factor in the shift to piscivory for age-0 walleye in similar systems with similar prey base.
The timing of ontogenetic diet shifts of age-0 walleye may likely be different during years of slower growth or in other populations that exhibit slower growth. Mean total length of age-0 walleye by October 2010 (208 mm) and 2011(191 mm) was near average (198 mm) for Harlan County Reservoir (Uphoff et al. Citation2013). In past years, average length of age-0 walleye in Harlan County Reservoir has been as short as 129 mm in October (Uphoff et al. Citation2013). Average length of age-0 walleye caught during fall electrofishing from 10 eastern South Dakota lakes ranged from 134 to 197 mm (Schall et al. Citation2015) and average lengths of age-0 walleye caught during October in Minnesota lakes were as small as 99 mm (Borkholder and Parsons Citation2001). In some of these situations, shorter, slower growing walleye would likely have fewer prey fish available due to gape limitations. While fast growth allows the cohort to quickly shift to piscivory, slower growth may increase the length of time it takes for the cohort to shift. If only larger prey fish are available, and length-dependent onset of piscivory occurs, shorter age-0 walleye may not become piscivorous within the first growing season. Intracohort variability in length for age-0 fish can lead to immediate and future life-history consequences. For example, age-0 walleye that experience an early growth advantage could benefit from increased survival and feeding opportunities. Conversely, slower growing individuals would be more susceptible to predation (Miller et al. Citation1988; Post et al. Citation1998) and are less likely to survive periods of starvation (Post et al. Citation1998; Biro et al. Citation2004).
Acknowledgments
We thank three reviewers whose comments improved the manuscript. We thank the Nebraska Game and Parks Commission for the use of equipment. We thank the U.S. Army Corp of Engineers at Harlan County Reservoir for equipment storage. We thank the University of Nebraska at Kearney for their technical support and B. Peterson, J. Kreitman, E. Smits, and others who assisted with this project. We thank D. Staples and B. Miller for statistical consultation and graphics.
Disclosure statement
No potential conflict of interest was reported by the authors.
Funding
This project was funded by Federal Aid in Sport Fish Restoration funds (Project F-160-R-8) administered by the Nebraska Game and Parks Commission. This study was performed under the auspices of the University of Nebraska at Kearney Institutional Animal Care and Use Committee (protocol # 041410). Any use of trade, firm, or product names is for descriptive purposes only and does not imply endorsement by the U.S. Government. The Nebraska Cooperative Fish and Wildlife Research Unit is jointly supported by a cooperative agreement among the U.S. Geological Survey, the Nebraska Game and Parks Commission, the University of Nebraska, the U.S. Fish and Wildlife Service, and the Wildlife Management Institute.
References
- Beck HD, Starostka AB, Willis DW. 1998. Diet overlap of age-0 walleye and white bass in Lake Poinsett, South Dakota. J Freshwater Ecol. 13(4):425–431.
- Biro PA, Morton AE, Post JR, Parkinson EA. 2004. Over-winter lipid depletion and mortality of age-0 rainbow trout (Oncorhynchus mykiss). Can J Fish Aquat Sci. 61(8):1513–1519.
- Borkholder BD, Parsons BG. 2001. Relationship between electrofishing catch rates of age-0 walleyes and water temperature in Minnesota lakes. North Am J Fish Manag. 21(2):318–325.
- Bremigan MT, Stein RA. 1994. Gape-dependent larval foraging and zooplankton size: implications for fish recruitment across systems. Can J Fish Aquat Sci. 51(4):913–922.
- Carlson RE. 1977. A trophic state index for lakes. Limnol Oceanogr. 22(2):361–369.
- Galarowicz TL, Adams JA, Wahl DH. 2006. The influence of prey availability on ontogenetic diet shifts of a juvenile piscivore. Can J Fish Aquat Sci. 63(8):1722–1733.
- Galarowicz TL, Wahl DH. 2005. Foraging by a young-of-year piscivore: the role of predator size, prey type, and density. Can J Fish Aquat Sci. 62(10):2330–2342.
- Graeb BDS, Galarowicz TL, Wahl DH, Dettmers JM, Simpson MJ. 2005. Foraging behavior, morphology, and life history variation determine the ontogeny of piscivory in two closely related predators. Can J Fish Aquat Sci. 62(9):2010–2020.
- Graeb BDS, Mangan MT, Jolley JC, Wahl DH, Dettmers JD. 2006. Ontogenetic changes in prey preference and foraging ability of yellow perch: insights based on relative energetic return of prey. Trans Am Fish Soc. 135(6):1493–1498.
- Jackson JJ, Willis DW, Fielder DG. 1992. Food habits of young-of-the-year walleyes in Okobojo Bay of Lake Oahe, South Dakota. J Freshwater Ecol. 7(3):329–341.
- Johnson BL, Smith DL, Carline RF. 1988. Habitat preferences, survival, growth, foods, and harvests of walleyes and walleye × sauger hybrids. North Am J Fish Manag. 8(3):292–304.
- Katt JD, Peterson BC, Koupal KD, Schoenebeck CW, Hoback WW. 2011. Changes in relative abundance of adult walleye and egg density following the addition of walleye spawning habitat in a Midwest irrigation reservoir. J Freshwater Ecol. 26(1):51–58.
- Li S, Ayles GB. 1981. Preliminary experiments on growth, survival, production and interspecific interactions of walleye (Stizostedion vitreum vitreum) fingerlings in constructed earthen ponds in the Canadian prairies. Can Tech Rep Fish Aquat Sci. 1041.
- Maline KM, Koupal KD, Peterson BC, Hoback WW. 2011. Distribution of zooplankton in Harlan County Reservoir. Trans Neb Acad Sci. 32:78–82.
- Mathias JA, Li S. 1982. Feeding habits of walleye larvae and juveniles: comparative laboratory and field studies. Trans Am Fish Soc. 111(6):722–735.
- McIntyre PB, Flecker AS. 2010. Ecological stoichiometry as an integrative framework in stream fish ecology. In: Gido KB, Jackson DA, editors. Community ecology of stream fishes: concepts, approaches, and techniques. Bethesda (MD): American Fisheries Society, Symposium Series 73; p. 539–558.
- Miller BT. 2017. A proposed standardized sampling approach for juvenile Walleye Sander vitreus and White Bass Morone chrysops [thesis]. Kearney (NE): University of Nebraska at Kearney.
- Miller BT, Peterson BC, Koupal KD, Schoenebeck CW. 2018. Long-term changes in biotic and abiotic factors influence larval gizzard shad (Dorosoma cepedianum) annual peak density. J Freshwater Ecol. 33(1):173–181.
- Miller TJ, Crowder LB, Rice JA, Marschall EA. 1988. Larval size and recruitment mechanisms in fishes: toward a conceptual-framework. Can J Fish Aquat Sci. 45(9):1657–1670.
- Mion JB, Stein RA, Marschall EA. 1998. River discharge drives survival of larval walleye. Ecol Appl. 8:88–103.
- Mittelbach GG, Persson L. 1998. The ontogeny of piscivory and its ecological consequences. Can J Fish Aquat Sci. 55:1451–1465.
- Moodie GEE, Loadman NL, Wiegand MD, Mathias JA. 1989. Influence of egg characteristics on survival, growth and feeding in larval walleye (Stizostedion vitreum). Can J Fish Aquat Sci. 46(3):516–521.
- Olds BP, Peterson BC, Koupal KD, Farnsworth-Hoback KM, Schoenebeck CW, Hoback WW. 2011. Water quality parameters of a Nebraska reservoir differ between drought and normal conditions. Lake Reserv Manag. 27(3):229–234.
- Olson NW, Guy CS, Koupal KD. 2007. Interactions among three top-level predators in a polymictic Great Plains reservoir. North Am J Fish Manag. 27(1):268–278.
- Post DM. 2003. Individual variation in the timing of ontogenetic niche shifts in largemouth bass. Ecology. 84:1298–1310.
- Post DM, Kitchell JF, Hodgson JR. 1998. Interactions among adult demography, spawning date, growth rate, predation, overwinter mortality, and the recruitment of largemouth bass in a northern lake. Can J Fish Aquat Sci. 55(12):2588–2600.
- Quist MC, Guy CS, Bernot RJ, Stephen JL. 2004. Factors related to growth and survival of larval walleyes: implications for recruitment in a southern Great Plains reservoir. Fish Res. 67(2):215–225.
- Roseman EF. 1997. Factors influencing the year-class strength of reef-spawned walleye in western Lake Erie [M.S. thesis]. East Lansing (MI): Michigan State University, 140 pp.
- Schademann R. 1987. Food habits, growth, and distribution of walleye in Clinton Reservoir, Kansas [master’s thesis]. Lawrence (KS): University of Kansas.
- Schall BJ, Phayvanh MJ, Grote JD, Dembkowski DJ, Wuellner MR. 2015. Food habits of fall-collected age-0 Walleyes in Eastern South Dakota glacial lakes. Prairie Natr. 47:41–44.
- Schoenebeck CW, Lundgren SA, Koupal KD. 2015. Using electrofishing catch rates to estimate the density of Largemouth Bass. North Am J Fish Manag. 35(2):331–336.
- Schumann DA, Uphoff CS, Schoenebeck CW, Graeb KNB. 2018. Incorporation of carbon and nitrogen isotopes in age-0 walleye (Sander vitreus) tissues following a laboratory diet switch experiment. Can J Fish Aquat Sci. 75(4):497–505.
- Sullivan CL, Schoenebeck CW, Koupal KD, Hoback WW, Peterson BC. 2011. Patterns of age-0 gizzard shad abundance and food habits in a Nebraska irrigation reservoir. Prairie Natr. 43:110–116.
- Uphoff CS. 2012. Seasonal food habits and variability in length of age-0 walleye in Harlan County Reservoir, Nebraska [thesis]. Kearney (NE): University of Nebraska at Kearney.
- Uphoff CS, Schoenebeck CW, Hoback WW, Koupal KD, Pope KL. 2013. Degree-day accumulation influences annual variability in growth of age-0 walleye. Fish Res. 147:394–398.
- [USBR] US Bureau of Reclamation. 2010. Harlan County Dam [cited 10 Feb 2010]. https://www.usbr.gov/gp-bin/arcweb_hcne.pl
- Vander Zanden MJ, Hulshof M, Ridgway MS, Rasmussen JB. 1998. Application of stable isotope techniques to trophic studies of age-0 smallmouth bass. Trans Am Fish Soc. 127(5):729–739.
- Walker RE, Applegate RL. 1976. Growth, food and possible ecological effects of young-of-the-year walleyes in a South Dakota prairie pothole. Prog Fish Cult. 38:217–220.
- Woiak Z. 2014. Energy dynamics of age-0 Walleye and seasonal zooplankton dynamics within Harlan County Reservoir, Nebraska [thesis]. Kearney (NE): University of Nebraska at Kearney.
- Yasuno N, Chiba Y, Shindo K, Fujimoto Y, Shimada T, Shikano S, Kikuchi E. 2012. Size-dependent ontogenetic diet shifts to piscivory documented from stable isotope analyses in an introduced population of largemouth bass. Environ Biol Fish. 93(2):255–266.