
Abstract
Microbes, as an important part of aquaculture ponds, can improve the recirculation of nutrients. This nearly 1-year-long study aimed to understand the factors and mechanisms that cause temporal changes in the concentration of microbiological indicators and nutrient concentration in the grass carp pond water of Chongqing Jiguan Aquaculture Limited. The study was comprised of five sampling campaigns, with samples spaced 2 months apart. Water temperature, dissolved oxygen and pH were measured in the field during sampling, and the concentration of nitrates, nitrites and phosphates were determined afterward in the laboratory. Subsequent analysis of 16s genome sequencing classified microorganisms into 32 phyla and 481 genera and revealed the core composition of the bacterial community for each season. Principal component analysis revealed that pathogens (Pseudomonas and Flavobacterium) are a significant negative correlation with water temperature and a positive correlation with ammonium concentration and dissolved oxygen. Bacillus and Streptomyces population size was negatively correlated with total phosphorus, while Lactobacillus and Bacteroides populations were positively correlated with water temperature and negatively correlated with ammonium salt. These findings reveal a significant relationship between microbial communities and the physicochemical parameters in aquaculture environments, providing a basis for further improving the aquaculture environment.
Introduction
Grass carp (Ctenopharyngodon idellus), one of four major Chinese carp, is widely cultured in China. These carp are distributed from the Pearl River in the south to the Heilongjiang River in the north. According to FAO statistics, the production of grass carp had reached more than 5.5 million tons in 2014 (FAO Citation2016), making it the most highly consumed freshwater fish worldwide. In recent years, accompanying highly intensive culture, many problems occurred in the grass carp culture environment, including disease outbreaks and water quality degradation.
Microorganisms are indispensable biological components in the culture environment. Microorganisms can promote the circulation of nutrients and flow of energy in the pond environment and play a decisive role in the functional characteristics and strength of the cultured ponds (Yannarell et al. Citation2003). With the growth and commercialization of aquaculture, some special microbial diseases pose a serious threat to fish, which deeply impacts the healthy development of the aquaculture industry (Rahman et al. Citation2010). Whereas almost all bacterial diseases of fish were caused by conditionally pathogenic bacteria, Aeromonas spp. are widespread in aquatic environments and commonly found in both fresh and salt water and the different species exhibit different pathogenicity (Schroers et al. Citation2009). Flavobacterium spp. can cause fish infections with symptoms that are similar to the characteristics of columnar disease, especially in the high temperature seasons, resulting in skin and gill necrosis, and even systemic infection (Flemming et al. Citation2007; Faisal et al. Citation2017). However, prokaryotes such as Bacillus, lactobacillus, saccharomycetes, and photosynthetic bacteria are generally considered the microorganisms which can produce many active amylase, lipase, protease, and other enzymes to improve feed utilization rate and thus promote the growth of cultured animals and/or improve the water quality of aquaculture (Wang and Xu Citation2006; Wang Citation2007; Zokaeifar et al. Citation2012).
The microbial composition in the water body is very complex and dependent on the water conditions. A 3-year study demonstrated that the physicochemical parameters of water quality is significantly correlated with the pathogenic bacteria and with seasonal changes (Lenart-Boron et al. Citation2016). And a decade-long research project indicated that the structure of bacterial communities in water is changed by repeatable seasonal patterns annually (Yan et al. Citation2017). This study explores the relationship between microbes and physicochemical parameters and provides information for efficient farming. So in this respect, the overall objective of this 1-year study was to track the temporal changes of the microbiological parameters and physicochemical parameters in a grass carp pond in Chongqing, China. A comprehensive study was conducted, (1) using 16s genome sequencing, to assess the seasonal variability of the structure of bacterial communities over the course of a year; and (2) using cluster analysis and principal component analysis (PCA) to establish the factors affecting the chemical and microbiological quality of water in the studied sites across seasonal changes.
Methods
Study site and sampling
Grass carp is an economically important aquaculture species that accounts for more than 18% of the total freshwater aquaculture production in China (CMA Citation2015). In this study, we selected a typical grass carp culture pond of Chongqing Jiguan Aquaculture Co., Ltd. (30°07′54″N, 106°20′47″E, Altitude 243 m). This pond is a rectangle shape (95 m in length and 55 m in width) and approximately 0.52 hectares in area and 2.5–3.0 m in depth. Five sampling sites (4 corner sites and 1 middle site) were selected at 9:00 am, 2 L of water from a depth of 15–20 cm at each sampling site was collected, mixed in sterile canisters, and stored at 4 °C for a maximum of 24 h before processing. Water temperature (WT), pH, and dissolved oxygen were measured at the same depth and the same locations. The sampling was performed five times during the year 2015, on April 12th, June 8th, August 15th, October 13th and December 17th.
Physical and chemical parameter detection
Parameters including WT, pH (Handheld pH meter, AZ8651), and dissolved oxygen (Dissolved oxygen meter, YSI 550A), were determined at the time of sampling. Other parameters including ammonia-nitrogen (Nessler reagent colorimetric method, GB 7479-1987), nitrate (Phenol disulfonic acid spectrophotometric method, GB/T 7480-1987), nitrite (spectrophotometric method, GB7493-87), phosphate (Extraction - phosphorus molybdenum blue colorimetric method, GB/T 9727-2007), total phosphorus (Ammonium molybdate spectrophotometric method, HJ636-2012), and total nitrogen (Alkaline persulfate digestion UV spectrophotometry, GB 11894-1989), were analyzed in the laboratory using the indicated methods.
Heterotrophic bacteria count
The number of heterotrophic bacteria in the aquaculture water was determined using a colony counting method. For each freshwater sample, aliquots used to measure heterotrophic bacteria abundance were prepared immediately after water sampling. Three 1-mL aliquots were diluted 10 times in PBS (pH 7.0), and 100 μl of each dilution was plated onto a nutrient agar (yeast extract 5 g, tryptone 10 g, NaCl 10 g, agarose 15–20 g, water 1000 mL) dish and incubated for 24 h at 37 °C. Data are reported as mean ± SE (n = 3).
DNA extraction, amplification and 16S rRNA sequencing
Two liters of water were prefiltered using a 20-μm mesh and were then filtered through 0.22 μm Sterivex filters (Millipore). The Sterivex filters were stored at −80 °C until DNA extraction. DNA was extracted using a QIAamp DNA stool Mini Kit (Qiagen) following the manufacturer’s recommendations, and stored at −20 °C. PCR amplifications were conducted for each sample to produce the V3 and V4 hypervariable regions (341F and 805R) of the 16S rRNA gene according to the previously described methods (Caporaso et al. Citation2011), and both primers contained a 6-bp error-correcting barcode unique to each sample. The sequencing was performed at Sangon Biotech (Shanghai) Co., Ltd., Shanghai, China.
Sequence analysis
FLASH software was used to merge pairs of reads from the original DNA fragments when the original DNA fragments were shorter than twice the length of the reads (Edgar Citation2013). Raw data were filtered using the open-source software system Quantitative Insights into Microbial Ecology (QIIME) quality filters (Caporaso et al. Citation2010). We used the UPARSE pipeline to pick operational taxonomic units (OTUs) at an identity threshold of 97%. We picked a representative sequence for each OTU and used the RDP classifier tool to assign taxonomic data to each representative sequence (Caporaso et al. Citation2011).
Statistical analysis
Statistical analysis was performed using SPSS 19.0 software, by calculating basic descriptive statistics and one-way ANOVAs to verify the significance of differences in the number of microbial indicators between the sampling sites in the study periods. Cluster analysis (CA) and PCA were used to determine the relationship between microbiological indicators and water quality parameters.
Results
Environmental characteristics of the water
The environmental characteristics of the sampling pond are listed in . During the sampling period, the pH value was weakly alkaline, ranging from pH 7.07 to pH 8.10. The water temperature (WT) changed seasonally, ranging from 10.3 °C (December) to 33.3 °C (June) and the dissolved oxygen (DO) changed over time from 4.23 mg/L (June) to 8.40 mg/L (December). The number of heterotrophic bacteria in the aquaculture water showed obvious seasonal changes, ranging from 4.3 (± 1.11) × 102 cfu/mL (April) to 2.3 (± 0.65) × 104 cfu/mL (August). The levels of nitrate, nitrite, nitrogen, and total phosphorus (TP) were lower in the summer season and higher in the winter season. These data suggest that the sampling pond should support aquaculture and that it is an ideal pond to research the relationship between bacterial index and the physicochemical parameters of the water.
Table 1. Physicochemical parameters of the water samples.
Microbial community composition
To characterize the microbial community structure of the aquaculture pond across the different seasons, high-throughput sequence analysis of bacterial hypervariable V3 and V4 regions of 16S rRNA was conducted on water samples taken from the aquaculture pond. As summarized in , a total of 172,108 quality-filtered sequences were obtained from five samples, ranging from 27,852 to 36,956 sequences per sample. These sequences were classified into 3,935 OTUs with over 97% sequence similarity, belonging to 32 phyla and 481 genera. The microbial complexity in the five samples was estimated on the basis of alpha-diversity (the OUT number, Chao1, and Shannon index) and they displayed distinct differences from each other (). The diversity was highest in August (25 phyla, 460 genera) and lowest in December (23 phyla, 164 genera), especially at the genus level. The most abundant taxa (more than 1% of the population) of bacteria at the phylum level are shown in . The common dominant phyla of the samples are Proteobacteria, Actinobacteria, Bacteroidetes and Planctomycetes. Interestingly, Verrucomicrobia were detected in all samples but the April sample, Firmicutes were detected only in the April and June samples, and Chloroflexi were detected only in the June sample.
Figure 1. Distribution of bacterial phyla and genera across different months. Using high-throughput sequencing, the distribution of bacteria at the phylum (A) and genus (B) levels were determined, the dominant species appearing at the phyla level for each month are Proteobacteria, Actinobacteria, Bacteroidetes, Planctomycetes, Verrucomicrobia, Firmicutes and Chloroflexi. The distribution of bacteria at the genus level varied greatly among each of the monitored months.
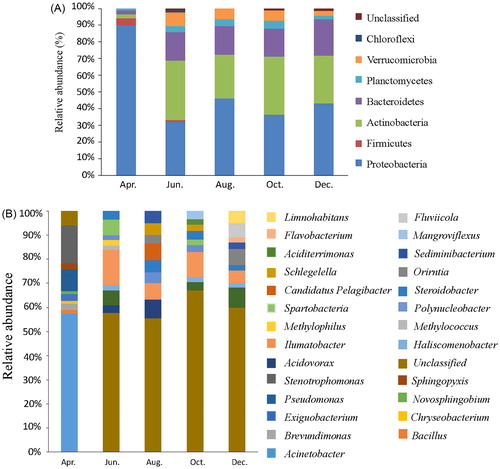
Table 2. Diversity indexes in the examined samples.
While the dominant genus varied among samples, as shown in , the most distinctive feature of this analysis is that the unclassified bacteria comprised a high percentage of the bacteria in the samples, 5.2, 43.36, 34.91, 50.18 and 48.34% in the April, June, August, October and December samples, respectively. The major detected genera (over 1% of the population) are summarized below: Acinetobacter (50.12%), Stenotrophomonas (13.9%), Pseudomonas (7.9%), Exiguobacterium (2.39%), Brevundimonas (2.24%), Sphingopyxis (2.02%), Bacillus (1.28%), Novosphingobium (1.07%) and Chryseobacterium (1.06%) were the most abundant in the April sample; Ilumatobacter (10.99%), Spartobacteria (4.87%), Candidatus Pelagibacter (4.56%), Steroidobacter (2.76%), Acidovorax (2.38%), Methylophilus (1.75%), Haliscomenobacter (1.74%), Methylococcus (1.24%) in the June sample; Acidovorax (4.84%), Ilumatobacter (4.36%), Steroidobacter (3.18%), Sediminibacterium (3.18%), Schlegelella (3.05%), Polynucleobacter (2.79%) and Orientia (2.25%) in the August sample; Ilumatobacter (7.88%), Steroidobacter (2.66%), Mangroviflexus (2.6%), Candidatus Pelagibacter (2.54%), Polynucleobacter (2.08%), Schlegelella (1.98%), Spartobacteria (1.73%), Aciditerrimonas (1.67%), and Haliscomenobacter (1.56%) in the October sample; and Orientia (5.35%), Fluviicola (4.7%), Ilumatobacter (4.44%), Limnohabitans (4.15%), Candidatus Pelagibacter (2.54%), Sediminibacterium (2.28%), Steroidobacter (1.73%), Flavobacterium (1.68%) and Haliscominobacter (1.35%) in the December sample.
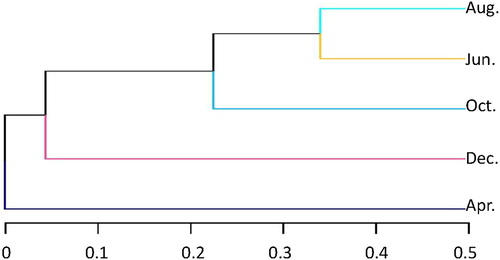
The results of the cluster analysis indicate that the microbial community composition in April has a strong dissimilarity from the other months (). The microbial community structure is the most similar in the June and August samples, followed by the similarity between the June and October samples.
Figure 2. Clustering analysis of each sampling month. The measured microbial community structure in April was largely different from the other months; June and August had the highest similarity in microbial community structure, followed by the similarity in June and October, while October and December were the least similar.
Multivariate analyses of the water samples
To probe the correlation between the abundance of bacteria and environmental factors, PCA was performed on a matrix to obtain principle components. Two pathogens (Pseudomonas and Flavobacterium) and seven probiotics (Bacillus, Streptococcus, Streptomyces, Lactococcus, Lactobacillus, Bdellovibrio and Bacteroides) were selected for the bacterial index. The first four components accounted for 50.7, 29.5, 12.0, and 7.8% of the total variance present in the original variables, respectively (). The significance of any factor is determined by eigenvalues that are greater than 0.6.
Table 3. Factor loadings for special microbiological and physicochemical parameters of the sampling site.
The first principal component (PC1) most clearly demonstrates the negative relationship between bacterial index and environmental factors. In particular, the concentration of pathogens (Pseudomonas and Flavobacterium) is negatively affected by water temperature, and the levels of environmental conditions (NO3-N, ammonium salts, and pH) are suppressed by probiotics (Lactobacillus and Bacteroides). The second principal component (PC2) also demonstrates the negative relationship between probiotics (Bacillus, Streptococcus, and Streptomyces) and the levels of environmental conditions (pH, DO and TP). The third principal component (PC3) shows the positive relationship between the content of Lactococcus and NO2-N concentration. These results suggested that the probiotics is very useful for aquaculture environment improvement, and it is very important for disease prevent in the cold season.
Discussion
In this article, genome sequencing was used to analyze the variance of microbial community structure over one year in a grass carp culture pond, and found that the dominant bacteria are Proteobacteria, Actinobacteria and Bacteroidetes. It has been reported that these dominant flora are common in other water bodies (Kirchman Citation2002; Warnecke et al. Citation2004), and Proteobacteria is the dominant bacteria group in various environments (Hugenholtz et al. Citation1998; O'Sullivan et al. Citation2002).
The number of heterotrophic bacteria in the aquaculture water undergoes significant seasonal changes; the most change occurred in August, followed by October, and the least in April and December. The number of heterotrophic bacteria in the water is affected by many factors, among which temperature has a great influence (Yan et al. Citation2014), and the higher water temperatures in summer are more suitable for bacterial growth. Heterotrophic bacteria play an important role in aquaculture, as it has been reported that the heterotrophic bacteria in aquaculture water account for approximately 80% of the total bacteria, far superior to the number of autotrophic bacteria (Hovanec and DeLong Citation1996). In addition, heterotrophic bacteria in water are sensitive to changes in nitrogen and other nutrient levels (Yoza et al. Citation2007). Although autotrophic bacteria account for a much smaller proportion of the culture system than heterotrophic bacteria, autotrophic bacteria still play an important role in the aquaculture ecosystem (Ebeling et al. Citation2006). For example, some denitrifying bacteria can convert nitrogen oxides (NO3− and NO2−) in water into gaseous nitrogen (N2) through gaseous intermediates (NO and N2O), thereby reducing nitrogen pollution in water (Harris et al. Citation2006; Oakley et al. Citation2007). Our study indicates different breeding environments lead to differences in microbial composition and quantity, and breeding environments may also include factors such as disease-resistant drugs and breeding density.
Microorganisms are the most abundant organisms in the breeding environment, both in number of species and in total quantity. There are a wide variety of microbes in nature, but only a handful of microorganisms have been identified and can be cultured in the laboratory. In this study, up to 50.18% of the microorganisms were unclassified in the October sample. Based on in situ and non-cultured microbial phylogenetic studies, 95–99% of the microbial population has not been isolated for culture and description, and only approximately 1% of microorganisms can be purely cultured or identified in natural samples (Muyzer et al. Citation1993; Amann et al. Citation1995; Martinez-Porchas and Vargas-Albores Citation2017). In the production of freshwater ponds, many microbes have a unique function for fishery production. Some are classified as probiotics, such as Bacillus and Lactobacillus, and in a certain concentration range can promote the health of an aquaculture system (Wang and Xu Citation2006; Zokaeifar et al. Citation2012), whereas others are classified as harmful bacteria or pathogens and are unfavorable to production, such as Flavobacterium, Pseudomonas and Aeromonas. Aeromonas are ubiquitous in aquaculture waters, but the number of them are too small to be directly unclassified during the sequencing process. Both probiotics and harmful bacteria were found in this study.
The composition of the microbial population in the breeding environment shows significant changes across the different seasons (Tang et al. Citation2014; Zhang et al. Citation2016; Fan et al. Citation2017). In aquaculture, outbreaks of aquatic animal diseases are often seasonal, and it is possible that seasonal outbreaks of diseases could be closely related to seasonal changes in microbial populations in aquaculture environments. In this study, microbiological diversity is low in seasons with low water temperatures (April and December), which may be a cause of the emergence of pathogens (Pseudomonas and Flavobacterium). Pseudomonas is a gram-negative brevibacterium, and causes ulcers, fin rot and tail rot in fish (Rahman et al. Citation2010). Flavobacterium can also infect fish, causing rotten gills, body ulcers and other symptoms (Wang et al. Citation2017). In other aquaculture systems, it has also been found that, of all the environmental factors, temperature is the main driving factor of the bacterial community (Tang et al. Citation2014). These data suggest that farmers must strengthen pond management and consider the timely adjustment of the microbial community structure to remove potential dangers in the cold season. Our PCA data indicate that the concentration and composition of the microbial community is highly related to water parameters, the concentration of pathogens is negatively related to water temperature, and probiotics are negatively correlated with the concentration of NO3-N, ammonium salts, and pH. These data suggest that in an aquaculture system, the concentration and composition of the microbial community can provide a profile of the water quality.
Notes on contributors
Jie Liu and Fuping Ma are the postgraduates in aquaculture, who now work in aquaculture ecology. Yanhong Li is an associate professor of Southwest University, who works in freshwater ecology.
Shengqi Su, Weizhi Yao, and Zhengli Wu are professors at Southwest University, who work in freshwater ecology.
Acknowledgements
The authors thank the Research Center of Fishery Resources and Environment of Southwest University.
Funding
This work was supported by National Natural Science Foundation of China (Grant No. 31770965 and 31600716), Chongqing Research Program of Basic Research and Frontier Technology (Grant No. cstc2017jcyjAX0420), and Fundamental Research Funds for the Central Universities (Grant No.: SWU114011, and SWU114015).
Disclosure statement
The authors declare no financial or commercial conflict of interest.
Reference
- Amann RI, Ludwig W, Schleifer KH. 1995. Phylogenetic identification and in situ detection of individual microbial cells without cultivation. Microbiol Rev. 59(1):143–169.
- Caporaso JG, Kuczynski J, Stombaugh J, Bittinger K, Bushman FD, Costello EK, Fierer N, Pena AG, Goodrich JK, Gordon JI, et al. 2010. QIIME allows analysis of high-throughput community sequencing data. Nat Methods. 7(5):335–336.
- Caporaso JG, Lauber CL, Walters WA, Berg-Lyons D, Lozupone CA, Turnbaugh PJ, Fierer N, Knight R. 2011. Global patterns of 16S rRNA diversity at a depth of millions of sequences per sample. Proc Natl Acad Sci USA. 108(Suppl 1):4516–4522.
- CMA. 2015. China's Ministry of Agriculture. China Fishery Statistical Year Book. China Beijing: Agriculture Press; p. 31–39
- Ebeling J, Timmons M, Bisogni J. 2006. Engineering analysis of the stoichiometry of photoautotrophic, autotrophic, and heterotrophic removal of ammonia-nitrogen in aquaculture systems. Aquaculture. 257(1-4):346–358.
- Edgar RC. 2013. UPARSE: highly accurate OTU sequences from microbial amplicon reads. Nat Methods. 10(10):996–998.
- Faisal M, Diamanka A, Loch TP, LaFrentz BR, Winters AD, Garcia JC, Toguebaye BS. 2017. Isolation and characterization of Flavobacterium columnare strains infecting fishes inhabiting the Laurentian Great Lakes basin. J Fish Dis. 40(5):637–648.
- Fan L, Barry K, Hu G, Meng S, Song C, Qiu L, Zheng Y, Wu W, Qu J, Chen J, Xu P. 2017. Characterizing bacterial communities in tilapia pond surface sediment and their responses to pond differences and temporal variations. World J Microbiol Biotechnol. 33:1.
- FAO 2016. Fishery and Aquaculture Statistics Yearbook., Vol. Aquaculture Production., Quebec: Food and Agriculture Organization of the United Nations.
- Flemming L, Rawlings D, Chenia H. 2007. Phenotypic and molecular characterisation of fish-borne Flavobacterium johnsoniae-like isolates from aquaculture systems in South Africa. Res Microbiol. 158(1):18–30.
- Harris R, Eady R, Hasnain S, Sawers R. 2006. Coordinate synthesis of azurin I and copper nitrite reductase in Alcaligenes xylosoxidans during denitrification. Arch Microbiol. 186(3):241–249.
- Hovanec TA, DeLong EF. 1996. Comparative analysis of nitrifying bacteria associated with freshwater and marine aquaria. Appl Environ Microb. 62:2888–2896.
- Hugenholtz P, Pitulle C, Hershberger KL, Pace NR. 1998. Novel division level bacterial diversity in a Yellowstone hot spring. J Bacteriol. 180(2):366–376.
- Kirchman DL. 2002. The ecology of Cytophaga-Flavobacteria in aquatic environments. Fems Microbiol Ecol. 39(2):91–100.
- Lenart-Boron A, Wolanin A, Jelonkiewicz L, Chmielewska-Blotnicka D, Zelazny M. 2016. Spatiotemporal variability in microbiological water quality of the Bialka river and its relation to the selected physicochemical parameters of water. Water Air Soil Pollut. 227:1–12.
- Martinez-Porchas M, Vargas-Albores F. 2017. Microbial metagenomics in aquaculture: a potential tool for a deeper insight into the activity. Rev Aquacult. 9:42–56.
- Muyzer G, Dewaal EC, Uitterlinden AG. 1993. Profiling of complex microbial-populations by denaturing gradient gel-electrophoresis analysis of polymerase chain reaction-amplified genes-coding for 16s ribosomal-RNA. Appl Environ Microb. 59:695–700.
- Oakley BB, Francis CA, Roberts KJ, Fuchsman CA, Srinivasan S, Staley JT. 2007. Analysis of nitrite reductase (nirK and nirS) genes and cultivation reveal depauperate community of denitrifying bacteria in the Black Sea suboxic zone. Environ Microbiol. 9(1):118–130.
- O'Sullivan LA, Weightman AJ, Fry JC. 2002. New degenerate cytophaga-flexibacter-bacteroides-specific 16S ribosomal DNA-targeted oligonucleotide probes reveal high bacterial diversity in River Taff epilithon. Appl Environ Microb. 68:201–210.
- Rahman M, Ferdowsy H, Kashem M, Foysal M. 2010. Tail and fin rot disease of Indian major carp and climbing perch in Bangladesh. J Biol Sci. 10:800–804.
- Schroers V, van der Marel M, Neuhaus H, Steinhagen D. 2009. Changes of intestinal mucus glycoproteins after peroral application of Aeromonas hydrophila to common carp (Cyprinus carpio). Aquaculture. 288(3-4):184–189.
- Tang YY, Tao PY, Tan JG, Mu HZ, Peng L, Yang DD, Tong SL, Chen LM. 2014. Identification of bacterial community composition in freshwater aquaculture system farming of Litopenaeus vannamei reveals distinct temperature-driven patterns. IJMS. 15(8):13663–13680.
- Wang GL, Wang MC, Zhang XW, Chang MX, Xie HX, Nie P. 2017. Molecular cloning, biological effect, and tissue distribution of interleukin-8 protein in mandarin fish (Siniperca chuasti) upon Flavobacterium columnare infection. Fish Shellfish Immun. 66:112–119.
- Wang YB. 2007. Effect of probiotics on growth performance and digestive enzyme activity of the shirmp Penaeus vannamei. Aquaculture. 269(1-4):259–264.
- Wang YB, Xu ZR. 2006. Effect of probiotics for common carp (Cyprinus carpio) based on growth performance and digestive enzyme activities. Anim Feed Sci Technol. 127:283–292.
- Warnecke F, Amann R, Pernthaler J. 2004. Actinobacterial 16S rRNA genes from freshwater habitats cluster in four distinct lineages. Environ Microbiol. 6(3):242–253.
- Yan FJ, Tian XL, Dong SL, Yang G. 2014. Seasonal variation of functional diversity of aquatic microbial community in Apostichopus japonicus cultural pond. Chin J Appl Ecol. 25:1499–1505.
- Yan QY, Stegen JC, Yu YH, Deng Y, Li XH, Wu S, Dai LL, Zhang X, Li JJ, Wang C, et al. 2017. Nearly a decade-long repeatable seasonal diversity patterns of bacterioplankton communities in the eutrophic Lake Donghu (Wuhan, China). Mol Ecol. 26(14):3839–3850.
- Yannarell AC, Kent AD, Lauster GH, Kratz TK, Triplett EW. 2003. Temporal patterns in bacterial communities in three temperate lakes of different trophic status. Microb Ecol. 46(4):391–405.
- Yoza BA, Harada RM, Nihous GC, Li QX, Masutani SM. 2007. Impact of mariculture on microbial diversity in sediments near open ocean farming of Polydactylus sexfilis. Ecol Indic. 7(1):108–122.
- Zhang H, Sun ZL, Liu B, Xuan YM, Jiang M, Pan YS, Zhang YM, Gong YP, Lu XP, Yu DS, et al. 2016. Dynamic changes of microbial communities in Litopenaeus vannamei cultures and the effects of environmental factors. Aquaculture. 455:97–108.
- Zokaeifar H, Balcazar JL, Saad CR, Kamarudin MS, Sijam K, Arshad A, Nejat N. 2012. Effects of Bacillus subtilis on the growth performance, digestive enzymes, immune gene expression and disease resistance of white shrimp, Litopenaeus vannamei. Fish Shellfish Immunol. 33(4):683–689.