
 ?Mathematical formulae have been encoded as MathML and are displayed in this HTML version using MathJax in order to improve their display. Uncheck the box to turn MathJax off. This feature requires Javascript. Click on a formula to zoom.
Abstract
Characterizing the structure of riverine fish populations that are patchily distributed and at low densities is often difficult. Due to the wide distribution but low abundance of Spotted Bass, Micropterus punctulatus, throughout the lower Wabash River (LWR), captures from fixed and random sampling designs were compared to assess their performance in determining relative abundance and size structure. The LWR is monitored using both sampling regimes—the Long Term Electrofishing Program monitors community assemblages uses a stratified-random sampling, whereas the Illinois Department of Natural Resources monitors the fish community using a fixed-sampling design. Mean CPUE was significantly higher for fixed site sampling compared to random sites. However, the size structure of Spotted Bass sampled by each design were similar. These results suggest random-sampling designs should be used when monitoring low density populations of fishes in large riverine systems because this method provides the greatest spatial coverage of habitats, evaluates heterogeneity in distribution, and provides a representative measure of abundance throughout an entire aquatic system. In situations where size distribution or temporal trends are the only goal, fixed site sampling would be sufficient.
Introduction
Throughout the Midwestern United States, large riverine systems contain some of the most diverse assemblages of fishes. Fish communities within the Illinois and Mississippi rivers each have more than 100 species of fish (Baker et al. Citation1991; Pegg and McClelland, Citation2004; Chick et al. Citation2006). These fisheries provide numerous recreational and commercial opportunities to anglers. For example, the Upper Mississippi River ecosystem provides more than 15,000 jobs and contributes more than $1 billion to local economies (Carlson et al. Citation1995; Sparks et al. Citation1998). Recently, increased harvest and environmental disturbances in these systems have warranted more intense management by many federal, state and private agencies (Sparks et al. Citation1990; Slipke et al. Citation2002). Due to limitations with time and funding, sampling designs are often not consistent among agencies. In general, fish monitoring projects either employ a fixed-sampling design or a random-sampling design. Comparing these two approaches is critical to evaluating fish stocks and to sharing information among agencies.
Due to the ability to equivalently sample all available habitats, random sampling is typically considered the most robust sampling design in aquatic ecosystems (Brown et al. Citation2012). Though differences in sampling protocols have been well studied in recent years, the results are not clear (King et al. Citation1981; Quist et al. Citation2006; Bonvechio et al. Citation2008; McClelland and Sass Citation2012; Patterson Citation2014). McClelland and Sass (Citation2012) found that the number of total captures, mean catch-per-unit-effort, species diversity and species evenness was greater for fixed sites compared to random sites in a large riverine system. However, evaluation of sampling designs of individual species have largely been limited to Largemouth Bass populations in Florida and Oklahoma reservoirs where abundances are high and conditions are stable (Bonvechio et al. Citation2008; Patterson Citation2014). To our knowledge, sampling design comparisons of a single species with heterogeneously distributed low abundance, where differences may be quite large, have yet to be evaluated.
In this paper, we assess characteristics of the Spotted Bass population in the lower Wabash River (LWR) using two different sampling designs. Specifically, we assess differences in population characteristics assessed by comparing (1) relative abundance and (2) size structure of the fixed sampling design and the stratified-random sampling design.
Materials and methods
Study area
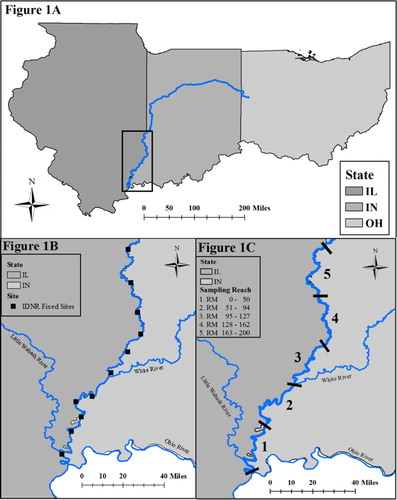
The Wabash River originates in northeast Ohio, flows across Indiana, and creates the eastern boundary of Illinois before it flows into the Ohio River (). The lower 764 km of the Wabash River is unimpounded making it the longest free flowing river east of the Mississippi River in the United States. Over the years, this system has undergone a limited number of human modifications making it one of the largest lotic systems that remains ecologically intact (Gammon Citation1998). The Wabash River is characterized by variable depths with distinct pools, riffles, and runs. The fish community within the Wabash River is dominated by the families Cyprinidae and Catostomidae with the sport fishery primarily composed of species from the families Acipenseridae, Catostomidae, Centrarchidae, Ictularidae and Sciaenidae (Gammon Citation1998; Pyron and Lauer Citation2004).
Figure 1. (A) Map of the Wabash River with the Illinois portion emphasized. (B) Map of the 11 Illinois Department of Natural Resources fixed stations throughout the LWR. (C) Map of the five sampling reaches for the Long Term Fish Population Monitoring Project on the LWR.
Sampling
The fish community was sampled annually from 2010 to 2015 throughout the LWR following two different electrofishing sampling designs. Both the fixed- and random- sampling designs used pulsed DC boat electrofishing (output: 60 Hz, 25% duty cycle) on main channel border habitats. Power output was based on a power goal of 3 kW which was derived from the water conductivity and water temperature at each site (Ratcliff et al. Citation2014). Each fixed site was sampled for a total of 60 continuous minutes (approximate distance 800 m) with two dippers, while each random site was sampled for 15 continuous minutes (approximate distance 200 m) with two dippers.
The fixed-sampling design sampled 11 sites ∼29 km apart spanning the LWR, for an annual effort of 11 h in each year (). Site locations were determined by the best suitable habitat accessible within the given reach of the river. Available fish habitat within each site was dominated by brush, logs, and stumps with a few sites containing rip rap, gravel, revetment and pile dikes. Sampling was dependent on water level but always occurred within the months of August and September.
The random-sampling design followed a stratified approach with five sampling reaches and three sampling periods (). Time period I occurred from June 15–July 31, time period II occurred from August 1–September 15 and time period III occurred from September 16–October 31. A total of 66 sites were sampled on an annual basis from 2010 to 2012 for an annual effort of 16.5 h. Beginning in 2013, 102 sites were sampled annually for an effort of 25.5 h per year. An equal number of sites were sampled in each reach during each of the three time periods. All site locations during each sampling were generated randomly using GIS. Habitat characteristics of some random sites were similar to fixed sites, but due to the random assignment of site locations many random sites were of poor quality (mud flats, sand bars, sites barren of coarse woody habitat).
Data analysis
All statistical analyses were performed on Spotted Bass captures in R 3.4.2 (R Core Team 2017). In order to have equal effort between designs, a random subsample of 44 random sites were selected each year. Relative abundance was quantified as catch-per-unit-effort (CPUE, fish/h) for each sampling design. CPUE was analyzed using a nonparametric Kruskal Wallis Test with sampling design as a factor. The temporal association between sampling designs was quantified with a Pearson product moment correlation to evaluate the equivalency of the two sampling designs during the six-year study period. This analysis used the mean CPUE for all sites sampled as the measure of population density for each sampling design and year.
The size structure of the Spotted Bass population was compared between sampling designs using length frequency histograms followed by a Kolmogorov–Smirnov test. We calculated the proportional size distribution (PSD = and relative size distribution for preferred length fish (PSD-P =
Neumann et al. Citation2012). PSD and PSD-P values were analyzed using a chi-squared test to determine whether values differed between sampling designs. To compare patterns within each size structure, proportion of individuals within each Gabelhouse (Citation1984) length category (Substock < 180 mm (SS), Stock 180–279 mm (S), Quality 280–349 mm (Q), Preferred > 350 mm (P)) were calculated and analyzed using a chi-squared test to determine if proportions differed between sampling designs.
Results
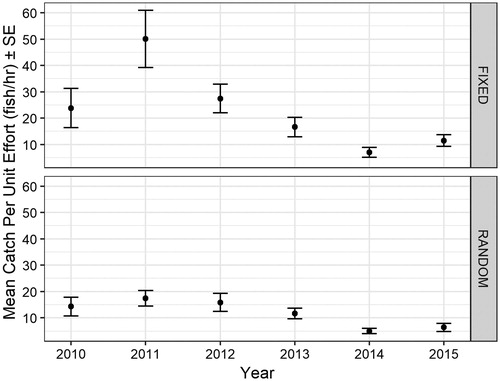
A total of 2,276 Spotted Bass were captured from the LWR between 2010 and 2015 from fixed and random sites. Mean CPUE was significantly higher for fixed sites (22.74 fish/h) compared to random sites (11.76 fish/h) over the six year sampling period (X2 = 29.3 df = 1 P < 0.001). Mean CPUE was higher for fixed sites compared to random sites for all sampling years (). Approximately 36% of random sites sampled had no spotted bass captures while only 2% of fixed sites (one sample) lacked this species. Mean CPUE was higher in both sampling protocols from 2010 to 2013 compared to 2014 and 2015 (). In 2014 and 2015, ∼45% of the random sites sampled contained no Spotted Bass, mostly during time period I. Despite this, a strong, positive correlation between annual mean CPUE for fixed sites with annual mean CPUE for random sites suggests that both sampling designs documented similar patterns in Spotted Bass abundance in the LWR (r = 0.95 P = 0.003).
Figure 2. Mean catch per unit effort (fish/h) ± SE of Spotted Bass captured in the LWR between 2010 and 2015 by sampling design. The top panel of the figure are CPUE rates for the fixed sampling design, while the bottom panel are CPUE rates for the stratified-random sampling design.
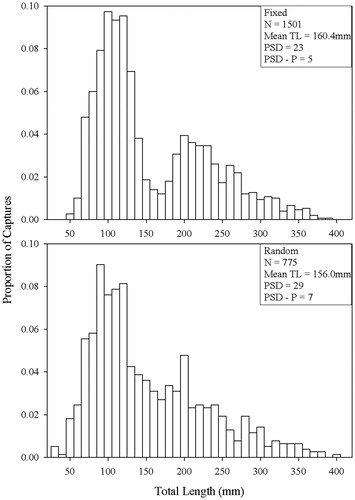
The size ranges of Spotted Bass collected from fixed (52–395 mm TL; mean 160.4, SE 1.90 mm TL), were nearly identical to random sites (30–401 mm; mean 156.0, SE 2.67 mm TL). Overall, length frequency histograms of Spotted Bass for each sampling design were not significantly different (K-S test, D = 0.06, df =1, P = 0.07). Both length frequency histograms were positively skewed with ∼90% of the total catch being < 280 mm TL (). Similarly, PSD and PSD – P values did not significantly differ between sampling designs (PSD: X2 = 0.69, df = 1, P = 0.41; PSD – P: X2 = 0.33, df = 1, P = 0.56). Proportions of individuals within each Gabelhouse length category [(SS-64.5%, S-26.5%, Q-7.5%, P1.5%)] were almost identical between sampling designs (X2 = 0.53, df = 3, P = 0.91).
Figure 3. Length frequency histograms of Spotted Bass captured in the LWR between 2010 and 2015 for each sampling design. Sample size (N), mean total length (TL) and PSD indices for each sampling design were included as well.
Discussion
Sampling design had a significant effect on the CPUE of Spotted Bass in the LWR. Mean CPUE of Spotted Bass was significantly higher for fixed sites than random sites across our study period, which is consistent with other studies comparing sampling designs (Quist et al. Citation2006; McClelland and Sass Citation2012). Higher Spotted Bass abundance at fixed sites is likely due to the subjective selection of higher overall quality habitat of fixed sites for many fish species, despite the sites not being specifically selected for Spotted Bass (McClelland and Sass Citation2012). The high number of random sites with a CPUE of 0 suggest that Spotted Bass are particular to specific habitats throughout the LWR and are therefore patchily distributed (Smith Citation2002), a population feature that the fixed sampling did not adequately capture.
However, the strong, positive correlation in the total annual catches of the two sampling designs suggests both designs documented the same temporal patterns in Spotted Bass abundance. While Spotted Bass abundance at fixed sites was likely not an accurate representation of the entire system, the decrease in abundance observed in both sampling designs in recent years was consistent. Significantly, lower mean abundance during 2014 and 2015 was likely due to high water affecting sampling throughout the sampling season of June to October. In time period 1 (June 15–July 31) of the 2015 LTEF sampling program, all sampling days were above action stage (3.35 m) with 39 of those days in flood stage (>5.79 m; USGS Citation2015). So, while the two sampling regimes are not directly comparable, sustained use of either should allow accurate assessment of temporal trends in fish population density.
Size metrics of Spotted Bass were not significantly different between sampling designs. Patterson (Citation2014) found similar patterns when sampling Largemouth Bass in Oklahoma reservoirs following fixed and random sampling designs. While he found significant change in length frequency histograms, overall size structures were similar between sampling designs (Patterson Citation2014). In our survey, the random sampling design was the only method that was able to sample Spotted Bass <50 mm and individuals >400 mm, but these differences are likely due to time of sampling. Overall, the two sampling designs generated the same size structure throughout the LWR and therefore represent equivalent methodologies to assess population structure
Based on this study, the choice of sampling design depends on the specific goals and resource limitations of the project. If resources are limited, a fixed-site sampling design may be appropriate for age and growth, mortality and size structure estimations of low density fishes in large riverine systems. This is particularly true when sites can be selected for an individual target species and monitored over an extended period. However, a fixed-site sampling design does not provide a representative, system-wide measure of species abundance and is not comparable to other sampling designs. Due to the subjective selection of higher quality habitat at fixed sites in this study, the heterogeneity of the target population was not documented which could present challenges when documenting population trends and changes in range. Overall, we recommend the use of random-sampling designs when monitoring low density fish populations in large riverine systems because this method provides the greatest spatial coverage of habitats, and provides a representative measure of abundance with statistical confidence.
Acknowledgments
We would like to thank all individuals who have helped work on this project past and present including members of the fisheries and aquatic research team at Eastern Illinois University, the Illinois Department of Natural Resources, and the Illinois Natural History Survey. The findings and conclusions in this article are those of the authors and do not necessarily represent the views of the U.S. Fish and Wildlife Service.
Disclosure statement
No potential conflict of interest was reported by the authors.
Additional information
Funding
Notes on contributors
Evan C. Boone
Evan C. Boone is a fisheries biologist with the U.S. Fish and Wildlife Service at the Ashland Fish and Wildlife Conservation Office in Ashland, Wisconsin.
Scott J. Meiners
Scott J. Meiners is a professor in the Department of Biological Sciences at Eastern Illinois University, specializing in data analysis.
Leslie D. Frankland
Leslie D. Frankland is a retired fisheries biologist of the Illinois Department of Natural Resources.
Jeffrey R. Laursen
Jeffrey R. Laursen is a professor in the Department of Biological Sciences at Eastern Illinois University, focusing in parasitology and aquatic ecology.
Robert E. Colombo
Robert E. Colombo is a fisheries ecologist focusing on anthropogenic impacts on fish population dynamics.
References
- Baker JA, Killgore KJ, Kasul RL. 1991. Aquatic habitats and fish communities in the lower Mississippi River. Aquat Sci. 3:313–356.
- Bonvechio KI, Allen MS, Bonvechio TF, Coughlin TP. 2008. Comparison of largemouth bass assessment metrics between standardized and historical sampling designs at six Florida lakes. N Am J Fish Manag. 28(4):1132–1137.
- Brown ML, Allen MS, Beard TD Jr. 2012. Data management and statistical techniques. In Zale AV, Parrish DL, Sutton TM, editors. Fisheries techniques. 3rd ed. Bethesda, Maryland: American Fisheries Society; p. 15–75.
- Carlson BD, Propst DB, Synes DJ, Jackson RS. 1995. Economic impact of recreation on the Upper Mississippi River System. U.S. Army Corps of Engineers. Technical Report EL-95-16.
- Chick JH, Pegg MA, Koel TM. 2006. Spatial patterns of fish communities in the upper Mississippi River: assessing fragmentation by low – head dams. River Res Appl. 22(4):413–427.
- Gabelhouse DW Jr. 1984. A length categorization system to assess fish stocks. N Am J Fish Manag. 4(3):273–285.
- Gammon JR. 1998. The Wabash river ecosystem. Bloomington: Indiana University Press.
- King TA, Williams JC, Davies WD, Shelton WL. 1981. Fixed versus random sampling of fishes in a large reservoir. Trans Am Fish Soc. 110(4):563–568.
- McClelland MA, Sass GG. 2012. Assessing fish collections from random and fixed site sampling methods on the Illinois River. J Freshw Ecol. 27(3):325–333.
- Neumann RB, Guy CS, Willis DW. 2012. Length, weight, and associated indices. In Zale AV, Parrish DL, Sutton TM, editors. Fisheries techniques. 3rd ed. Bethesda, Maryland: American Fisheries Society; p. 637–676.
- Patterson CP. 2014. A comparison of a fixed vs. stratified random sampling design for electrofishing Largemouth Bass in Oklahoma. J Southeastern Assoc Fish Wildlife Agencies. 1:70–74.
- Pegg MA, McClelland MA. 2004. Spatial and temporal patterns in fish communities along the Illinois River. Ecol Freshwater Fish. 13(2):125–135.
- Pyron M, Lauer TE. 2004. Hydrological variation and fish assemblage structure in the middle Wabash River. Hydrobiologia. 525(1-3):203–213.
- Quist MC, Gerow KG, Bower MR, Hubert WA. 2006. Random versus fixed-site sampling when monitoring relative abundance of fishes in headwater streams of the Upper Colorado River Basin. N Am J Fish Manag. 26(4):1011–1019.
- R Core Team. 2017. R: A language and environment for statistical computing. Vienna, Austria: R Foundation for Statistical Computing.
- Ratcliff EN, Gittinger EJ, O’Hara TM, Ickes BS. 2014. Long term resource monitoring program procedures: fish monitoring. 2nd ed. U.S. Army Corps of Engineers. Upper Mississippi River Restoration LTRMP 2014-P001.
- Slipke JW, Martin AD, Pitlo J Jr, Maceina MJ. 2002. Use of the spawning potential ratio for the upper Mississippi River channel catfish fishery. N Am J Fish Manag. 22(4):1295–1300.
- Sparks RE, Bayley PB, Kohler S, Osborne LL. 1990. Disturbance and recovery of large floodplain rivers. Environ Manage. 14(5):699–709.
- Sparks RE, Nelson JC, Yin Y. 1998. Naturalization of the flood regime in regulated rivers: the case of the upper Mississippi River. Bioscience. 48(9):706–720.
- Smith PW. 2002. The fishes of Illinois. Urbana, Illinois: University of Illinois Press.
- USGS (United States Geological Survey). 2015. USGS Current Conditions for the Nation. Department of the Interior. [July 2016]. //nwis.waterdata.usgs.gov/nwis/uv.