
Abstract
Spatio-temporal patterns in chlorophyll a (Chl-a) from size-fractionated phytoplankton were examined in the Pearl River (PR), China, during 2015 and 2016. The concentration of total Chl-a was a good indicator of spatial patterns, since it increased along a nutrient gradient. A nonmetric multidimensional scaling (NMDS) model showed clearly a spatial pattern in the distribution of size-fractionated Chl-a, dividing the study area into three groups of sampling sites. The three groups represented sites at the West River (G1), the central Pearl River Delta (G2) and the Guangzhou City center (G3). Temporal changes in physicochemical factors among the three groups were not obvious. And the Linear Discriminant Analysis (LDA) model showed G1 and G2 were mostly explained by physical factors, G3 was closely associated with chemical factors. The potential of using size-fractionated Chl-a data as an indicator of water quality was compared using two other size-based methods; the morphological traits of the algae Aulacoseira granulata and using functional groups (FGs) combined with trait-based (algae volume) classifications of benthic diatoms. Our study indicated that size-based methods of phytoplankton research could make a useful contribution to determine spatio-temporal patterns in the studied area, providing greater insight into phytoplankton dynamics and enabling better managements of water quality.
Introduction
Phytoplankton responds rapidly to changes in water quality, hydrology and climate change, and are thus effective biological indicators of changes in nutrient loads and of other environmental stress factors (Domingues et al. Citation2008; Bosak et al. Citation2012). Phytoplankton size distribution is mainly expressed in terms of chlorophyll a (Chl-a) (Alvarez-Fernandez and Riegman 2014). Commonly, phytoplankton Chl-a is grouped into pico-Chl-a (0.2–2 μm), nano-Chl-a (2–20 μm) and micro-Chl-a (>20 μm) size fractions, and the distribution of these groups is recognized as an important ecological attribute of aquatic environments (Hopcroft and Roff Citation1990; Guerrero and Castro Citation1996). Spatial and temporal changes in Chl-a are primarily controlled by nutrients, light and temperature in the water column, and these factors could also determine the size structure and species composition of the phytoplankton community. Phytoplankton and their size distribution are recognized, therefore, as important ecological attributes of aquatic environments (Talling and Lemoalle Citation1998; Mazzuco et al. Citation2015; Blauw et al. Citation2018).
More studies have been carried out into size-fractionated Chl-a in large-scale marine ecosystems than in freshwater (Brewin et al. Citation2014); recently, however, work on the latter has begun to increase. The precious resource that freshwater quality represents is closely related to human health. However, the ecosystem is globally affected by multiple stressors from anthropogenic activities such as aquaculture, use of land for intensive farming and local drainage (Lu et al. Citation2009; Vörösmarty et al. Citation2010; Hering et al. Citation2015; Liang et al. Citation2016). Recent studies in freshwater areas have documented the relationships of size-fractionated Chl-a concentrations and environmental factors. Specifically, the ratio of pico-Chl-a to total Chl-a concentration has been found to be dominant in temperate oligotrophic lakes and rivers around the world (Frenette et al. Citation1996; Stockner Citation1998; Arin et al. Citation2005). Because of their positive buoyancy, photopigment spectrum and potential for rapid growth, small algae are well adapted to the low-nutrient euphotic zones of oligotrophic ecosystems (Masson et al. Citation2000). In addition, ammonia nitrogen and total nitrogen (TN) are positively correlated to nano-Chl-a levels (Wang et al. Citation2012; Li et al. Citation2013) and micro-Chl-a concentrations increase as eutrophication proceeds (Chisholm Citation1992; Masson et al. Citation2000; Agawin et al. Citation2000). In eutrophic water, micro-Chl-a may not always maintain a high relative concentration ratio, because the larger size and biovolume of the phytoplankton also have higher settling velocity (Konno Citation1993; Lee et al. Citation2002; Choi et al. Citation2006). However, existing studies were mainly carried out in lakes, reservoirs and estuaries, and there are limited numbers of studies using the size-fractionated phytoplankton approach in rivers (Wang et al. Citation2012; Li et al. Citation2013; Soria-Píriz et al. Citation2017).
In the large Pearl River (PR) (China), spatio-temporal patterns of phytoplankton communities and their correlations with environments have been demonstrated, based on taxonomic compositions (Wang et al. Citation2014; Wang et al. Citation2016) and functional groups (FGs) (Wang et al. Citation2018). The results indicated that functional approaches enabled better predictions of community composition than did taxonomic data. Combined functional approaches enabled better predictions for community composition than did the FG system alone (Wang et al. Citation2018). Size parameters have also been used to predict the spatial and temporal changes in environments (Wang et al. Citation2015; Wang et al. Citation2017). The morphological size parameters of Aulacoseira granulata, the dominant filamentous diatom, have proved to be good indicators of seasonal variation (Wang et al. Citation2017). However, the size of phytoplankton communities has never been considered an indicator of the PR. This study uses size-fractionated Chl-a in trying to establish whether: (1) spatial or temporal patterns dominate in the studied area; (2) size-fractionated Chl-a is a good indicator of spatial or temporal patterns. And, by comparing spatio-temporal patterns using different size-based methods in the studied area, we identify the indicating functions of size-fractionated phytoplankton Chl-a in aquatic area studies.
Materials and methods
Study sites
Our study was carried out in the PR, the largest river in southern China (Yang et al. Citation2010), comprising the West River, North River, East River and the PR Delta (PRD). The general layout of the PR basin is shown in , indicating the basin location, main tributaries, PRD and the 16 spatial sampling sites. The area of the PRD is approximately 9750 km2. The West and North River deltas account for approximately 93.7% of the total area of the PRD and the East River delta account for 6.3%. The topography of the PRD consists of an interweaving network of rivers and channels, with shoals and river outlets.
Figure 1. The Pearl River, including its three main tributaries (West, North and East River) and the Pearl River Delta system. Sampling sites are represented by black dots: FK-Fengkai, DQ-Deqing, ZQ-Zhaoqing, QQ-Qingqi, ZT-Zuotan, WH-Waihai, XW-Xinwei, XL-Xiaolan, XT-Xiaotang, BJ-Beijiao, LH-Lanhe, HL-Hengli, CC-Chencun, SQ-Shiqiao, LHS-Lianhuashan and ZJQ-Zhujiangqiao.
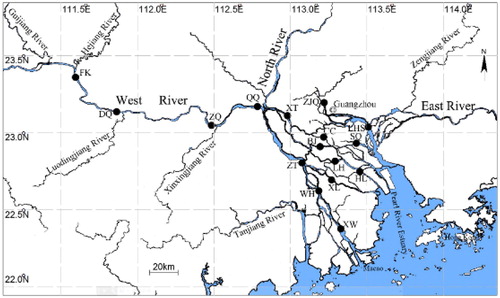
A total of 16 sampling sites that encompass the key sections of the mainstream of the West River and PRD were investigated. Fengkai (FK), Deqing (DQ), Zhaoqing (ZQ), Qingqi (QQ), Zuotan (ZT), Waihai (WH) and Xinwei (XW) were located along the main channel of the West River. Xiaolan (XL), Xiaotang (XT), Beijiao (BJ), Lanhe (LH), Hengli (HL), Chencun (CC) and Shiqiao (SQ) were located in the central PRD. Lianhuashan (LHS) and Zhujiangqiao (ZJQ) were located on the other side of the delta, near the city center of Guangzhou. ZJQ was located in the Guangzhou channel and LHS was close to the East River (). The site coordinates were collected using GPS (Map 621SC) and are listed in .
Table 1. Sampling site coordinates.
Sampling and data collection
Phytoplankton samples were collected in March, June, September and December 2015; and in June and December 2016. March and December represented drought periods and June and September represented flood periods. At each sampling site, we took two samples, comprising 1 L of water collected in polyethylene bottles from 0.5 m below the surface using a 5-L HQM-1 sampler.
One sample was fixed immediately with a 5% formaldehyde solution and was assigned for algae identification and enumeration under an inverted microscope (Zeiss Axio Observer A1) equipped with a visual camera (AxioCam HRc) (sample a). The second bottle was immediately put in a fridge at 4 °C and transported to the laboratory for size-fractionated Chl-a analysis (sample b). Sample b was divided into three size classes: micro- (>20 μm), nano- (2–20 μm) and picophytoplankton (0.2–2 μm). The size fractions of Chl-a was derived from sequential filtration of the sample. Water samples were first gravity filtered through 20-μm of Nitex. Filtrates were then sequentially filtered through 2-μm of Millipore Polycarbonate Nuclepore and 0.2-μm membrane filters under low vacuum pressure (<100 mmHg). Chlorophyll retained by the 20-μm filters was considered microphytoplankton biomass and that retained by the 2-μm and 0.2-μm filters constituted the nano- and picophytoplankton fractions, respectively. Fragments were extracted in 5 mL of 90% acetone for 22–24 h in the dark at 4 °C. The absorption value of these three classes of phytoplankton at 750-nm, 630-nm, 647-nm and 664-nm wavelengths was then measured using an ultraviolet-visible spectrophotometer (UV-5200) after rotating at 3500 rpm for 10 min in the centrifuge, recorded as OD750, OD630, OD647 and OD664, respectively. The concentrations of Chl-a were calculated as C(mg L−1)= [11.85×(OD664-OD750)-1.54×(OD647-OD750)-0.08×(OD630-OD750)] × 5/1000. Total Chl-a concentration is the sum of these three chlorophyll concentrations.
A portable YSI meter (YSI6600-02) was used to measure water temperature, pH, conductivity, total dissolved solids (TDS), oxidation-reduction potential (Orp) and dissolved oxygen (DO) in situ at each sampling site and river width was measured using a diastimeter (Multifunction laser rangefinder). Transparency was measured using a Secchi disk. Underwater light intensity was measured with a hydrophotometer (ZDS-10) under the surface water. An additional water sample of 250 ml was filtered in situ and taken back to the laboratory for nutrient analysis (chemical oxygen demand (COD), phosphate, silicate, TN, nitrate, nitrite, ammonia and ammonium) using a water flow injection analyzer (Skalar-SA1100) and a spectrophotometer (Shimadzu UV-2501PC).
Data analysis
Non-metric multidimensional scaling (NMDS) was used to classify the pattern of phytoplankton assemblages at the sites (Kruskal and Wish Citation1978). Hierarchical clustering was performed prior to NMDS analysis and phytoplankton samples were classified into different groups. Bray–Curtis similarity was used as the distance measure and the data were log transformed for treatment (Legendre and Legendre Citation2012). Linear discriminant analysis (LDA) was also employed for pattern recognition between groups.
Results
Spatio-temporal patterns of phytoplankton chl-a
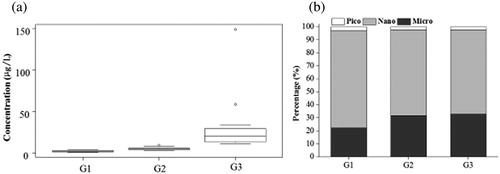
Results of the NMDS indicated that based on size-fractionated Chl-a, phytoplankton exhibited a clear spatial pattern. The three groups identified represented the West River (group 1, G1), central PRD (group 2, G2) and city center (group 3, G3) (). The sample compositions of each group were shown in Supplementary Table 1. Of these three groups, G3 showed higher total Chl-a concentrations than the other two, and G1 showed the lowest values (). All three groups were similar in the predominance of nano-Chl-a percentages (nano-Chl-a percentages of G1, G2 and G3 were 75.06%, 65.88% and 64.88%, respectively), with the lowest percentage being that of pico-Chl-a (pico-Chl-a percentages of G1, G2 and G3 were 2.84%, 2.43% and 2.21%, respectively). The main difference was that the percentage of micro-Chl-a in G1 was lower than in the other two groups ().
Figure 2. Non-metric multidimensional scaling (NMDS) model based on size-fractionated chlorophyll a. Group 1 (G1), West River; Group 2 (G2), central Pearl River Delta; Group 3 (G3), Guangzhou city center; PRD, Pearl River Delta.
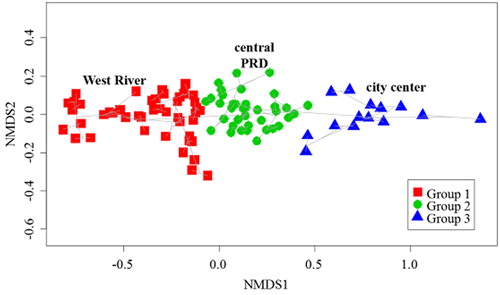
Figure 3. (a) Chlorophyll a concentration and (b) the percentage of each size fraction of phytoplankton in G1 (West River), G2 (central Pearl River Delta) and G3 (Guangzhou city center).
Relationships between environmental factors and chl-a distribution
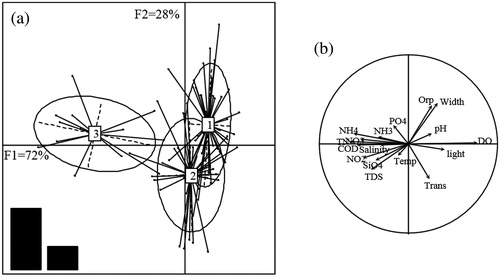
Correlations between the three groups and environmental parameters were analyzed using LDA. Two axes (F1 and F2) accounted for 72% and 28% of the between-cluster variability, respectively. The environmental parameters used were able to predict the spatial pattern of size-fractionated phytoplankton (i.e. the global score of prediction) with 76% accuracy; and the prediction success rates for G1, G2 and G3 were 80%, 70% and 79%, respectively.
Group 3 is clearly separated from the two other groups. G3 and G1 are ordered along the first axis F1 (i.e. horizontal axis) in opposite directions (). The gradients of chemical parameters and DO are loaded along this axis and are important controlling variables in G3 and G1 (). Width, Orp and transparency are along the second axis F2 (i.e. vertical axis) and are important controlling variables in G1 and G2, which are loaded along this axis in opposite directions ().
Figure 4. Results from the LDA analysis on correlations between clusters (Groups 1, 2 and 3) and environmental variables showing: (a) the distribution and overlap of clusters in F1 and F2 dimensions, and (b) the distribution of water quality parameters corresponding to F1 and F2.
Dominant phytoplankton species
Basically, diatoms were the most abundant taxa in the three groups. G1 and G2 both had the same three dominate species A. granulata, Melosira sp. and Melosira varians. A. granulata dominated almost all of the sampling stations, with a gradually increasing proportion from G1 to G3. Other major species included Peridinium sp. and Protoperidinium sp. ().
Table 2. Species with greater than 5% occurrence in the three groups: G1 (West River), G2 (central Pearl River Delta) and G3 (Guangzhou city center) waters.
Discussion
Spatio-temporal patterns of total chl-a
According to previous studies, the studied area can be divided into three spatial areas, the West River (especially the upstream region), the central PRD and the city center, which were oligotrophic, moderately eutrophic and highly eutrophic, respectively (Wang et al. Citation2017). This is consistent with the spatial distribution model based on species biomass (Wang et al. Citation2016). In this study, we obtained the same spatial pattern based on research into size fractions of phytoplankton Chl-a, which indicated that size concentrations of Chl-a are good indicator parameters for water quality classification in the middle and lower reaches of the PR. Previous studies have found that Chl-a size characteristics in lakes, estuaries and other waters varied linearly with the nutrient gradient of the water body (Wang et al. Citation2012; Li et al. Citation2013; Soria-Píriz et al. Citation2017). In our study, the concentration of total Chl-a increased with eutrophication, which is consistent with results from other waters (Chen et al. Citation2003; Xu et al. Citation2010; Wang et al. Citation2015). The total Chl-a concentration of G3 was significantly higher than that of G1 and G2. Group 3 was composed of rural sites, which were greatly affected by human activities and water eutrophication is conducive to the growth and reproduction of algae. These stations were located on the Humen side of the mouth of the PR, where there is strong water exchange; this also supplements nutrients and algae. However, there were few differences in total Chl-a between G1 and G2: (1) there was little difference in nutrient content between G1 and G2 (); and (2) the wider rivers in G1 had increased runoff in our study area. This had a significant dilution effect on the algae community, so the Chl-a concentration in G1 decreased. The relatively high transparency of G2 resulted in higher settlement loss of phytoplankton (Young et al. Citation2012) and so the Chl-a concentration of G2 was reduced. The above two points are the main reasons for the reduction in concentration differences of total Chl-a between G1 and G2.
Table 3. Environmental factors measured at G1 (West River), G2 (central Pearl River Delta) and G3 (Guangzhou city center) (mean values across sampling sites for each group).
Relative percentages of size-fractionated chl-a
There was no significant difference between G1 and G2 in the total concentration of Chl-a, and the relative composition of Chl-a content in G2 and G3 was very similar. The significant difference between G1 and the other two areas was mainly reflected in the relative composition of nano- and micro-Chl-a.
According to previous studies, the percentage of micro-Chl-a has been found to increase with eutrophication (Chisholm Citation1992; Agawin et al. Citation2000; Masson et al. Citation2000). Therefore, we supposed that the relative content of micro-Chl-a would increase progressively from G1 to G3. However, in contrast to our conjecture, our results indicated that the relative content of micro-Chl-a was almost unchanged from G2 to G3. There are several reasons: (1) Microphytoplankton growth was restricted in G3 waters. Previous studies have shown that the relative content of micro-Chl-a is positively correlated to pH value, and negatively related to COD content, temperature, TN, and PO43− (Wang et al. Citation2012; Li et al. Citation2013). However, the G3 water body had lower pH values and higher values of COD, temperature, TN, and PO43− (), which do not favor microphytoplankton. Moreover, it has been found that the low transparency of water bodies may restrict the light available to microphytoplankton (Madhu et al. Citation2007). Therefore, because of low transparency in G3 waters, light intensity in G3 was approximately 37% of G2 (), limiting the photosynthesis of microphytoplankton. (2) Microphytoplankton has been suppressed by the massive growth of nanophytoplankton. Previous results showed that nano-Chl-a was positively correlated to N content (Wang et al. Citation2012; Li et al. Citation2013). Therefore, the relatively higher N content in G3 waters was suitable for nanophytoplankton growth. Nanophytoplankton also has lower sinking velocities and turbulence may enhance the recruitment from sediment through the resuspension process. Although there was almost no difference in total Chl-a concentration between G1 and G2 areas, G1 had a lower micro-Chl-a percentage and the lowest A. granulata content (). We believe that, because river channels in G1 are wider than those in G2 and G3, there were three main reasons for the small proportion of micro-Chl-a: (1) subsidence loss of A. granulata. The filament length of A. granulata is in the nano-fraction and micro-fraction range (Gamez et al. Citation1995; O'Farrell et al. Citation2001), and the increase in settling velocity broadly coincided with the increase in size or biovolume (Konno Citation1993; Lee et al. Citation2002; Choi et al. Citation2006); (2) a previous report indicating that filaments in G1 were the shortest proved our deduction that subsidence loss of A. granulata inhibited the increase in micro-Chl-a percentage (Wang et al. Citation2017); and (3) the vertical mixing capacity of G1 was lower than that of G2, so the loss of microphytoplankton was not replenished in time.
There were clear differences between the percentages of nano-Chl-a and micro-Chl-a to total Chl-a among the three groups, but pico-Chl-a percentages did not differ greatly among the three groups. Our finding is contrary to previous reports that pico-Chl-a content is higher in oligonutrient estuaries and oceans (Carrada et al. Citation1994; Tremblay et al. Citation1997; Cai et al. Citation2002; Arin et al. Citation2005). Arin et al. (Citation2005) reported that, in marine ecosystems, pico-Chl-a content dominated in all seasons. In winter, the intrusion of nutrients into the photic zone increased the total autotrophic biomass (by intense vertical mixing and strong riverine inputs), while the picophytoplankton contribution was relatively low. The G1 waters in this paper are located in the middle and lower reaches of the PR. This open water area is easily washed by the upstream water flow and has been maintained in an oligotrophic state. This may be the reason that the pico-Chl-a percentage in G1 waters did not dominate. However, in PRD the water body has a higher nutrient content and vertical mixing capacity, which is favorable for nanophytoplankton and microphytoplankton growth and reproduction (Madhu et al. Citation2010; Li et al. Citation2013). Therefore, the pico-Chl-a percentage does not dominate G2 and G3 waters.
Comparing spatio-temporal patterns using different size-based methods
We divided the study area into three areas (groups), based on the characteristics of Chl-a size fractions, showing a significant spatial pattern instead of a temporal pattern. We analyzed physicochemical factors and Chl-a that were significantly related to the spatial pattern, showing that changes in these factors in the three groups were not obvious on the temporal scale (). This may be the main reason why size fractions of phytoplankton did not exhibit temporal patterns.
Table 4. Temporal variation in physico-chemical factors and Chl-a related to the spatial pattern (mean values across all sampling sites) G1 (West River), G2 (central Pearl River Delta) and G3 (Guangzhou city center).
One of the main objectives of the trait-based research approach is relating traits to environmental factors (McGill et al. Citation2006; Wu et al. Citation2017). Temporal and spatial patterns shown by the correlation between characteristic phytoplankton parameter changes and water environmental factors are essential for monitoring nutrient changes in water ecosystems (Casini et al. Citation2008). Published studies indicate that spatio-temporal patterns vary according to different algae size-based analysis methods. Based on size parameters (cell diameter, cell length, filament length and cell numbers in filament) of a dominant chain colony-forming planktonic diatom (A. granulata) in the PR, we obtained a clear temporal pattern; however, no single parameter was a good indicator of water quality (Wang et al. Citation2017). Seasonal variation in the relative abundance of different forms of A. granulata confirmed the indicator function of diatom size characteristics to temporal variation in the study area (Wang et al. Citation2009). Time-scale analysis showed that the phytoplankton FG concept sensu Reynolds (Reynolds et al. Citation2002) system, combined with trait-based classifications (algae volume) of benthic diatoms (S1: 5–99 µm3, S2: 100–299 µm3, S3: 300–599 µm3, S4: 600–1499 µm3 and S5:≥1500 µm3) (Berthon et al. Citation2011; Wang et al. Citation2018), enabled better predictions of community composition than the FG system alone: the interpretation rate of environmental factors to phytoplankton community was higher than that of the FG system by about 10% (Viktória et al. Citation2016; Wang et al. Citation2018). In our study, using the size characteristics of phytoplankton Chl-a, the spatial pattern of the studied areas could be defined as oligotrophic, moderately eutrophic and highly eutrophic. Similarly, spatial patterns separated the PR estuary into two areas through phytoplankton Chl-a size classification, which were characterized by low salinity–high nutrient content and high salinity–low nutrient content (Li et al. Citation2013). Nitrogen and phosphorus levels also controlled phytoplankton growth patterns in the Chinese lake Taihu, based on the study of spatio-temporal patterns of size-fractionated phytoplankton Chl-a (Yue et al. Citation2014). Our study shows that research and analysis of size-based Chl-a classification can make a useful contribution to the study of spatio-temporal patterns in aquatic areas.
Notes on contributors
WL, WD, HJ, DG and CW collected the data; JS, WL and CW contributed to the idea; NW, CW performed statistical analysis; JS, WL and CW wrote the first draft of the manuscript and then all authors contributed to revisions substantially.
Supplemental Material
Download MS Word (15.1 KB)Acknowledgments
We thank Qianfu Liu and Wanling Yang for providing environmental parameters; Elaine Monaghan, BSc (Econ), from Liwen Bianji, Edanz Editing China (www.liwenbianji.cn/ac) for editing the English text of a draft of this manuscript.
Disclosure statement
No potential conflict of interest was reported by the authors.
Additional information
Funding
References
- Agawin NSR, Duarte CM, Agustí S. 2000. Nutrient and temperature control of the contribution of picoplankton to phytoplankton biomass and production. Limnol Oceanogr. 45(3):591–600.
- Alvarez-Fernandez S, Riegman R. 2014. Chlorophyll in North Sea coastal and offshore waters does not reflect long term trends of phytoplankton biomass. J Sea Res. 91:35–44.
- Arin L, Estrada M, Salat J, Cruzado A. 2005. Spatio-temporal variability of size fractionated phytoplankton on the shelf adjacent to the Ebro river (NW Mediterranean). Continent Shelf Res. 25(9):1081–1095.
- Berthon V, Bouchez A, Rimet F. 2011. Using diatom lifeforms and ecological guilds to assess organic pollution and trophic level in rivers: a case study of rivers in southeastern France. Hydrobiologia. 673(1):259–271.
- Blauw AN, Benincà E, Laane RW, Greenwood N, Huisman J. 2018. Predictability and environmental drivers of chlorophyll fluctuations vary across different time scales and regions of the North Sea. Prog Oceanogr. 161:1–18.
- Bosak S, Šilović T, Ljubešić Z, Kušpilić G, Pestorić B, Krivokapić S, Viličić D. 2012. Phytoplankton size structure and species composition as an indicator of trophic status in transitional ecosystems: the case study of a Mediterranean fjord-like karstic bay. Oceanologia. 54(2):255–286.
- Brewin RJW, Sathyendranath S, Tilstone G, Lange PK, Platt T. 2014. A multicomponent model of phytoplankton size structure. J Geophys Res Oceans. 119:3478–3496.
- Cai YM, Ning XR, Liu CG. 2002. Distribution characteristics of size fractionated chlorophyll a and productivity of phytoplankton in the northern South China Sea and Beibu Gulf during. Stud Marin Sin. 44:11–21.
- Carrada GC, Fabiano M, Povero P, Saggiomo V. 1994. Surface distribution of size-fractionated chlorophyll a and participate organic matter in the Strait of Magellan. Polar Biol. 14(7):447–454.
- Casini M, Lövgren J, Hjelm J, Cardinale M, Molinero JC, Kornilovs G. 2008. Multi-level trophic cascades in a heavily exploited open marine ecosystem. Proc R Soc B. 275(1644):1793–1801.
- Chen Y, Fan C, Teubner K, Dokulil M. 2003. Changes of nutrients and phytoplankton chlorophyll-a in a large shallow lake, Taihu, China: an 8-year investigation. Hydrobiologia. 506:273–279.
- Chisholm SW. 1992. Phytoplankton size. In: Falkowski PG, Woodhead AD, editors. Primary productivity and biogeochemical cycles in the sea. New York (NY): Plenum; p. 213–236.
- Choi SK, Lee JY, Kwon DY, Cho KJ. 2006. Settling characteristics of problem algae in the water treatment process. Water Sci Technol. 53(7):113–119.
- Domingues RB, Barbosa A, Galvao H. 2008. Constraints on the use of phytoplankton as a biological quality element within the Water Framework Directive in Portuguese waters. Mar Pollut Bull. 56(8):1389–1395.
- Frenette J, Legendre L, Demers S, Boule M. 1996. Size-related photosynthetic characteristics of phytoplankton during periods of seasonal mixing and stratification in an oligotrophic multibasin lake system. J Plankton Res. 18(1):45–61.
- Gamez N, Riera JL, Sabater S. 1995. Ecology and morphological variability of Aulacoseira granulata (Bacillariophyceae) in Spanish reservoirs. J Plankton Res. 17:1–16.
- Guerrero F, Castro MC. 1996. Chlorophylla of size-fractionated phytoplankton at a temporary hypersaline lake. Int J Salt Lake Res. 5(3):253–260.
- Hering D, Carvalho L, Argillier C, Beklioglu M, Borja A, Cardoso AC, Duel H, Ferreira T, Globevnik L, Hanganu J, et al. 2015. Managing aquatic ecosystems and water resources under multiple stress-an introduction to the MARS project. Sci Total Environ. 503:10–21.
- Hopcroft RR, Roff JC. 1990. Phytoplankton size fractions in a tropical neritic ecosystem near Kingston, Jamaica. J Plankton Res. 12(5):1069–1088.
- Konno H. 1993. Settling and coagulation of slender type diatoms. Wat Sci Technol. 27(11):231–240.
- Kruskal JB, Wish M. 1978. Multidimensional Scaling. Beverly Hills (CA): Sage Publications.
- Lee JD, Choi SJ, Kim YH, Kim HS, Lee JH. 2002. Sinking behavior of freshwater diatoms-with special reference to measurement of phytoplankton sinking rate. J Korean Soc Wat Qual. 18:683–692.
- Legendre P, Legendre L. 2012. Numerical ecology. 3rd ed. Amsterdam (Netherlands): Elsevier Science.
- Li L, Lu S, Jiang T, Li X. 2013. Seasonal variation of size-fractionated phytoplankton in the Pearl River estuary. Chin Sci Bull. 58(19):2303–2314.
- Liang P, Wu SC, Zhang J, Cao Y, Yu S, Wong MH. 2016. The effects of mariculture on heavy metal distribution in sediments and cultured fish around the Pearl River Delta region, south China. Chemosphere. 148:171–177.
- Lu FH, Ni HG, Liu F, Zeng EY. 2009. Occurrence of nutrients in riverine runoff of the Pearl River Delta, South China. J Hydrol. 376(1–2):107–115.
- Madhu NV, Jyothibabu R, Balachandran KK. 2010. Monsoon-induced changes in the size-fractionated phytoplankton biomass and production rate in the estuarine and coastal waters of southwest coast of India. Environ Monit Assess. 166(1–4):521–528.
- Madhu NV, Jyothibabu R, Balachandran KK, Honey UK, Martin GD, Vijay JG, Shiyas CA, Gupta GVM, Achuthankutty CT. 2007. Monsoonal impact on planktonic standing stock and abundance in a tropical estuary (Cochin backwaters–India. Estuar Coast Shelf Sci. 73(1–2):54–64.
- Masson S, Pinel-Alloul B, Smith VH. 2000. Total phosphorus-chlorophyll a size fraction relationships in southern Quebec lakes. Limnol Oceanogr. 45(3):732–740.
- Mazzuco A, Christofoletti RA, Pineda J, Starczak VR, Ciotti AM. 2015. Temporal variation in intertidal community recruitment and its relationships to physical forcings, chlorophyll-a concentration and sea surface temperature. Mar Biol. 162(9):1705–1725.
- McGill BJ, Enquist BJ, Weiher E, Westoby M. 2006. Rebuilding community ecology from functional traits. Trends Ecol Evol. 21(4):178–185.
- O’Farrell I, Tell G, Podlejski A. 2001. Morphological variability of Aulacoseira granulata (Ehr.) Simonsen (Bacillariophyceae) in the Lower Paraná River (Argentina). Limnology. 2:65–71.
- Reynolds CS, Huszar V, Kruk C, Naselli-Flores L, Melo S. 2002. Towards a functional classification of the freshwater phytoplankton. J Plankton Res. 24(5):417–428.
- Soria-Píriz S, García-Robledo E, Papaspyrou S, Aguilar V, Seguro I, Acuña J, Morales Á, Corzo A. 2017. Size fractionated phytoplankton biomass and net metabolism along a tropical estuarine gradient. Limnol Oceanogr. 62(S1):S309–S326.
- Stockner J G. 1998. Phototrophic picoplankton: an overview from marine and freshwater ecosystems. Limnol Oceanogr. 33:765–775.
- Talling JF, Lemoalle J. 1998. Ecological dynamics of tropical inland waters. Cambridge: Cambridge University Press.
- Tremblay JE, Legendre L, Therriault JC. 1997. Sizedifferential effects of vertical stability on the biomass and production of phytoplankton in a large estuarine system. Estuar Coastd Shelf Sci. 45(4):415–431.
- Viktória B, Lukács Á, Török P, Kókai Z, Novák Z, Enikő T, Tóthmérészc B, Bácsi I. 2016. Combined eco-morphological functional groups are reliable indicators of colonisation processes of benthic diatom assemblages in a lowland stream. Ecol Indicat. 64:31–38.
- Vörösmarty CJ, McIntyre PB, Gessner MO, Dudgeon D, Prusevich A, Green P, Glidden S, Bunn SE, Sullivan CA, Liermann CR, et al. 2010. Global threats to human water security and river biodiversity. Nature. 467(7315):555–561.
- Wang C, Lek S, Lai ZN, Tudesque L. 2017. Morphology of Aulacoseira filaments as indicator of the aquatic environment in a large subtropical river: the Pearl River, China. Ecol Indicat. 81:325–332.
- Wang C, Li X, Lai Z, Li Y, Dauta A, Lek S. 2014. Patterning and predicting phytoplankton assemblages in a large subtropical river. Fund App Lim. 185(3):263–279.
- Wang C, Li XH, Lai ZN, Tan XC, Pang SX, Yang WL. 2009. Seasonal variations of Aulacoseira granulata population abundance in the Pearl River Estuary. Estuar Coast Shelf Sci. 85(4):585–592.
- Wang C, Li XH, Wang XX, Wu NC, Yang WL, Lai ZN, Lek S. 2016. Spatio-temporal patterns and predictions of phytoplankton assemblages in a subtropical river delta system. Fund App Lim. 187(4):335–349.
- Wang C, Viktória B, Stenger-Kovács C, Li XH, Abonyi A. 2018. Enhanced ecological indication based on combined planktic and benthic functional approaches in large river phytoplankton ecology. Hydrobiologia. 818(1):163–175.
- Wang JJ, Liu CQ, Bai JH. 2012. Relationship between size-fractionated Chlorophyll a, and environmental factors in Lake Baiyangdian, China. Proc Environ Sci. 13:1553–1558.
- Wang JN, Yan WJ, Chen NW, Li XY, Liu LS. 2015. Modeled long-term changes of DIN: DIP ratio in the Changjiang River in relation to Chl-α and DO concentrations in adjacent estuary. Estuar Coast Shelf Sci. 166:153–160.
- Wu NC, Dong XH, Liu Y, Wang C, Baattrup-Pedersen A, Riis T. 2017. Using river microalgae as indicators for freshwater biomonitoring: Review of published research and future directions. Ecol Indicat. 81:124–131.
- Xu H, Paerl HW, Qin B, Zhu G, Gaoa G. 2010. Nitrogen and phosphorus inputs control phytoplankton growth in eutrophic Lake Taihu, China. Limnol Oceanogr. 55(1):420–432.
- Yang T, Xu CY, Shao QX, Chen X. 2010. Regional flood frequency and spatial patterns analysis in the Pearl River Delta region using L-moments approach. Stoch Environ Res Risk Assess. 24(2):165–182.
- Young AM, Karp-Boss L, Jumars PA, Landis EN. 2012. Quantifying diatom aspirations: mechanical properties of chain-forming species. Limnol Oceanogr. 57(6):1789–1801.
- Yue DM, Peng YK, Qian X, Xiao L. 2014. Spatial and seasonal patterns of size-fractionated phytoplankton growth in Lake Taihu. J Plankton Res. 36(3):709–721.