
Abstract
Streams are complex systems that rely on connectivity to maintain natural ecological function. Low-water crossings are common in small-intermediate sized streams and can restrict longitudinal movement of fishes. The Current River in Missouri (USA) contains a single anthropogenic barrier to longitudinal connectivity: the Cedar Grove low-water crossing, which spans the main channel (10 culverts) and a side channel (4 culverts). In July 2017, we radio-tagged Northern Hog Sucker Hypentelium nigricans upstream (henceforth ‘above’; N = 24) and downstream (henceforth ‘below’; N = 26) of the crossing and followed their movements monthly for a year to assess fish passage and maximum displacement. Passage was limited to four below-tagged fish passing upstream of the crossing with one fish making an additional downstream and then upstream passage. Passage was more likely to occur during high flow. On average, below-tagged fish exhibited more than seven times greater maximum displacement (Mean (M) = 6.55 km, Standard Error (SE) = 2.91 km) than above-tagged fish (M = 0.92 km, SE = 0.33 km). The majority (71%) of fish exhibited stationary behavior (<1 km) compared to mobile behavior (>1 km). Among mobile individuals, maximum displacement was greatest away from the crossing, with above-tagged fish favoring upstream movements (100%) and below-tagged fish favoring downstream movements (67%). Our results suggest the crossing is a semi-permeable barrier in which fish passage primarily occurs during high flows. Alternatives to the low-water crossings at Cedar Grove should be considered to promote natural longitudinal movement of fishes. The side channel provides a potentially impactful and economically feasible management opportunity to act as a fish bypass channel on the Current River.
Introduction
Longitudinal connectivity provides material resources from upstream to downstream as well as a migration corridor for aquatic organisms to essential habitat (Ward and Stanford Citation1995; Ensign and Doyle Citation2006; McIntyre et al. Citation2008). For fish, longitudinal connectivity is critical for promoting movement to feeding, spawning, and seasonal habitats that are often distantly distributed within stream networks (Calles and Greenberg Citation2009; Armstrong and Schindler Citation2013; Ettinger-Dietzel et al. 2016; Wells et al. Citation2017). For example, Armstrong and Schindler (Citation2013) found that juvenile Coho Salmon Oncorhynchus kisutch use the spatial heterogeneity in diel water temperature by feeding on salmon eggs in colder water before dispersing up to 1 km upstream to warmer headwater reaches to promote digestion. Several sucker species, (White Sucker Catostomus commersonnii, Black Redhorse Moxostoma duquesnei, Greater Redhorse Moxostoma valenciennesi, and Razorback Sucker Xyrauchen texanus) have been documented migrating from 6 to 50 km to reach spawning grounds (Raney and Webster Citation1942; Bowman Citation1970; Modde and Irving Citation1998; Bunt and Cooke Citation2001).
A major anthropogenic effect on longitudinal connectivity and fish movement in lotic systems worldwide is the construction of barriers (e.g. dams, weirs, and road crossings). The United States alone has approximately 82,000 dams over 2 m in height and 2,000,000 smaller structures that disrupt longitudinal connectivity (Baker et al. Citation2011). Huusko et al. (Citation2018) followed the downstream migration of juvenile Atlantic Salmon Salmo salar in both a regulated (five dams) and adjacent free-flowing river and found six times greater survival of smolt in the free-flowing system. Anadromous salmonids have received the bulk of research attention regarding barriers due to the clear importance of longitudinal connectivity in their life histories and the economic importance of these taxa (Gowans et al. Citation1999; Scruton et al. Citation2007; Davis and Davis Citation2011). However, smaller barriers (e.g. weirs and road crossings) and less economically important stream fishes such as Campostoma spp., Cyprinella spp., and Cottus spp. have received more attention over the past decade (Benton et al. Citation2008; Helms et al. Citation2011; Mueller et al. Citation2011). Smaller barriers are often considered semi-permeable in which fish passage is enhanced during high flow events. For example, high flows may temporarily reestablish stream connectivity through perched culverts or provide alternative pathways around barriers of other types (Perkin and Gido Citation2012).
Low-water crossings are common in low order streams and range in size and complexity. Crossings containing pipe culverts appear to have a greater negative impact on fish movement than box culverts, open span bridges, and natural reaches (Warren and Pardew Citation1998; Benton et al. Citation2008). Pipe culverts primarily inhibit fish movement by creating jump, velocity, and depth barriers (Benton et al. Citation2008; Hansen and Reeves Citation2008; Bouska and Paukert Citation2010; Eisenhour and Floyd Citation2013). Studying the impacts of low-water crossings on a variety of fishes can provide important information on how these barriers affect the longitudinal distribution of understudied, common stream fishes and associated ecosystem processes.
The Northern Hog Sucker Hypentelium nigricans is widely distributed throughout much of the Mississippi River Basin where it inhabits riffle, run, and pool habitat in streams with permanent flow and clean gravel substrate (Pflieger 1997). Adults commonly reach 203–381 mm in length and weigh between 136–635 g (Pflieger Citation1997). The Northern Hog Sucker is a benthic species and can exhibit mean daily movements of at least 425 m (Matheney and Rabeni Citation1995). In the Missouri Ozarks, it is an abundant game fish and is commonly found in loosely organized schools of conspecifics and heterospecifics (e.g. Moxostoma spp.). Spawning in Missouri occurs during spring (April–May) when fish move into the heads and tails of pool habitat with moderate velocities and depth (Matheney and Rabeni Citation1995).
Velocity barriers, such as those commonly associated with low-water crossings containing pipe culverts, may negatively impact the longitudinal movements of Northern Hog Suckers. For example, juveniles (25 mm TL—total length) have a FV50 (velocity in which 50% of fish fail to maintain their position in a 30-minute period) of 0.142 m/s with adults (330 mm TL) projected to have a FV50 of 1.485 m/s (Ivasauskas Citation2017). Additionally, Northern Hog Suckers, like many other stream fishes, have been found to exhibit both mobile and stationary behaviors (Matheney and Rabeni Citation1995; Radinger and Wolter Citation2014). Movements necessary for this species to reach suitable habitats during different life stages (juveniles vs. spawning adults), seasons (summer vs. overwintering habitat), or mobility types (mobile vs. stationary) make Northern Hog Suckers vulnerable to high velocity barriers that restrict longitudinal movement.
We investigated potential differences in movement behavior of Northern Hog Suckers located upstream (henceforth ‘above’) and downstream (henceforth ‘below’) of a large, pipe-culvert lined low-water crossing in a third-order Ozark river. To assess differences in above and below-tagged fish, we tested four hypotheses. H1) The crossing limits fish passage to periods of high flow. H2) Velocity barriers caused by the pipe culverts (frequently > FV50) restrict upstream-directed passage. H3) Maximum displacement in above vs. below mobile fish is similar; however, (H4) the direction of displacement is upstream-directed in above-tagged fish and downstream-directed in below-tagged fish.
Materials and methods
Study site
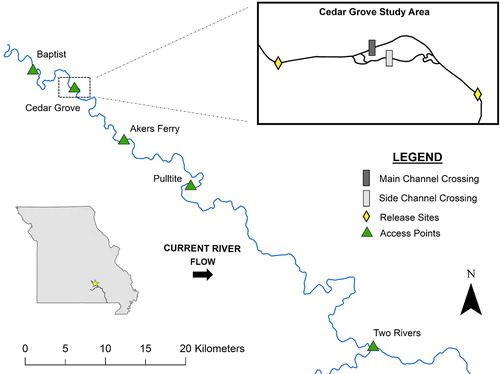
The Current River is located within the Ozark Plateau of Southeastern Missouri, USA. The Ozark region consists of karst topography which includes shallow, porous soils over cherty limestone and dolomites as well as numerous caves, sinkholes, and springs (Matheney and Rabeni Citation1995; Orndorff et al. Citation2001). Channel gradient of the Current River averages 0.74 m/km (Ettinger-Dietzel et al. Citation2016). The river’s baseflow is primarily spring-fed, but the flow regime is strongly influenced by rainfall events with highest flows occurring during spring months, on average (Leasure et al. Citation2016). Ozark National Scenic Riverways (OZAR, National Park Service) encompasses 5% of the river’s watershed and helps protect over 100 species of fish along much of its 296 km length (Dodd Citation2009, Citation2013). The river is free flowing with the exception of a single low-water crossing 17 km downstream of the river’s source (Wilkerson 2003; ).
Figure 1. Map showing the headwaters of the Current River and the Cedar Grove study area (37°25′19″ N, 91°36′30″ W). Northern Hog Sucker release sites (diamonds), low-water crossings (dark and light rectangles), and commonly used access points (triangles) are represented. Main tracking efforts were conducted between Baptist and Akers Ferry access points with periodic extended surveys to Two Rivers.
The Cedar Grove low-water crossing (; henceforth ‘the crossing’) consists of two structures, one spanning the main channel (: A and B; ) and another spanning a side channel (: C and D; ). During baseflow, all flow is forced through corrugated pipe culverts (). The culverts are non-perched year-round, due in part to stable baseflow. Both structures create upstream impoundment pools with moderate to heavy sediment deposition and scoured downstream plunge pools followed immediately (<10 m) by natural riffle-pool sequence (; ).
Figure 2. (A) Downstream view of the main channel crossing at Cedar Grove. (B) Upstream view of the main channel crossing showing heavy amounts of sediment deposition. (C) Downstream view of the side channel crossing at Cedar Grove. (D) Upstream view of the side channel crossing showing lighter sediment deposition. Pictures were taken February 9, 2018. Discharge at the Cedar Grove low-water crossing is 2.33 m3/s (Akers Ferry = 5.10 m3/s).
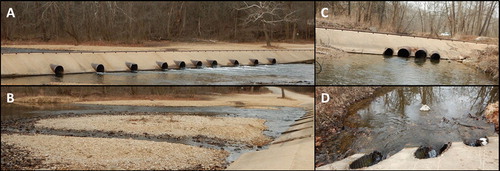
Table 1. Physical characteristics of the main and side channel crossing and associated culverts.
Table 2. Physical characteristics of the upstream impoundment pool and downstream plunge pool associated with the main and side channel crossing at Cedar Grove.
Sampling design
In July 2017, Northern Hog Suckers were collected using boat electrofishing procedures outlined in Peterson et al. (Citation2008). We anesthetized fish using a solution of river water and seltzer water (H2CO3) in a holding container, maintaining a CO2 concentration of 400 mg/L and dissolved oxygen concentration around 5 mg/L (Summerfelt and Smith Citation1990). This study evaluated individuals >181 g that were surgically equipped with radio transmitters with a trailing whip antenna (Advanced Telemetry Systems, F1580, 3.6 g, 441-day battery life, Frequencies: 164.013–165.692 Hz), such that tags were less than 2% of the body weight (Matheney and Rabeni Citation1995). We tagged 24 fish above and 26 fish below the crossing and allowed fish two hours to recover before releasing them centrally within the two sample reaches, approximately 600 m upstream and downstream of the crossing (). Initial mortality was high (N = 17) and likely associated with tagging stress, warm water temperatures, and predation. To recover the sample size, we conducted a second tagging event above (N = 8) and below (N = 9) the crossing in November 2017.
We conducted 14 surveys between July 2017 and June 2018 (). A 40 km stretch of the Current River, between Baptist Access and Pulltite Campground () was searched during each tracking event. Extended surveys were conducted downstream to Two Rivers in March and December 2017 to search for fish previously undetected within the main sample stretch (). We surveyed monthly during periods of low flow (summer: June–August, fall: September–November, winter: December–February) and increased survey frequency during periods of higher flow and spawning season (spring: March–May, ). We assessed fish position by first floating the study area with a receiver (Lotek Wireless, Biotrack Reciever, 3-element Yagi Antenna) until we were within close proximity of a tagged fish. We then determined individual fish locations with triangulation from river’s edge, as to not disturb the fish. The position of each fish was then recorded using a Trimble Geo7x GPS unit with sub-meter accuracy. If tagged fish were not visible during data collection, fish were temporarily monitored to ensure tags were not shed.
Figure 3. Stream discharge at USGS gauge station 07064533 during the study period. The gauge is approximately 13 Km downstream of the crossing near Akers, MO. Sampling events are represented on the x-axis with the two tagging events indicated by circles. Arrows indicate when a fish passage was detected and the direction of that passage (upstream/downstream). Numbers above each arrow represent the ID of each fish which passed (Appendix). The 17 year annual mean discharge (12 m3/s) and point in which the water level at the crossing reached the top of the culverts (70 m3/s), and inundated the crossing (300 m3/s) are plotted on the hydrograph. Flow classifications used in the study are represented on the right side of the y-axis.
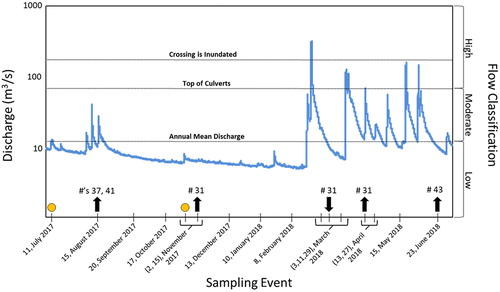
In order to monitor key water levels associated with the crossing, we deployed a series of iButtons (Maxim Integrated) that logged temperature every two hours and were placed downstream of both main and side channel crossings at four vertical levels: 1) near the stream bed in deep water (water temperature control); 2) at the top of the culverts (high flow); 3) at the top of the crossing (inundation of the crossing); 4) above a floodplain terrace lateral to the channel (air temperature control). Because air temperature fluctuates more rapidly than water temperature, due to water’s higher heat capacity (Perlman Citation2018), we were able to determine if the water column reached these vertical stages by evaluating temperature differences between the two mid-level loggers (culverts and top of crossing) and the controls for water and air temperature throughout the study period. As such, we could ask whether fish passage events were associated with high flow events at the crossing, and we could approximate stream discharge during these events, as recorded by a US Geological Survey (USGS) gauge station (07064533, Akers Ferry) approximately 13 km downstream of the crossing (). For the purpose of this study, we classified flow magnitude in the following categories: low flow (≤12 m3/s, 17-year annual mean discharge (AMD) at gauge or bottom of culverts), moderate flow (12–70 m3/s, between bottom and top of culverts), and high flow (>70 m3/s, exceeding top of culverts, ). The crossing was completely inundated when flow was approximately 300 m3/s at the Akers Ferry gauge.
Data analyses
Telemetry data were uploaded with GPS Pathfinder Office (Version 5.85) and imported into ArcMap 10.3 for analysis. Fish passage events were confirmed if a fish tagged downstream of the crossing was located upstream of the crossing during a later survey and vice versa. Passage events were then cross-referenced to flow magnitude. Movements were measured by snapping fish locations to a digitized midline of the stream channel and measuring the linear distances along the midline between consecutive fish locations. We determined the maximum displacement value for each fish by measuring the furthest distance a fish was located from its release site during the study. Fish were then classified as either exhibiting stationary (<1 km) or mobile (>1 km) behavior according to their maximum displacement (Matheney and Rabeni Citation1995; Radinger and Wolter Citation2014). We required individuals to be located at least twice following initial release to be included in further analysis.
Statistical analysis was conducted in RStudio with an alpha of 0.05. Maximum displacements were first analyzed without including the direction (upstream/downstream) of movements thus giving us the overall magnitude of maximum displacement in all fish (mobile and stationary) tagged above vs. below the crossing. We conducted a similar analysis that included the directional component of maximum displacement in all fish. Upstream-directed movements were assigned a positive value and downstream-directed movements a negative value. Maximum displacement data were non-normally distributed (Package: e1071, Function: skewness and kurtosis), so we cube-root transformed these data to meet the assumptions required for parametric statistical analysis. To test for differences in the magnitude and direction of maximum displacement between above (N = 22) and below-tagged (N = 23) fish, we conducted two separate two-way Analysis of Variance (ANOVA) tests with tagging location (above vs. below) and mobility type (mobile vs. stationary) as factors (Program: stats, Function: aov). Following each two-way ANOVA, we used Tukey’s test (Program: stats, Function: tukeyHSD) for pairwise comparisons.
Results
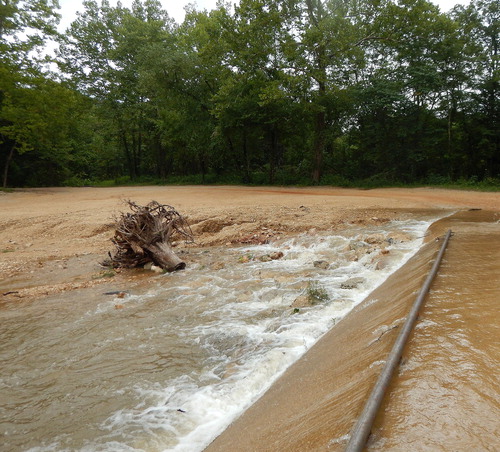
We located 46 of the 50 tagged fish at least once following release and collected a total of 317 fish locations (Appendix). There was no difference in the total length (t (44) = 2.015, P = 0.4538) or weight (t (44) = 2.015, P = 0.8069) of fish tagged above (Mean (M) = 341 mm, 406 g; Standard Error (SE) = 7.41 mm, 32.49 g) and below (M = 332 mm, 395 g; SE = 9.21 mm, 34.15 g) the crossing (Appendix). The temperature logger array at the crossing recorded one event in which water levels completely inundated the crossing (February 24–25, 2018; ). During the summer, fall, and winter discharge typically remained below the AMD with the exception of three moderate flow events in August, while discharge in spring typically consisted of moderate flow (). During moderate flows, we observed a predictable formation of lateral overflow at the main channel crossing which acted as a pseudo-fish ladder for juvenile (non-tagged) Northern Hog Suckers to pass upstream over the top of the crossing ().
Figure 4. Image of the pseudo-fish ladder formed along the edge of the main channel crossing following heavy rainfall. The discharge at Akers Ferry is approximately 28 m3/s during this photo. Picture taken August 17, 2017.
and Appendix show detailed data on the timing and direction of all passage events during the year-long study. Four below-tagged fish (8% of tagged fish) successfully passed the crossing resulting in a total of six passage events. Five of these events were upstream-directed and one downstream. In August 2017, two individuals (fish # 37 and 41) passed upstream during a period of low to moderate flow. The third individual (fish # 31) passed upstream shortly after its release in November 2017 during low flow conditions. The same individual (fish # 31) passed back downstream in the early spring 2018, following our highest flow event in which the crossing was inundated, and again upstream in late spring during moderate to high flows. The fourth individual (fish # 43) passed upstream between late spring and early summer 2018 during a period of several moderate flow events.
River distances traveled by individual Northern Hog Suckers ranged from 0.3 to 49 km across the study year. The majority (71%) of suckers at Cedar Grove exhibited stationary behavior, although stationary behavior was more prevalent in above-tagged (82%) than below-tagged (62%) fish (Appendix). Forty-five fish were located at least twice following their release, therefore meeting our criteria for inclusion in the maximum displacement analysis (Appendix). The maximum displacement of individuals (regardless of movement direction) was significantly greater in below-tagged (M = 6.55 km, SE = 2.91 km) than above-tagged (M = 0.92 km, SE = 0.33 km) fish (; ). A significant interaction between location relative to the crossing and mobility type revealed greater maximum displacement of mobile individuals below the crossing (M = 16.08 km, SE = 6.40 km) than mobile individuals above (M = 3.12 km, SE = 1.50 km) the crossing (; ). The upstream/downstream direction of maximum displacement significantly differed between above-tagged (M = 0.83 km, SE = 0.35 km) and below-tagged (M = −5.27 km, SE = 3.03 km) fish (; ). Furthermore, a significant interaction between location relative to the crossing and mobility type showed different direction of maximum displacement between mobile individuals above (M = 3.12 km, SE = 1.50 km) compared to below (M = −13.28 km, SE = 7.16 km) the crossing ().
Figure 5. Frequency distribution representing the direction of maximum displacement of Northern Hog Suckers around the Cedar Grove low-water crossing. Mobile fish above and below the crossing are represented on the two left panels while stationary fish above and below the crossing are represented on the right panels. Release sites (0, bold) and the position of the crossing relative to release sites (dashed verticle line) are represented on the x-axis. Positive displacement reflects upstream movement and negative displacement reflects downstream movement.
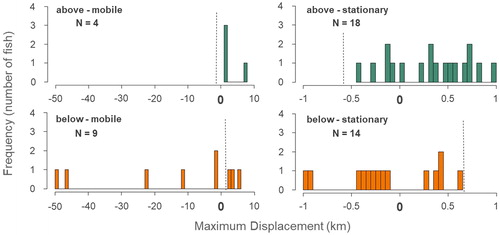
Table 3. Results of two-way ANOVAs for effects of tagging location and mobility type on maximum displacement and directional maximum displacement of Northern Hog Suckers.
Discussion
Fish passage and streamflow
Our findings that fish passage typically occurred during periods of moderate to high flows support our hypothesis (H1) that the Cedar Grove low-water crossing is a semi-permeable barrier. However, we found passage was more common in the upstream direction than our hypothesized (H2) downstream direction. We anticipated that a velocity barrier within the culverts would be the limiting factor on upstream-directed movements past the crossing, but evidence suggests that elevated flows created a pseudo-fish ladder lateral to the main channel that was likely the mechanism for upstream passage. Higher flows that promoted passage lateral to the crossing also likely reduced barrier effects created by the extensive sediment deposition upstream of the crossing. We observed juvenile Northern Hog Suckers passing upstream in this manner, and it is likely that the tagged adults that successfully passed used a similar strategy. The single downstream passage event (Fish # 31) directly followed a high-flow event in which the river reached the maximum discharge recorded during the study, and streamflow inundated the crossing. This high flow event scoured out areas of heavy sediment deposition upstream of the crossing (personal observation) and almost certainly enhanced downstream passage.
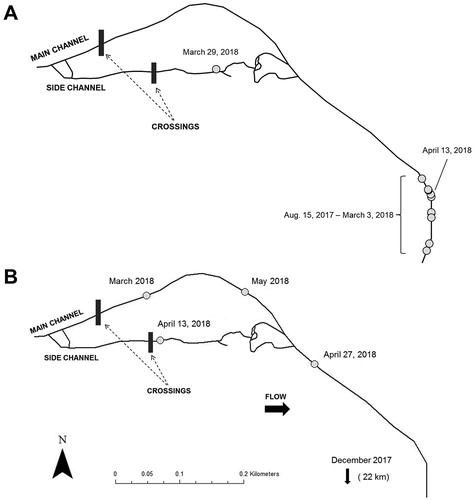
Northern Hog Suckers also could have passed upstream and downstream of the crossing in the side channel, where culvert velocities have been documented to be lower, and upstream sediment deposition is less pronounced. Side channel use by Northern Hog Suckers has been documented during periods of elevated flow in lower sections of the Current River (Matheney and Rabeni Citation1995). Other fishes, such as Rainbow Trout Oncorhynchus mykiss and European Grayling Thymallus thymallus, also have been found to use side channels to avoid small barriers (Jungwirth Citation1996). We observed tagged (N = 2, : A and B) and non-tagged Northern Hog Suckers moving throughout the side channel downstream of the crossing year-round and congregating in its plunge pool. However, both of the tagged fish found in the side channel moved back downstream into the main channel after reaching the plunge pool (: A and B), and non-tagged fish were frequently observed swimming in a downstream direction within the side channel. During the study, no adult fish (tagged or non-tagged) were observed upstream of the side-channel crossing. This pattern suggests that individuals were using the side channel for upstream movements but were inhibited by the culverts and the absence of flow lateral to the crossing.
Figure 6. (A) Map showing the upstream movement of an individual (Fish # 40, Appendix) into the side channel during a period of high flow before returning downstream. (B) Map showing the movements exhibited by an individual (Fish #44, Appendix) from the main channel crossing to the side channel crossing after completing a long upstream migration.
The single passage event documented during low flow (Fish # 31) occurred within two weeks of initial release and was likely influenced by tagging stress. Matheney (Citation1993) reported extreme movements in two Northern Hog Suckers (15 km downstream and 17 km upstream) shortly after release from surgical tagging procedures. This behavior is common across fish taxa. For example, European Grayling released in an experimental stream moved up to 400 m within the first 12 minutes of release (Carlstein and Eriksson Citation1996). We suspect that this low flow passage event occurred through the side channel crossing due to the combination of shallower water and greater deposition upstream of the main channel crossing.
Fish passage was exhibited only by individuals tagged and released below the crossing. It is unclear why these were the only fish passing throughout the year. This pattern could be explained by the greater stream length of degraded habitat upstream (impoundment pool and extensive sediment deposition; main channel = 420 m, side channel = 92 m) of the crossing compared to downstream (plunge pool; main and side channel = 10 m) which would have allowed below-tagged fish to come in more frequent contact with the crossing. However, we only documented 3 tagged fish (above: N = 1, below: N = 2) within 30 m of the crossing during the study, and fish frequently inhabited the entire length of the main channel impoundment pool (N = 8). Other possible explanations include the higher proportion of mobile individuals tagged downstream of the crossing and the greater access to the alternative pathways (pseudo-fish ladder and side channel), previously mentioned.
Movement behavior and maximum displacement
Mobile behavior was more common in below-tagged fish, a pattern that is likely associated with the greater length of river habitat available downstream of the crossing (279 km) vs. upstream (17 km). Mobile individuals (N = 13) were more likely to come into contact with the crossing than stationary individuals (N = 32); therefore, it is not surprising that we saw the greatest impacts on movement behavior in those fish. The larger maximum displacements observed in mobile fish below the crossing lead us to reject our hypothesis (H3) that above and below-tagged fish would move similar distances. However, our hypothesis (H4) that movement by both above (100%) and below-tagged (67%) fish would be greatest in the direction away from the crossing was supported. The exceptions were three of the four below-tagged fish (Fish # 31, 41, and 43) that successfully passed upstream of the crossing (). Downstream displacement in above-tagged fish appeared to be strongly limited by the presence of the crossing ().
Current understanding of Northern Hog Sucker movement is minimal. In small Indiana creeks, Gerking (Citation1953) reported Northern Hog Suckers exhibiting relatively little annual movement, with home ranges as small as 300 m. In our larger study stream, Matheney and Rabeni (Citation1995) reported home ranges of 936 m within a single season. A variety of environmental factors such as stream size and habitat complexity may explain differences in observed movement behavior across studies. In our study, we found similarities between the magnitude of movement exhibited by stationary individuals to that of Gerking (Citation1953) and mobile individuals to that of Matheney and Rabeni (Citation1995). Therefore, populations of this species probably maintain a balance between mobile and stationary individuals, and conclusions likely vary depending on study stream and timing.
We found that Northern Hog Suckers, like other sucker species, are capable of large seasonal movements (Modde and Irving Citation1998; Bunt and Cooke Citation2001). Nearly 70% of these movements occurred in the downstream direction, during low flow conditions in late fall and early winter (October–December 2017), and during non-spawning periods. However, large upstream movements (30%) did occur in spring during spawning periods. Other sucker species, such as Razorback Sucker and Greater Redhorse, have exhibited large downstream movements (50 km and 15 km respectively) during periods of high flow and following spawning activity (Modde and Irving Citation1998; Bunt and Cooke Citation2001). These differences may have been associated with the relative position of tagged fish within the watershed. In our study, the focal crossing is located 17 km downstream of the Current River’s headwaters; therefore, these extreme movements may have been attributed to fish migrating downstream to overwintering habitat (deep pools) during low flow conditions. Similar to our study, large upstream movements during spawning and high flow periods have been reported in Black Redhorse, which frequently school together with Northern Hog Suckers in the Current River (Bowman Citation1970; Bunt and Cooke Citation2001). It is also possible that sex-specific behavioral differences could be influencing movement behavior. The fish in our study were not sexed due to the absence of identifying characteristics (gametes and tubercles) during the non-spawning period of initial capture; however, sex-biased dispersal is common in fishes and has been well documented (Hutchings and Gerber Citation2002; Croft et al. Citation2003).
Summary
Differences in maximum displacements and other movement behaviors exhibited within and across taxa are likely attributed to many factors, such as resource availability, environmental conditions, competition, intraspecific differences in mobility, and physical capabilities (Albanese et al. Citation2004; Jackson et al. Citation2001). These complex factors can make studying movement behavior difficult and lead to conflicting results across similar taxa. Continued species-specific movement studies with large sample sizes are necessary in both fragmented and non-fragmented streams to better understand the variety of movement behaviors displayed within species and movement behavior in its entirety. The results of our intensive, year-long study of Northern Hog Sucker movement behavior in the Current River has strong management implications. On the Current River, gigging (Turner Citation2014) is permitted for Northern Hog Suckers downstream of the Cedar Grove low-water crossing. Because the crossing limits passage, Northern Hog Suckers are restricted from reaching upstream refugia. Replacing the Cedar Grove low-water crossing with a clear-span bridge or larger culverts (arch and open box culverts) that maintain the natural stream substrate and flow regime would help re-establish connectivity and promote longitudinal movements of Northern Hog Suckers and other fishes (Benton et al. Citation2008; Bouska and Paukert Citation2010). However, the implementation of a large management project such as this would be difficult. It would require substantial time and resources and disrupt both vehicle crossing of the river and human recreational activities (fishing, canoeing, and swimming) that are popular in this stretch of river. Because fishes regularly use side channels, including a couple of our tagged fish, another approach may be to only modify the smaller crossing at Cedar Grove and allow the side channel to act as a fish bypass system (Jungwirth Citation1996; Schmutz et al. Citation1998; Santos et al. Citation2005). This fish bypass could be both an economically and biologically beneficial alternative to replacing the entire main channel crossing.
Acknowledgments
Thanks to Alicia Mathis at Missouri State University (MSU) for assistance with data analysis. Within the Heartland Inventory and Monitoring Network (HTLN) network, we thank the aquatics program for providing sampling and tracking equipment as well as Jen Haack for GPS assistance. Furthermore, we thank Victoria Grant and Mike Gossett at Ozark National Scenic Riverways for their assistance in field logistics and study design. Lastly, thanks to Payton Lackman, J. Tyler Cribbs, Nathan Dorff, Ethan Green, Ryan Langer, and Ashley Williams for their assistance with field sampling.
Disclosure statement
Views, statements, findings, conclusions, recommendations, and data in this manuscript are solely those of the authors and do not necessarily reflect views and policies of the U.S. Department of Interior, National Park Service. Mention of trade names or commercial products does not constitute endorsement or recommendation for use by the National Park Service.
Additional information
Funding
Notes on contributors
Jeffrey M. Williams
Jeffrey M. Williams is a Research Specialist in the Biology Department at Missouri State University. He assists the Heartland Inventory and Monitoring Network of the National Park Service with long-term monitoring of fish and aquatic macroinvertebrate communities in streams throughout the Midwest.
Hope R. Dodd
Hope R. Dodd is the Fisheries Biologist for the Heartland Inventory and Monitoring Network of the National Park Service. Her work focuses on long-term monitoring of aquatic communities in streams and springs throughout the Midwest. Her research interests include assessment of anthropocentric disturbances and remediation practices in stream systems.
Debra S. Finn
Debra S. Finn is an Assistant Professor in the Biology Department at Missouri State University. Her research emphasizes ecological connectivity in longitudinal, lateral, and vertical dimensions in stream ecosystems.
References
- Albanese B, Angermeier PL, Dorai-Raj S. 2004. Ecological correlates of fish movement in a network of Virginia streams. Can J Fish Aquat Sci. 61(6):857–869.
- Armstrong JB, Schindler DE. 2013. Going with the flow: spatial distributions of juvenile Coho Salmon track an annually shifting mosaic of water temperature. Ecosystems. 16(8):1429–1441.
- Baker DW, Bledsoe BP, Albano CM, Poff NL. 2011. Downstream effects of diversion dams on sediment and hydraulic conditions of Rocky Mountain stream. River Res Appl. 27 (3):388–401.
- Benton PD, Ensign WE, Freeman BJ. 2008. The effect of road crossings on fish movements in small Etowah Basin streams. Southeast Nat. 7(2):301–310.2.0.CO;2]
- Bouska WW, Paukert CP. 2010. Road crossing designs and their impact on fish assemblages of Great Plains streams. Trans Am Fish Soc. 139(1):214–222.
- Bowman ML. 1970. Life history of the black redhorse, Moxostoma duquesnei (Lesueur), in Missouri. Trans Am Fish Soc. 99(3):546–559.
- Bunt CM, Cooke SJ. 2001. Post-spawn movements and habitat use by Greater Redhorse, Moxostoma valenciennesi. Ecol Freshw Fish. 10(1):57–60.
- Calles O, Greenberg L. 2009. Connectivity is a two-way street – the need for a holistic approach to fish passage problems in regulated rivers. River Res Appl. 25(10):1268–1286.
- Carlstein M, Eriksson LO. 1996. Post-stocking dispersal of European grayling, Thymallus thymallus (L.), in a semi-natural experimental stream. Fish Manag Ecol. 3(2):143–155.
- Croft DP, Albanese B, Arrowsmith BJ, Botham M, Webster M, Krause J. 2003. Sex-biased movement in the guppy (Poecilia reticulate). Popul Ecol. 137(1):62–68.
- Davis JC, Davis GA. 2011. The influence of stream-crossing structures on the distribution of rearing juvenile Pacific Salmon. J North Am Benthol Soc. 30(4):1117–1128.
- Dodd HR. 2009. Fish community monitoring at Ozark National Scenic Riverways: 2005-2007 status report. Fort Collins (CO): National Park Service; Natural Resource Technical Report NPS/HTLN/NRTR—2009/224.
- Dodd HR. 2013. Fish community monitoring at Ozark National Scenic Riverways: 2005-2010 summary report. Fort Collins (CO): National Park Service; Natural Resource Data Series NPS/HTLN/NRDS—2013/599.
- Eisenhour DJ, Floyd MA. 2013. A culvert as a barrier for blackside dace (Chrosomus cumberlandensis) movements in Lick Fork, Kentucky. Southeast Nat. 12:82–91.
- Ensign SH, Doyle MW. 2006. Nutrient spiraling in streams and river networks. J Geophys Res. 111:G04009.
- Ettinger-Dietzel SA, Dodd HR, Westhoff JT, Siepker MJ. 2016. Movement and habitat selection patterns of smallmouth bass (Micropterus dolomieu) in an Ozark river. J Freshwater Ecol. 31(1):61–75.
- Gerking SD. 1953. Evidence for the concepts of home range and territory in stream fishes. Ecology. 34(2):347–365.
- Gowans ARD, Armstrong JD, Priede IG. 1999. Movements of adult Atlantic salmon in relation to a hydroelectric dam and fish ladder. J Fish Biol. 54(4):713–726.
- Hansen BP, Reeves GH. 2008. Monitoring the effectiveness of culverts replaced or retrofitted for fish passage in the upper west fork of Smith River, Oregon. Corvalis (OR): Aquatic and Land Interactions Program, PNW Research Station.
- Helms BS, Werneke DC, Gangloff MM, Hartfield EE, Feminella JW. 2011. The influence of low-head dams on fish assemblages in streams across Alabama. J North Am Benthol Soc. 30(4):1095–1106.
- Hutchings JA, Gerber L. 2002. Sex-biased dispersal in a salmonid fish. Proc R Soc Lond B. 269(1508):2487–2493.
- Huusko R, Hyvarinen P, Jaukkuri M, Maki-Petays A, Orell P, Erkinaro J. 2018. Survival and migration speed of radio-tagged Atlantic salmon (Salmo salar) smolts in two large rivers: one without and one with dams. Can J Fish Aquat Sci. 75(8):1177–1184.
- Ivasauskas TJ. 2017. Early life history of suckers (Catostomidae) in a Southern Appalachian river system [unpublished doctoral dissertation]. Raleigh (NC): North Carolina State University.
- Jackson DA, Peres-Neto PR, Olden JD. 2001. What controls who is where in freshwater fish communities the roles of biotic, abiotic, and spatial factors. Can J Fish Aquat Sci. 58(1):157–170.
- Jungwirth M. 1996. Bypass channels at weirs as appropriate aids for fish migration in rhithral rivers. Regul Rivers: Res Mgmt. 12(4–5):483–492.
- Leasure DR, Magoulick DD, Longing S. 2016. Natural flow regimes of the Ozark-Ouachita Interior Highlands Region. River Res Appl. 32(1):18–35.
- Matheney MP. 1993. Movement patterns and habitat use by Northern Hog Suckers in the Current River, MO [unpublished master’s thesis]. Columbia (MO): University of Missouri.
- Matheney MP, Rabeni CF. 1995. Patterns of movement and habitat use by Northern Hog Suckers in an Ozark stream. Trans Am Fish Soc. 124(6):886–897.
- McIntyre PB, Flecker AS, Vanni MJ, Hood JM, Taylor BW, Thomas SA. 2008. Fish distributions and nutrient cycling in streams: can fish create biogeochemical hotspots? Ecology. 89(8):2335–2346.
- Modde T, Irving DB. 1998. Use of multiple spawning sites and seasonal movement by razorback suckers in the middle Green River, Utah. North Am J Fish Manag. 18(2):318–326.
- Mueller M, Pander J, Geist J. 2011. The effects of weirs on structural stream habitat and biological communities. J Appl Ecol. 48(6):1450–1461.
- Orndorff RC, Weary DJ, Sebela S. 2001. Geologic framework of the Ozarks of south-central Missouri. U.S. Geological Survey Karst Interest Group Proceedings, Water-Resources Investigations Report 01–4011. Reston, VA: US Geological Survey. p. 18–24.
- Perkin JS, Gido KB. 2012. Fragmentation alters stream fish community structure in dendritic ecological networks. Ecol Appl. 22(8):2176–2187.
- Perlman H. 2018. Heat capacity of water. [accessed 2019 May 1]. https://water.usgs.gov/edu/heat-capacity.html.
- Peterson JC, Justus BG, Dodd HR, Bowles DE, Morrison LW, Williams MH, Rowell GA. 2008. Methods for monitoring fish communities of Buffalo National River and Ozark National Scenic Riverways in the Ozark Plateaus of Arkansas and Missouri (Ver. 1). U.S. Geological Survey Open-File Report 2007-1302. 94 p.
- Pflieger AL. 1997. The fishes of Missouri (Revised ed.). Jefferson City, MO: Missouri Department of Conservation.
- Radinger J, Wolter C. 2014. Patterns and predictors of fish dispersal in rivers. Fish Fish. 15(3):456–473.
- Raney EC, Webster DA. 1942. The spring migration of the common white sucker Catostomus c. commersonnii (Lacepede), IN Skaneateles Lake Inlet, New York. Copeia. 1942(3):139–148.
- Santos JM, Ferreira MT, Godinho FN, Bochechas J. 2005. Efficacy of a nature-like bypass channel in a Portuguese lowland river. J Appl Ichthyol. 21(5):381–388.
- Schmutz S, Giefing C, Wiesner C. 1998. The efficiency of a nature-like bypass channel for pike-perch (Stizostedion lucioperca) in the Marchfeldkanalsystem. Hydrobiologia. 371/372:355–360.
- Scruton DA, Pennell CJ, Bourgeois CE, Goosney RF, Porter TR, Clarke KD. 2007. Assessment of a retrofitted downstream fish bypass system for wild Atlantic salmon (Salmo salar) smolts and kelts at a hydroelectric facility on the Exploits River, Newfoundland, Canada. Hydobiologia. 582(1):155–169.
- Summerfelt RC, Smith LS. 1990. Anesthesia, surgery, and related techniques. In: Schreck CB, Moyle PB, editors. Methods for fish biology. Bethesda (MD): American Fisheries Society. p. 213–272.
- Turner A. 2014. Fish gigging: an Ozark tradition. Missouri Conservationist Magazine. [Accessed 2018 Aug 29]. https://mdc.mo.gov/conmag/2014/09/fish-gigging-ozark-tradition.
- Ward JV, Stanford JA. 1995. The serial discontinuity concept: extending the model to floodplain rivers. Regul Rivers: Res Mgmt. 10(2–4):159–168.
- Warren ML, Pardew MG. 1998. Road crossings as barriers to small-stream fish movement. Trans Am Fish Soc. 127(4):637–644.
- Wells WG, Johnson TC, Gebhard AE, Paine RTR, Hix LA, Ferrell HN, Engle AN, Perkin JS. 2017. March of the sculpin: measuring and predicting short-term movement of Banded Sculpin Cottus carolinae. Ecol Freshw Fish. 26(2):280–291.
- Wilkerson Jr TF. 2003. Current river watershed inventory and assessment. West Plains, MO: Missouri Department of Conservation.