
Abstract
Age-0 lake whitefish Coregonus clupeaformis stomachs from western Lake Huron were examined in 2018 to evaluate spatial variation in feeding ecology. Overall, age-0 lake whitefish had narrow diet niches and similar feeding strategies across sites in western Lake Huron, with all sizes of age-0 lake whitefish specializing on one prey at each site, with some other prey eaten occasionally by most individuals as fish grew at some sites. Although prey selectivity and the dominant prey types varied among sites, feeding success was generally similar among sites for most sizes of fish. For fish collected in neuston nets (13–21 mm), food biomass per fish did not differ between Saginaw Bay and Thunder Bay for fish that had lost their yolk sac even though cyclopoid copepods were selected in Saginaw Bay and calanoid copepods were selected in Thunder Bay, suggesting that the type of copepod available to early stage age-0 lake whitefish might not be as important as previously thought. Fish from beach seines (20–51 mm) also had a narrow diet niche with a fair degree of diet specialization on calanoids, cyclopoids, or Bosmina, depending on site, along with generalized feeding on chironomid pupae at some sites. Selectivity patterns on zooplankton prey by larger age-0 fish followed patterns in prey availability, indicating the ability to adapt to prevailing prey conditions. Despite these spatial differences in prey importance, most fish had food in their stomachs and food biomass per fish did not differ among sites for most size groups, suggesting that variable diet patterns might not result in differential conditions for growth or survival of age age-0 lake whitefish. Adaptability in prey use might not entirely buffer age-0 lake whitefish from environmental variability, as we noted strong differences in both diet composition and feeding success among years (2014–2018) at the Monaghan Point site.
Introduction
Coregonines are a highly adaptable group of fish that is widely distributed in cold water lakes of North America, Europe and Asia. Across their range, coregonines are ecologically, culturally, and economically important (Brenden et al. Citation2010; Anneville et al. Citation2015). In Europe, coregonines provide one of the most valuable fisheries in many lakes dating back to the Middle Ages (Anneville et al. Citation2015). In turn, substantial effort has been put toward research, management, and stocking programs across Europe (Eckmann Citation2013; Anneville et al. Citation2015). Within North America, coregonines, particularly lake whitefish (Coregonus clupeaformis, Mitchill), have long provided an important fishery and cultural resource for Native American and First Nation Aboriginal Tribes and later for European settler communities (Brenden et al. Citation2010; Ryan and Crawford Citation2014). Lake whitefish is the most valuable component of the commercial fishery in the Laurentian Great Lakes, providing millions of dollars to the GNP in the United States and Canada (Ebener et al. Citation2008). For example, lake whitefish accounted for 81% of the commercial harvest in Lake Huron with annual average catches of 3.2 million kg during 2005–2010 (Ebener Citation2013) and a cumulative dockside value of $102 million USD during 1994–2004 (Ebener et al. Citation2008).
Worldwide, threats to coregonine populations include eutrophication, acidification, supplemental stocking and overfishing (Vonlanthen et al. Citation2012; Eckmann Citation2013; Anneville et al. Citation2015). More recently, as nutrient inputs are reduced to control anthropogenic eutrophication, there is evidence that re-oligotrophication of European lakes led to declining growth and yield of coregonines (Eckmann Citation2013). In the Laurentian Great Lakes, yields of lake whitefish have historically undergone periodic fluctuations in response to various stressors (Ebener et al. Citation2008). Favorable environmental conditions for reproduction combined with management actions including invasive sea lamprey (Petromyzon marinus, Linnaeus) control efforts, harvest management, habitat restoration, and pollution control helped lead to a population resurgence in the 1980s (Ebener et al. Citation2008; Brenden et al. Citation2010). However, in the early 2000s, declines in growth, condition, and recruitment of lake whitefish were associated with reductions in primary and secondary production that occurred following reduced nutrient loading, filtering activities by invasive dreissenid mussels and the near complete loss of the benthic amphipod Diporeia, which had been an important food item (Nalepa et al. Citation2005; Ebener et al. Citation2008; Brenden et al. Citation2010). Modelling results in Lake Huron indicate that declining growth and recruitment of lake whitefish have reduced the harvest that can be sustainably removed from the lake (Gobin et al. Citation2015, Citation2016).
Year class strength for lake whitefish is set during the embryonic or larval stages (Taylor et al. Citation1987; Freeberg et al. Citation1990; Muir et al. Citation2010). Environmental changes can have a disproportionate effect on early life stages of fish and declining productivity could lead to elevated mortality or reduced growth for lake whitefish larvae (Claramunt, Muir, Johnson, et al. Citation2010; Claramunt, Muir, Sutton, et al. Citation2010; Muir et al. Citation2010; Hoyle et al. Citation2011; Ryan and Crawford Citation2014). While elevated growth during the larval phase can enhance cohort size (Eckmann Citation2013), food shortage is considered a source of enhanced mortality for coregonines (Naesje et al. Citation1986; Karjalainen Citation1992; Rellstab et al. Citation2004), including lake whitefish (Taylor and Freeberg Citation1984; Taylor et al. Citation1987; Freeberg et al. Citation1990; Claramunt, Muir, Sutton, et al. Citation2010). Therefore, a better understanding of early life feeding ecology of age-0 lake whitefish is needed to understand the bottlenecks for recruitment of this species.
Understanding spatial variability in fish feeding ecology could provide insight into differential growth and survival of young fish within large ecosystems. Previous work in the Great Lakes has demonstrated spatial variation in diets within a lake for age-0 yellow perch (Perca flavsecens, Mitchill) (Roswell et al. Citation2013; Happel et al. Citation2015). Similarly, Claramunt, Muir, Johnson, et al. (Citation2010) documented that the frequency of occurrence of prey types and the number of prey per stomach for juvenile lake whitefish differed among sites in Lake Michigan and Superior. However, considerably less effort has been given toward understanding spatial variation in feeding ecology of age-0 lake whitefish within large lakes compared to the amount of effort that has been focused on understanding ontogenetic shifts in feeding (Claramunt, Muir, Johnson, et al. Citation2010; Pothoven et al. Citation2014, Pothoven Citation2020).
The first objective of this study was to evaluate the spatial variation in early life feeding ecology of age-0 lake whitefish in western Lake Huron. To achieve this objective, diet composition, feeding success (measured as the proportion of fish with food in their stomachs and the amount of food in stomachs), feeding strategy (i.e., generalist or specialist), niche width and prey selectivity were determined for larval and juvenile lake whitefish in 2018. A second objective was to understand inter-annual variation in feeding ecology to help put the 2018 findings into a temporal context. To achieve this objective, diet composition, feeding success and niche width were determined for age-0 lake whitefish at one site where data was collected each year during 2014–2018.
Methods
Age-0 lake whitefish were collected by the United States Fish and Wildlife Service personnel during larval coregonine surveys in Lake Huron (). Early stage larval lake whitefish were collected with neuston nets (1 m depth × 2 m width × 3 m length, 500-µm mesh) in Saginaw Bay and Thunder Bay during 2018 (see ). Site depths where neuston tows were done were 4–13 m in Saginaw Bay (average = 8 m) and 3–11 m in Thunder Bay (average = 5 m). Fish were available for analysis from five to nine neuston tows in each region during each sampling date. Later stage age-0 lake whitefish were collected with beach seines (45.7 m length × 1.8 m height with a 1.8 m × 1.8 m × 1.8 m bag and 3.2-mm delta mesh) at four sites in 2018 (), and during 2014–2018 at the Monaghan Point site (). Fish were collected on multiple dates from some sites during some years (see ). Fish were either stored in ethanol (neuston nets) or frozen (beach seines).
Figure 1. Map of Lake Huron showing locations of the two neuston sampling regions (Saginaw Bay and Thunder Bay) and four beach seine sampling sites (Monaghan Point, North Point, Tawas, Port Austin).
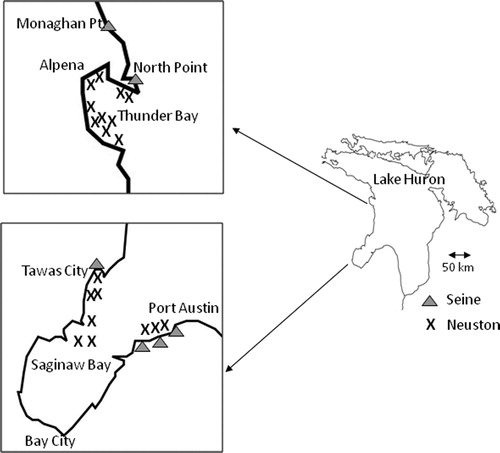
Table 1. Dates that neuston sampling took place in Saginaw Bay and Thunder Bay in 2018, number of tows, average abundance of larval lake whitefish (#/m3), percentage of fish with food in stomachs, sample size, and total length (mm) for larval lake whitefish with and without yolk sacs during each sampling event.
Table 2. Sampling dates, number of age-0 lake whitefish examined for diet analysis, number of fish with food in their stomach, mean total length (mm), and average catch of age-0 lake whitefish per seine haul for each beach seine sampling date during 2018 at four sites and at the Monaghan Point site during 2014–2017.
Zooplankton were collected during each sampling date in 2018 at two to six neuston sampling sites in each region and with each beach seine sampling effort using a 0.3 m diameter × 0.9 m long, 64-µm mesh zooplankton net. At neuston sampling sites, the net was lowered to just above bottom and retrieved by hand at approximately 0.5 m/s. At beach seine sites, the net was towed by hand off to the side of an individual standing in water about 0.5 m deep for a distance of 50 m. Zooplankton were narcotized and preserved using ethanol.
In the laboratory, total length of lake whitefish was measured and the entire digestive tract was removed and the contents were identified and enumerated. Whole prey organisms and partial organisms with heads attached were counted as individuals. Zooplankton were classified as Calanoida, Cyclopoida, Daphniidae, Bosminidae, and other zooplankton (Chydoridae, Harpacticoida, Sididae, copepod nauplii, Polyphemus pediculus). Additional prey groups included Chironomidae pupae, benthic invertebrates (mostly Chironomidae larvae, as well as Amphipoda, Ostracoda, and Ephemeroptera), and other (terrestrial and emergent insects). No dreissenid veligers were eaten and they not included in analyses. Lengths of whole organisms were measured using Image Pro (V. 9.1). Weight–length regressions were used to estimate the mean dry mass for each prey type from stomachs (Hawkins and Evans Citation1979; Nalepa and Quigley Citation1980; Culver et al. Citation1985; Benke et al. Citation1999), which was then multiplied by the total number of that respective prey to determine its dry mass contribution to the diet for each fish. For zooplankton analysis, the whole sample was counted or a subsample was taken with a Hensen-Stemple pipette so that at least 600 organisms (if available) were counted and identified to species.
Analysis of similarities (ANOSIM) was used to test for differences in diet assemblages (based on dry mass) across sites during 2018 and across years at the Monaghan Point site. For neuston data, all individual diets were combined across all dates within each region to compare Saginaw Bay and Thunder Bay diet assemblages. For seine data, individual diets from multiple sampling events at a site within a given year were combined to provide a single diet assemblage for ANOSIM analysis. ANOSIM is analogous to ANOVA, with a non-parametric permutation applied to a rank similarity matrix of samples (Clarke and Warwick Citation2001). Diet mass was square root transformed to down-weight highly abundant species (Clarke and Warwick Citation2001) and was used to create a Bray-Curtis similarity matrix for ANOSIM. R-values from ANOSIM range from −1 to +1, and generally lie between 0, where groups (i.e., sites) are indistinguishable and +1, where all similarities within groups are less than any similarity between groups (Clarke and Gorley Citation2001). R-values values provide a measure of separation, with R-values <0.25 indicating almost no separation between groups, R-values of 0.25–0.5 indicating slight separation, R-values of 0.5 to 0.75 indicating moderate separation, and R-values >0.75 indicating clear separation between groups (Clarke and Gorley Citation2001, Citation2006). R-values were used rather than P-values from ANOSIM tests because this is the most useful measure of separation among groups (Clarke and Gorley Citation2001, Citation2006). ANOSIM was performed using Primer v 5.2.9.
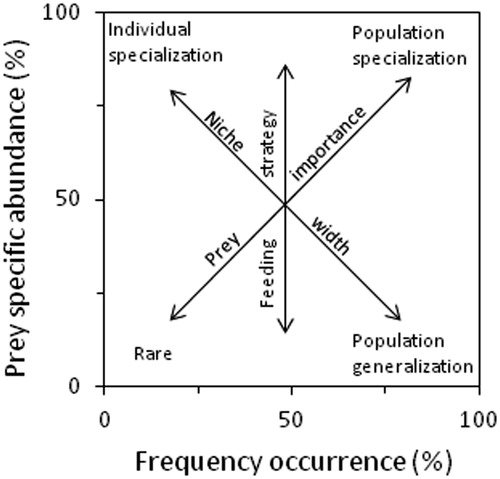
To evaluate the feeding strategy of age–0 lake whitefish in 2018, an approach proposed by Amundsen et al. (Citation1996) was used, where the prey specific abundance is plotted against the frequency of occurrence (see ). Prey specific abundance is the percentage (by number) that a prey type composes of all prey in only those fish where that particular prey occurs (Amundsen et al. Citation1996). The diagonal from lower left to upper right corner provides a measure of prey importance, with dominant prey in the upper right and rare prey in the lower left. The vertical axis represents the feeding strategy of the predator in terms of specialization and generalization. Predators specialize on prey types on the upper half of the plot, whereas prey types on the lower half of the plot represent a generalized feeding strategy. Prey points in the upper left indicate specialization by individuals whereas points in the upper right indicate a dominant prey of the overall population. If there are no points in the upper right and all points are located along or below the diagonal from the upper left to lower right, the predator will have a broad niche width (Amundsen et al. Citation1996). This graphical analysis was only done for fish collected in 2018, because corresponding zooplankton data was available to help interpret results. Niche width was also calculated using the standardized Levins’ index, BA, which ranges from 0 (narrow niche) to 1 (wide niche; Hurlbert Citation1978).
Figure 2. Feeding strategy diagram based on Amundsen et al. (Citation1996) showing feeding strategy based on plots of prey specific abundance as a function of prey frequency of occurrence.
Selectivity of various zooplankton groups was determined with the selectivity coefficient W’ (Vanderploeg and Scavia Citation1979) using zooplankton numbers for both diets and the environment from each respective date and site in 2018. Only zooplankton prey were considered for selectivity because prey availability was not known for other prey types. However, this analysis should provide reasonably accurate insight into selectivity patterns for the size of lake whitefish that were collected because 99% and 93% of prey eaten (by number) from neuston and seine caught fish, respectively, were zooplankton. The selectivity coefficient W’ varies between 0 for no ingestion of a prey type to 1, the value for the most preferred prey type(s). Selectivity was calculated for each individual fish and the percentage of fish that preferred a particular prey item above all other prey, i.e., the number of times W’ = 1 for that prey type, was determined.
To evaluate feeding success, we used both the percentage of fish with food in their stomachs, as well as the biomass of food per fish (see Fortier et al. Citation1995). For fish collected in the neuston nets, the dry food biomass per fish determined from diet counts and prey lengths (see above) was natural log transformed and compared between regions with ANCOVA, after first checking for interactions between the covariate (fish length) and factor (region). For fish collected in the seines, there were interactions between fish length and region and different size ranges of fish were available in some instances, so ANCOVA could not be used. We instead chose to compare the biomass of food per fish for 10-mm size groups, i.e., 20–29 mm, 30–39 mm, and 40–49 mm across sites for 2018 and across years for the Monaghan Point site. Biomass of food per fish for each size group was examined separately using ANOVA, with a Tukey’s HSD test for pair wise comparisons. Both ANOVA and ANCOVA were done using SYSTAT 13. Fish without food in stomachs were excluded from these analyses.
Results
Neuston sampling
A total of 267 fish were collected in neuston nets in 2018. Fish ranged in length from 13 to 17 mm in Saginaw Bay and 13–21 mm in Thunder Bay. Of these fish, 23% and 48% still had yolk sacs in Thunder Bay and Saginaw Bay, respectively (). For fish with yolk sacs, the percentage of fish with food in their stomachs was variable between regions and sampling dates, ranging from 17% to 90% (). For fish without yolk sacs, most fish had food in their stomachs in both regions, with percentages ranging from 92 to 100% (). The biomass of food per fish (including fish with and without yolk sacs) did not differ between regions (ANCOVA, F1, 175 = 0.60, P = 0.44), with mean values (back-transformed, adjusted for length) of 14.6 and 16.0 µg per fish in Saginaw Bay and Thunder Bay, respectively.
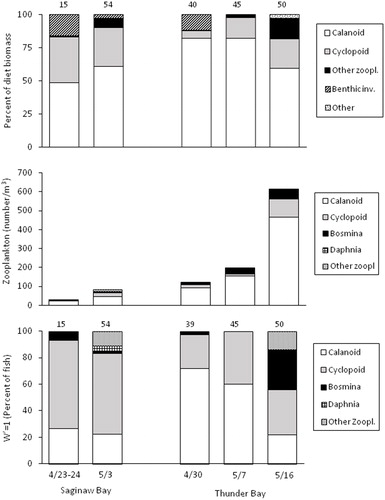
Diet composition (% dry weight) at both Thunder Bay and Saginaw Bay was dominated by copepods (). Calanoid copepods accounted for most of the diet at Thunder Bay, whereas a combination of calanoid and cyclopoid copepods composed most of the diet at Saginaw Bay. Benthic invertebrates, all small chironomid larvae, accounted for 16 and 12% of the diet biomass on the first sampling date in both Saginaw Bay and Thunder Bay, respectively. R-values from ANOSIM were 0.16, indicating essentially no separation in diet assemblages between the two regions.
Figure 3. Diet composition (top, % dry weight), zooplankton abundance (middle, by number), and percent of fish that selected (i.e., W’=1, bottom) each zooplankton prey type for age-0 lake whitefish that were collected in neuston nets in 2018. Number above bars is the number of fish with food in their stomach (top panel) or number of fish that ate zooplankton (bottom panel).
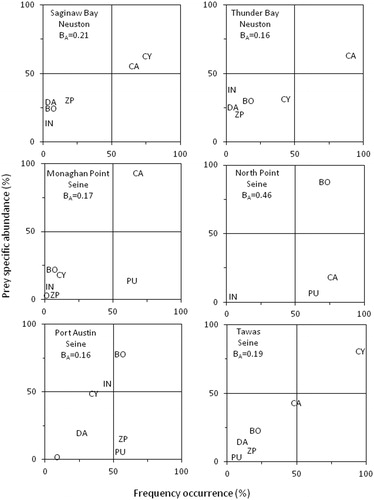
Feeding strategy plots indicated that cyclopoid and calanoid copepods were both dominant prey items in Saginaw Bay, whereas in Thunder Bay, only calanoid copepods were a dominant prey at the population level (). The plots also indicated that early stage larval lake whitefish had fairly specialized diets with relatively narrow diet niches. The narrow diet niches were confirmed by the adjusted Levins’ niche index, which was 0.21 and 0.13 in Saginaw Bay and Thunder Bay, respectively.
Figure 4. Feeding strategy plots (prey specific abundance on a percent number basis plotted against frequency of occurrence, Amundsen et al. Citation1996) for age-0 lake whitefish collected in neuston nets and seines in 2018. The diagonal from lower left to upper right corner provides a measure of prey importance, with dominant prey in the upper right and unimportant prey in the lower left. The vertical axis represents the feeding strategy of the fish in terms of specialization (upper part of plot) and generalization (lower part of plot). Prey points in the upper left indicate specialization by individuals whereas points in the upper right indicate a dominant prey of the overall population (Amundsen et al. Citation1996). CY = Cyclopoida, CA = Calanoida, BO = Bosminidae, DA = Daphniidae, ZP = other zooplankton, IN = benthic invertebrates, PU = chironomid pupae, O = other. Levin’s adjusted niche BA is also provided on each plot.
The zooplankton assemblage in both regions was dominated (by number) by calanoid copepods, which accounted for 56–79% of total zooplankton abundance (). Overall, total zooplankton abundance was generally lower in Saginaw Bay than in Thunder Bay, with abundance increasing with each successive sampling effort within both regions. Nauplii and dreissenid veligers, which were rarely or not eaten by larval lake whitefish, respectively, are not shown in . Overall abundances for nauplii were 31 and 400/m3 in Saginaw Bay and Thunder Bay, respectively, whereas abundances of veligers were 5 and 249/m3 in the same two regions.
Despite their low abundance (<18/m3), cyclopoid copepods were most frequently the highest selected zooplankton in Saginaw Bay (). By contrast, in Thunder Bay, where cyclopoid abundances were comparable or even higher than in Saginaw Bay, calanoid copepods were most frequently the highest selected zooplankton on the first two sampling dates, and a combination of calanoids, cyclopoids, and Bosmina were most highly selected on the third sampling date ().
Seine sampling-2018 spatial analysis
A total of 181 fish were collected in beach seines in 2018 (). These fish ranged in length from 20 to 51 mm, with an average length of 34 mm. None of the fish collected in the seine had a yolk sac.
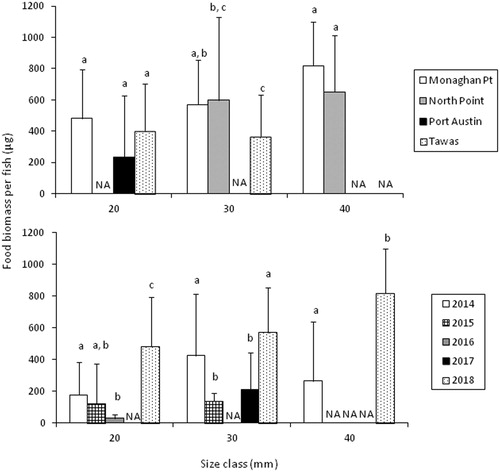
All fish examined had food in their stomachs in 2018 (). Food biomass per fish did not differ among sites for the 20 mm size group (ANOVA, P = 0.14) or the 40 mm size group (P = 0.09), but there was a significant difference among sites for the 30 mm size group (F2, 73=4.01, P = 0.02), due to lower food biomass per fish at Tawas compared to Monaghan Point ().
Figure 5. Mean (SD) food biomass (dry) for three size classes (i.e., 20–29 mm, 30–39 mm, 40–49 mm) of age-0 lake whitefish across four seine sites in 2018 (top panel) and during 2014–2018 at the Monaghan Point site (bottom panel). Values within each size group that share a letter were not significantly different (Tukey’s HSD). NA = not available.
Diet composition (% dry weight) indicated that lake whitefish collected in beach seines in 2018 primarily consumed different zooplankton groups and chironomid pupae, depending on the site and date (). Cyclopoid copepods were only important in diets at the Tawas site, whereas calanoid copepods were important at each site on at least one date except at Port Austin. The category, “benthic invertebrates”, which was primarily chironomid larvae, was only important at Port Austin in 2018. In 2018, ANOSIM indicated that there was a range of separation in diet assemblages, with the least separation between the two northern sites, Monaghan Point and North Point (R = 0.26), and the most separation between the two southernmost sites, Tawas and Port Austin (R = 0.75, ).
Figure 6. Diet composition (top, % dry weight), zooplankton abundance (middle, by number), and percent of fish that selected (i.e., W’=1, bottom) each zooplankton prey type for age-0 lake whitefish that were collected in beach seines in 2018. Number above bars is the number of fish with food in their stomach (top panel) or number of fish that ate zooplankton (bottom panel).
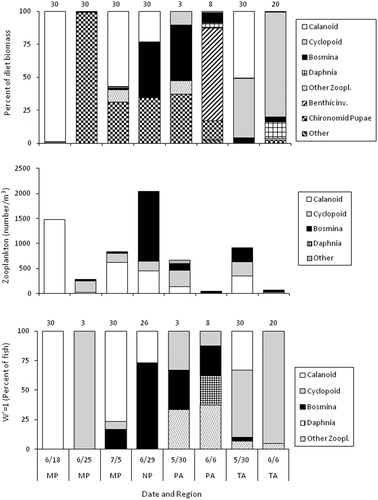
Table 3. R-values from ANOSIM analysis comparing age-0 lake whitefish diet assemblages between four sites during 2018 beach seine sampling and between years at the Monaghan Point site during 2014–2018.
Feeding strategy plots from 2018 indicated a mixed feeding strategy with some degree of population specialization and generalization in each region (). Calanoid copepods were the dominant prey at Monaghan Point, cyclopoid copepods at Tawas, and Bosmina at North Point and Port Austin. Chironomid pupae were a generalized prey, fed on by most fish but only accounting for a small part of the diet of these fish, at Monaghan Point, North Point, and Port Austin, but not at Tawas. There was little individual specialization in any region. The feeding strategy plots also generally indicated a narrow diet niche, with some prey falling into the upper right quadrant of each plot (). The adjusted Levins’ index was consistent with feeding strategy plots for 2018, with BA values indicating a narrow feeding niche, with values between 0.16 and 0.19 except at Port Austin, where BA=0.46 ().
There was a fair degree of variation in zooplankton abundance among sites in 2018, with abundance (by number) ranging from 2,045/m3 at North Point to <67/m3 at Tawas and Port Austin on June 6, 2018 (). Calanoid copepods were the dominant prey at Monaghan Point, whereas Bosmina were most important at Thunder Bay. At Port Austin and Tawas, a combination of cyclopoid, calanoid, and Bosmina accounted for most of the zooplankton, with Daphnia also contributing at Port Austin. Two prey that were not eaten by lake whitefish that were collected in seines, nauplii and dreissenid veligers, had relatively high abundance at some sites and would have combined for 65–99% of the zooplankton had they been included in community composition analysis. Nauplii abundance ranged between 65 and 7,396/m3 and veliger abundance ranged between 153 and 69,830/m3.
The zooplankton prey that was most frequently the highest selected zooplankton during 2018 varied among sites, with calanoid copepods most frequently selected at Monaghan Point (except on June 25 when few fish ate zooplankton), Bosmina at North Point, cyclopoid copepods at Tawas, and a mixture of all zooplankton prey groups other than calanoid copepods at Port Austin ().
Seine sampling-Monaghan Point 2014–2018
A total of 361 fish were collected in beach seines at the Monaghan Point site during 2014–2018 (). These fish ranged in length from 18 to 70 mm, with an average length of 31 mm. Overall, 97–100% of fish had food in their stomachs during each year at Monaghan Point except in 2015, when only 80% of fish had food in their stomachs. Food biomass per fish differed among years for the 20, 30, and 40 mm size groups (ANOVA, P < 0.001), but trends among years were not consistent among size groups (). However, it appeared that food biomass per fish was relatively high during 2018 compared to other years.
Diet composition (% dry weight) indicated that lake whitefish collected in beach seines at Monaghan Point primarily consumed calanoid copepods and chironomid pupae, depending on the year (). One exception was 2015, when the prey group “other” which was primarily emergent insects and adult chironomids, was important. ANOSIM indicated that differences in diet assemblages among year ranged from moderate (R = 0.70, 2016–2018) to no separation (R = 0.15, 2014–2018) ().
Figure 7. Diet composition (top, % dry weight) of age-0 lake whitefish that were collected in beach seines during 2014–2018 at the Monaghan Point site. Number above bars is the number of fish with food in their stomach.
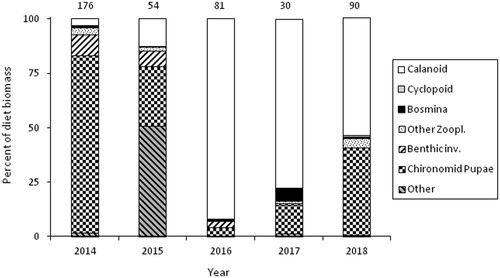
The adjusted Levins’ index indicated a narrow feeding niche for all years at Monaghan Point, with BA values of 0.06, 0.26, 0.03, 0.07, 0.17, in 2014, 2015, 2016, 2017, and 2018, respectively.
Discussion
Overall, age-0 lake whitefish had narrow diet niches and similar feeding strategies across sites in western Lake Huron, with population specialization for early stage age-0 lake whitefish and a mixed strategy of population specialization with some generalization for larger age-0 lake whitefish. However, despite similar feeding strategies and diet niche widths, there was considerable variation in prey selectivity and importance across sites for both early and late stage age-0 lake whitefish. However, it appeared that these differences in prey selectivity and importance did not necessarily result in large differences in feeding success across sites, with most fish having food in their stomachs and few differences in food biomass per fish occurring across sites. Therefore, it appears that although dietary patterns might differ across sites within a large lake, these differences might reflect adaptability to environmental conditions and not necessarily result in differential conditions for growth or survival age age-0 lake whitefish.
Saginaw Bay is located at the mouth of the Saginaw River, the tributary with the highest phosphorus loading to Lake Huron (Dolan and Chapra Citation2012). Therefore, one might expect that fish feeding success would be higher for fish from Saginaw Bay than from other regions due to higher productivity in the region (Cha et al. Citation2011). However, fish in this study were collected from the outer regions of the bay, which has distinct limnological conditions from inner Saginaw Bay. Inner Saginaw Bay is located at the mouth of the Saginaw River, the largest tributary source of nutrients for Lake Huron (Dolan and Chapra Citation2012). However, nutrients are rapidly diluted between the inner bay and outer bay, and outer bay conditions are more reflective of the main basin of Lake Huron (Dai et al. Citation2019). The proliferation of invasive dreissenid mussels in inner Saginaw Bay further limits the export of nutrients into the outer bay and main basin (Cha et al. Citation2011). Although Thunder Bay was eutrophic in the 1970s (Basch et al. Citation1980), it is currently oligotrophic as well. Spring chlorophyll a concentrations in 2017 were 0.25 and 0.18 µg/l in outer Saginaw Bay and Thunder Bay, respectively (S. Pothoven, unpublished data) and there was no evidence from our 2018 sampling that zooplankton abundance was higher in Saginaw Bay than in other areas during either neuston or seine sampling efforts. Furthermore, there was no strong evidence that intra-specific competition was stronger in Saginaw Bay due to higher lake whitefish abundances (see and ).
Copepods accounted for >78% of the available zooplankton prey during the early spring when lake whitefish hatch, so it is not surprising that early larval lake whitefish had a narrow prey niche that specialized on copepod prey in both Saginaw Bay and Thunder Bay. Cyclopoid copepods are considered an important prey for the early stages of larval coregonines because they are small and more easily captured than calanoid copepods (Anneville et al. Citation2011) and other studies in the Great Lakes have demonstrated that lake whitefish specialize on cyclopoid copepods during their early ontogeny (Pothoven et al. Citation2014; Pothoven Citation2020). In turn, previous studies have found that access to cyclopoid copepods could be critical for larval lake whitefish growth and survival during a bottleneck period around 15–16 mm when the yolk sac has disappeared and exogenous feeding is required (Hoyle et al. Citation2011; Pothoven et al. Citation2014; Pothoven Citation2020). However, these studies were conducted in areas where cyclopoid copepods were the most abundant prey available for the early stages of lake whitefish. By contrast, in this study, calanoid copepods were the most abundant prey available and accounted for 48–61% of the diet biomass for early stage fish from Saginaw Bay and 59–82% for fish from Thunder Bay.
Few field studies have examined lake whitefish feeding ecology in systems where calanoid copepods dominated over cyclopoid copepods, although Teska and Behmer (Citation1981) indicated that in the laboratory, 14–18 mm lake whitefish selected calanoid copepods over cyclopoids when calanoid copepods were a relatively abundant available prey. In our study, calanoids were the most abundant zooplankton available for early stage fish (56–79% of zooplankton), with abundances higher in Thunder Bay than in Saginaw Bay. Cyclopoid copepods were available in both regions, but only accounted for 6–16% of zooplankton, with abundance at Thunder Bay similar to or higher than in Saginaw Bay. However, cyclopoids were the most frequently selected prey for 61–66% of early stage fish in Saginaw Bay compared to 26–40% in Thunder Bay, where calanoids were most frequently selected except during the last week of sampling in the region, when there was no clearly preferred prey. Even though different types of copepods were selected in each region, there was no difference between Saginaw Bay and Thunder Bay in the amount of food eaten per fish or in the percentage of empty stomachs for fish that had lost their yolk sac, suggesting that the type of copepod available to early stage age-0 lake whitefish might not be as important as previously thought.
For later stage fish collected in the seine, the prey niche width was still generally narrow and fish had mixed diet strategies including varying degrees of population specialization and generalization. For each of the areas examined in 2018, a zooplankton group was a dominant prey that was eaten by most fish and accounted for most of the diet for these fish (by number). Chironomid pupae, on the other hand, were a generalized prey in three of the four areas examined, with most fish eating this prey, but with a low overall contribution to the diet for those fish (by number). A narrow feeding niche and high population specialization indicates that fish depend on a limited prey grouping and are vulnerable to fluctuations in these prey. However, the fact that the narrow feeding niche encompassed different prey groups among regions indicates that late larval lake whitefish could adapt their feeding strategy to prevailing conditions. For example, at Monaghan Point, calanoid copepods were the primary zooplankton available, and in turn, were the most frequently selected zooplankton prey and accounted for most of the diet biomass along with chironomid pupae. Similar results were observed at North Point, where Bosmina were the primary zooplankton available, the most selected zooplankton, and a major component of the diet biomass along with chironomid pupae. At the Port Austin site, few zooplankton were available for the date when fish were caught in 2018 (June 6), and in turn, no one zooplankton prey was most frequently selected, and benthic invertebrates, mostly chironomid larvae, accounted for most of the diet biomass. Interestingly, however, at the Tawas site, cyclopoid copepods were the most frequently selected prey even though Bosmina were equally abundant, and cyclopoid copepods accounted for most of the diet biomass in the region. The continued importance and selection for cyclopoid copepods when they are available even for late larval age-0 lake whitefish has also been noted in southern Lake Michigan (Pothoven Citation2020).
The ability to use different prey depending on conditions appears important for late stage larval fish, considering they often relied on cladoceran zooplankton (i.e., Bosmina, Daphnia) and emergent chironomid pupae, whose availability depends on environmental conditions. Water temperature plays a role in both the emergence of cladocerans from resting eggs as well as the emergence of chironomid pupae, which are only available for a short time period (Wallace and Anderson Citation1996; Vandekerkhove et al. Citation2005). Spring water temperatures can have a strong influence on zooplankton development and peak abundance, with impacts varying across zooplankton groups (Winder and Schindler Citation2004). Adaptability in prey use might not entirely buffer age-0 lake whitefish from environmental variability, as we noted strong differences in both diet composition and feeding success among years at the Monaghan Point site.
Two small prey, copepod nauplii and dreissenid veligers, were relatively abundant but were rarely or not eaten, respectively, by age-0 lake whitefish. These prey would have combined for a substantial portion of the zooplankton community had they been included in community composition calculations, especially during seine sampling when they would have combined for 65–99% of the total zooplankton by number. Although coregonines will eat small prey if they are abundant (Ponton and Müller Citation1990; Selgeby et al. Citation1994) and lake whitefish should have been capable of retaining both prey types based on gill raker spacing (Pothoven Citation2020), these prey were essentially absent in the diets at all our Lake Huron sites. Other studies have found that both European whitefish and lake whitefish rarely ate nauplii regardless of availability (Freeberg et al. Citation1990; Anneville et al. Citation2007; Hoyle et al. Citation2011). Although larvae of other fish species in Lake Michigan eat dreissenid veligers, possibly offsetting reductions in consumption of other prey (Wither et al. Citation2015), age-0 lake whitefish did not consume veligers in a study that took place in southeastern Lake Michigan either (Pothoven Citation2020).
Across sites in western Lake Huron, both late and early stage age-0 lake whitefish had narrow diet niche widths, feeding strategies that focused largely on a single prey, and in general, similar feeding success, but the prey that were selected and important at each site differed. However, inter-annual variation in both prey importance and feeding success, indicate that a better understanding of feeding ecology should provide insight into the conditions that are favorable for growth and survival. Future work with additional samples within and across lakes would help provide insight into how various environmental variables, such as fish density and food abundance and types, ultimately, affect the recruitment of age-0 lake whitefish to the fishery under current ecosystem conditions.
Acknowledgements
J. Elliott provided support in the laboratory. The use of trade, product, or firm names is for descriptive purposes only and does not imply endorsement by the U.S. Government. The findings and conclusions in this article are those of the authors and do not necessarily represent the views of the U.S. Fish and Wildlife Service. This GLERL contribution number 1955.
Data availability statement
Data is available at NOAAs National Center for Environmental Information at https://accession.nodc.noaa.gov/0210611, and from the author upon reasonable request.
Disclosure statement
No potential conflict of interest was reported by the author(s).
Additional information
Funding
Notes on contributors
Steven Pothoven
Steven Pothoven is a fishery biologist with the NOAA Great Lakes Environmental Research Laboratory. His research is focused on lower food web trends and the ecology of fish and macroinvertebrates in the Great Lakes.
Chris Olds
Chris Olds is a fish biologist with the USFWS Alpena Fish and Wildlife Conservation Office. His research is focused on morphology and early life history of coregonines in the Great Lakes.
References
- Amundsen PA, Gabler HM, Staldvik FJ. 1996. A new approach to graphical analysis of feeding strategy from stomach contents data–modification of the Costello (1990) method. J Fish Biol. 48:607–614.
- Anneville O, Laine L, Benker S, Ponticelli A, Gerdeaux D. 2007. Food habits and ontogenetic changes in the diet of whitefish larvae in Lake Annecy. Bull français de la Pêche et de la Piscic. 387:21–33.
- Anneville O, Berthon V, Glippa O, Mahjoub M-S, Molinero JC, Souissi S. 2011. Ontogenetic dietary changes of whitefish larvae: insights from field and experimental observations. Environ Biol Fish. 91(1):27–38.
- Anneville O, Lasne E, Guillard J, Eckmann R, Stockwell JD, Gillet C, Yule DL. 2015. Impact of fishing and stocking practices on coregonid diversity. Food Nutr Sci. 6:1045–1055. http://dx.doi.org/10.4236/fns.2015.611108.
- Basch RE, Pecor CH, Waybrant RC, Kenaga EE. 1980. Limnology of Michigan’s nearshore waters of Lakes Superior and Huron. EPA-600/3-80-059.
- Benke AC, Huryn AD, Smock LA, Wallace JB. 1999. Length-mass relationships for freshwater macroinvertebrates in North America with particular reference to southeastern United States. J N Amer Benthol Soc. 18(3):308–343.
- Brenden TO, Ebener MP, Sutton TM, Jones ML, Arts MT, Johnson TB, Koops MA, Wright GM, Faisal M. 2010. Assessing the health of lake whitefish populations in the Laurentian Great Lakes: lessons learned and research recommendations. J Great Lakes Res. 36 (Suppl. 1):135–139.
- Cha Y, Stow CA, Nalepa TF, Reckhow KH. 2011. Do invasive mussels restrict offshore phosphorus transport in Lake Huron? Environ Sci Technol. 45(17):7226–7231.
- Claramunt RM, Muir AM, Johnson J, Sutton TM. 2010. Spatio-temporal trends in the food habits of age–0 lake whitefish. J Great Lakes Res. 36:66–72.
- Claramunt RM, Muir AM, Sutton TM, Peeters PJ, Ebener MP, Fitzsimmons JD, Koops MA. 2010. Measures of larval lake whitefish length and abundance as early predictors of year–class strength in Lake Michigan. J Great Lakes Res. 36:8–91.
- Clarke KR, Gorley RN. 2001. Primer v5: user manual/tutorial. Plymouth (UK): Primer-E-Ltd.
- Clarke KR, Gorley RN. 2006. Primer v6: user manual/tutorial. Plymouth (UK): Primer-E-Ltd.
- Clarke KR, Warwick RM. 2001. Changes in marine communities: an approach to statistical analysis and interpretation, Primer-E. 2nd ed. Plymouth (UK): Primer-E-Ltd.
- Culver DA, Boucherle MM, Bean DJ, Fletcher JW. 1985. Biomass of freshwater crustacean zooplankton from length-weight regressions. Can J Fish Aquat Sci. 42(8):1380–1390.
- Dai Q, Bunnell DB, Diana JS, Pothoven SA, Eaton L, O'Brien TP, Kraus RT. 2019. Spatial patterns of rainbow smelt energetic condition in Lakes Huron and Erie in 2017: evidence for Lake Huron resource limitation. J Great Lakes Res. 45(4):830–839. https://doi.org/10.1016.j.jglr.2019.06.001.
- Dolan DM, Chapra SC. 2012. Great Lakes total phosphorus revisited: 1. Loading analysis and update (1994–2008). J Great Lakes Res. 38(4):730–740.
- Ebener MP. 2013. Status of whitefish and ciscoes. In: Riley SC, editor. The state of Lake Huron in 2010. Ann Arbor (MI): Great Lakes Fishery Commission Special Publication; p. 29–35.
- Ebener MP, Kinnunen RE, Schneeberger PJ, Mohr LC, Hoyle JA, Peeters P. 2008. Management of commercial fisheries for lake whitefish in the Laurentian Great Lakes of North America. In: Schechter MG, Leonard NJ, Taylor WW, editors. International Governance of Fisheries Ecosystems: learning from the past, finding solutions for the future. Bethesda (MD): American Fisheries Society; p. 99–143.
- Eckmann R. 2013. A review of the population dynamics of coregonids in European alpine lakes. Adv Limnol. 64:3–24.
- Fortier L, Ponton D, Gilbert M. 1995. The match/mismatch hypothesis and the feeding success of fish larvae in ice-covered southeastern Hudson Bay. Mar Ecol Prog Ser. 120:11–27.
- Freeberg MH, Taylor WW, Brown RW. 1990. Effect of egg and larval survival on year-class strength of lake whitefish in Grand Traverse Bay, Lake Michigan. Trans Amer Fish Soc. 119(1):92–100.
- Gobin J, Lester NP, Cottrill A, Fox MG, Dunlop ES. 2015. Trends in growth and recruitment of Lake Huron lake whitefish during a period of ecosystem change, 1985–2012. J Great Lakes Res. 41(2):405–414.
- Gobin J, Lester NP, Fox MG, Dunlop ES. 2016. Effects of changes in density-dependent growth and recruitment on sustainable harvest of lake whitefish. J Great Lakes Res. 42(4):871–882.
- Happel A, Creque S, Rinchard J, Höök T, Bootsma H, Janssen J, Jude D, Czesny S. 2015. Exploring yellow perch diets in Lake Michigan through stomach content, fatty acids, and stable isotope ratios. J Great Lakes Res. 41 (Supplement 3):172–178. http://dx.doi.org/10.1016/j.jglr2015.03.025.
- Hawkins BE, Evans MS. 1979. Seasonal cycles of zooplankton biomass in southeastern Lake Michigan. J Great Lakes Res. 5(3–4):256–263.
- Hoyle JA, Johannsson OE, Bowen KL. 2011. Larval lake whitefish abundance, diet and growth and their zooplankton prey abundance during a period of ecosystem change on the Bay of Quinte, Lake Ontario. Aquat Ecosyst Health Manag. 14(1):66–74.
- Hurlbert SH. 1978. The measurement of niche overlap and some relatives. Ecology. 59(1):67–77.
- Karjalainen J. 1992. Food ingestion, density-dependent feeding and growth of vendace (Coregonus albula (L.) larvae. Ann Zool Fenn. 29:93–103.
- Muir AM, Sutton TM, Arts MT, Claramunt RM, Ebener MP, Fitzsimons JD, Johnson TB, Kinnunen RE, Koops MA, Sepúlveda MM. 2010. Does condition of lake whitefish spawners affect physiological condition of juveniles? J Great Lakes Res. 36:92–99. https:/doi.org/10.1016/j.jglr.2009.07.006.
- Naesje TF, Sandlund OT, Jonsson B. 1986. Habitat use and growth of age-0 whitefish, Coregonus lavaretus, and cisco, C. albula. Environ Biol Fish. 15:309–314.
- Nalepa TF, Quigley MA. 1980. The macro- and meiobenthos of southeastern Lake Michigan near the mouth of the Grand River, 1976–1977. Ann Arbor (MI): NOAA. NOAA Data Report ERL GLERL-17.
- Nalepa TF, Mohr LC, Henderson BA, Madenjian CP, Schneeberger PJ. 2005. Lake whitefish and Diporeia spp. in the Great Lakes: an overview. In: Mohr L, Nalepa TF, editors. Proceedings of a workshop on the dynamics of lake whitefish (Coregonus clupeaformis) and the amphipod Diporeia spp. in the Great Lakes. Great Lakes Fishery Commission Technical Report; p. 3–19.
- Ponton D, Müller R. 1990. Size of prey ingested by whitefish, Coregonus sp. larvae. Are Coregonus larvae gape–limited predators? J Fish Biol. 36(1):67–72.
- Pothoven SA, Höök TO, Roswell CR. 2014. Feeding ecology of age-0 lake whitefish in Saginaw Bay, Lake Huron. J Great Lakes Res. 40:148–155. https://doi.org/j.jglr.2013.09.016.
- Pothoven SA. 2020. The influence of ontogeny and prey abundance on feeding ecology of age-0 lake whitefish (Coregonus clupeaformis) in southeastern Lake Michigan. Ecol Freshw Fish. 29(1):103–111. https://doi.org/10.1111/eff.12498.
- Rellstab C, Bürgi HR, Müller R. 2004. Population regulation in coregonids: the significance of zooplankton concentration for larval mortality. Ann Zool Fenn. 41:281–290.
- Roswell CR, Pothoven SA, Höök TO. 2013. Spatio-temporal, onogenetic and interindividual variation of age-0 diets in a population of yellow perch. Ecol Freshw Fish. 22(3):479–493.
- Ryan KM, Crawford SS. 2014. Distribution and abundance of larval lake whitefish (Coregonus clupeaformis) in Stokes Bay, Lake Huron. J Great Lakes Res. 40(3):755–762. https://doi.org/10.1016/j.jglr.2014.05.008.
- Selgeby JH, MacCallum WR, Hoff MH. 1994. Rainbow smelt-larval lake herring interactions: competitors or casual acquaintances? National Biological Survey. U.S. Department of the Interior. Biological Report 25.
- Taylor WW, Freeberg MH. 1984. Effect of food abundance on larval lake whitefish, Coregonus clupeaformis Mitchill, growth and survival. J Fish Biol. 25(6):733–741. https://doi.org/10.1111/j.1095-8649.1984.tb04919.x.
- Taylor WW, Smale MA, Freeberg MH. 1987. Biotic and abiotic determinants of lake whitefish (Coregonus clupeaformis) recruitment in northeastern Lake Michigan. Can J Fish Aquat Sci. 44 (Suppl. 2):313–323.
- Teska JD, Behmer DJ. 1981. Zooplankton preference of larval lake whitefish. Trans Am Fish Soc. 110(3):459–461. https://doi.org/10.1577/1548-8659(1981)110<459:ZPOLLW>2.0CO;2.
- Vandekerkhove J, Declerck S, Brendonck LUC, Conde-Porcuna JM, Jeppesen ERIK, Meester LD. 2005. Hatching of cladoceran resting eggs: temperature and photoperiod. Freshw Biol. 50(1):96–104.
- Vanderploeg HA, Scavia D. 1979. Two electivity indices for feeding with special reference to zooplankton grazing. J Fish Res Bd Can. 36(4):362–365. https://doi.org/10.1016/0304-3800(79)90004-8.
- Vonlanthen P, Bittner D, Hudson AG, Young KA, Müller R, Lundsgaard-Hansen B, Roy D, Di Piazza S, Largiader CR, Seehausen O. 2012. Eutrophication causes speciation reversal in whitefish adaptive radiations. Nature. 482(7385):357–362.
- Wallace JB, Anderson NH. 1996. Habitat, life history, and behavioral adaptations of aquatic insects. In: Merritt RW, Cummins KW, editors. An introduction to the aquatic insects of North America. Dubuque (IA): Kendall/Hunt; p. 41–73.
- Winder M, Schindler DE. 2004. Climate effects on the phenology of lake processes. Global Change Biol. 10(11):1844–1856.
- Wither JL, Sesterhenn TM, Foley CJ, Troy CD, Hook TO. 2015. Diets and growth potential of early stage larval yellow perch and alewife in a nearshore region of southeastern Lake Michigan. J Great Lakes Res. 41(Supplement 3):197–209.