
Abstract
One of the most difficult aspects of studying intact amphibian communities is that they tend to occupy isolated areas within inaccessible terrain—factors that both protect watersheds from development and disturbance while also making them difficult to study. We conducted an extensive survey of the freshwater herpetofauna of the remote King Range National Conservation Area in Northern California using a combination of visual encounter surveys and environmental DNA (eDNA) sampling. We found twelve species of native aquatic amphibians and the western pond turtle (Actinemys marmorata), and no introduced amphibians. Detection probabilities for the four most commonly encountered species, giant salamanders (Dicamptodon sp), foothill yellow-legged frogs (Rana boylii), western toads (Anaxyrus boreas), and black salamanders (Aneides flavipunctatus), were affected by substrate and canopy cover, but the effects of these habitat characteristics on detection probability were species specific. Neither survey method, visual encounter surveys nor eDNA sampling, was more effective than the other, and our study suggests that the use of visual encounter surveys in conjunction with eDNA sampling may counteract the shortcomings of either when done individually. Five species were found using both methods, seven were only encountered during visual encounter surveys, and one recorded only from eDNA sampling. DNA samples from two taxa, toads and giant salamanders, could not be resolved to species. Toad species identity was assigned to the only member of the candidate species with a species range known to overlap the study area; the other three candidate species occupy restricted ranges far from the study area. Neither of the two giant salamander candidate species have known species ranges overlapping the study area. One, the California giant salamander (D. ensata), is known to occur within 100 km. However, there is a paucity of genetic material in GenBank DNA library for both the California giant salamander and the coastal giant salamander (D. tenebrosus), a widely distributed species with a range overlapping the study area, which could lead to inaccurate assignment of eDNA fragments.
Introduction
Amphibians have recently been recognized as the world’s most endangered class of animals. If trends continue, we could see as many as one third of amphibian species going extinct over the next 50 years, putting their extinction rate between 25,000 and 45,000 times higher than the background extinction rate (McCallum Citation2007). The cause of these rapid declines is multifaceted and has been linked to stochastic events, climate change, disease, habitat loss, and human interference (Collins and Storfer Citation2003; Stuart et al. Citation2004; Alford and Richards Citation1999). As pressure from anthropogenic stressors becomes increasingly common, it becomes more difficult to collect baseline information from healthy amphibian communities.
One of the challenges to studying intact amphibian communities is that the factors protecting them from habitat loss and degradation—isolation and inaccessible terrain—are the same factors that make them difficult to study. The Bureau of Land Management (BLM) King Range National Conservation Area (KRNCA) in Humboldt County, California, exemplifies this challenge. Aptly named the “Lost Coast”, it is largely inaccessible by car or foot. In 1974, increased logging and agricultural development in the Pacific Northwest prompted the Secretary of the Interior to set aside 63,000 acres of land to form the KRNCA, protecting the pristine forests and waterways of the area (BLM, Morgan and Cannon Citation2004). Located over 250 km north of the nearest metropolitan area (San Francisco, CA) and over 50 km from the nearest town with a population larger than 15,000 (Eureka, CA), the KRNCA remains isolated from urban and suburban development pressures. Few roads access the Mattole River along the eastern edge of the KRNCA; none cross the ocean-draining watersheds within it.
Most scientific knowledge about the amphibian community within the King Range is provided by studies focused on the Mattole River watershed (Welsh and Hodgson Citation1997, Citation2011; Welsh et al. Citation2005). However, only 10% of the streams studied in this research were located within the KRNCA, and we are aware of no published surveys including any of the ocean-draining streams of this area. The advent of widespread citizen science applications, such as iNaturalist, only serves to further highlight the paucity of data for this remote and rugged region.
The cryptic and secretive nature of stream-dwelling amphibians poses a number of challenges for herpetologists. While visual encounter surveys (VES) are traditionally an effective method for determining the presence of amphibians (Welsh and Hodgson Citation1997; Welsh et al. Citation2005), the riparian habitats of many species are hard to survey due to steep stream slope and overgrown vegetation. Molecular survey methods such as environmental DNA (eDNA) sampling have recently become a valuable tactic to overcome the shortcomings of visual encounter surveys (Halstead et al. Citation2018; Lopes et al. Citation2017; Rees et al Citation2014). While this method has been primarily used with fish in the past, there has been success in employing this technique for detecting aquatic freshwater amphibians (Halstead et al. Citation2018; Pilliod et al Citation2013). Frogs and salamanders shed genetic material into the water, leaving molecular traces of their presence and allowing us to examine waterborne DNA samples to determine whether these species are present (Thomsen and Willerslev Citation2015).
While eDNA has been used in an exponentially increasing number of studies over the last 20 years (Jiang and Yang Citation2017), a recent meta-analysis of the field found that only 49 out of more than 500 studies made comparisons of eDNA surveys with traditional survey techniques (Fediajevaite et al Citation2021). Even fewer studies compare eDNA results with visual encounter surveys. This leaves a sizable gap in information, and makes increasing studies of this type a necessity.
There are complications for both visual encounter surveys and eDNA surveys (Fediajevaiteet al Citation2021; Schütz et al. Citation2020; Thomsen and Willerslev Citation2015; Pilliod et al Citation2013). VES rely heavily on observer ability to locate and identify organisms. This can be hindered by difficult terrain, observer error, and adverse conditions. On the other hand, eDNA is reliant on biological material in the watershed, which is contingent on the amount of water, the number of organisms present, and other factors that dilute the sample to the point where it provides no reliable data. However, in areas where visual detection is very difficult, eDNA can be an effective tool, and combining this technique with VES allows us to collect a more accurate account of species diversity than would be possible using VES alone.
The biodiversity of the King Range area is largely unknown, and the isolated nature of the area provides us with an opportunity to study how conservation efforts have influenced biodiversity. With this goal in mind, we combined traditional VES and modern eDNA techniques to conduct a comprehensive study of amphibian biodiversity in the King Range Conservation Area.
Methods
Study system
The Lost Coast area consists of some of the most rugged terrain in California. The majority of the streams in this study consist of extremely steep rocky slopes descending from mountain peaks to the Pacific Ocean or Mattole River, with the summit of the highest peak, the 1,246 meter King Peak, less than 5 km from the ocean. Likewise, the weather and tidal fluctuations are extreme. The only access to much of the area is to travel along the Lost Coast Trail, and large stretches of this trail are only accessible at low tide, a few hours a day. Weather changes rapidly. Winter storms frequently make the area inaccessible for weeks at a time, and summer days often start with dense fog in the mornings and high temperatures in the afternoon, with unexpected rain showers.
The inaccessability of the terrain and unpredictability of the weather have ensured the ecosystem has remained largely unaltered. Peaks are primarily covered with native douglas fir, with coastal grassland plains closer to the ocean. Streams consist of varying amounts of vegetation cover from wide open stream beds to fully covered steep narrow channels.
Fauna of the KRNCA consists of a diverse variety of native wildlife, including large predators such as black bears, mountain lions and river otters, nearly 300 species of migratory and non-migratory birds, fish, and a variety of aquatic and terrestrial reptiles and amphibians.
Our study focused on aquatic amphibians specifically. The diversity of habitat (variations in slope, canopy cover, vegetation, substrate, water flow), creates an excellent environment to foster animals with a wide variety of habitat preferences. Deep pools provide habitat for giant salamanders (Dicamptodon) and newts (Taricha), and the high humidity levels and rain cover allow many other species to breed. This area also provides breeding habitat for threatened frog species such as the Northern red legged frog (R. aurora), and the foothill yellow-legged frog (R. boylii), as well as western toads, chorus frogs, and tailed frogs (Center for Biological Diversity, Citation2016).
Visual surveys
The study was conducted in Humboldt County, California from 30 May 2021 to 10 August 2021 in 29 streams in the King Range National Conservation Area, Sinkyone Wilderness State Park, and surrounding area (). Sites were located in the Mattole River watershed (n = 7) or streams draining directly into the ocean (n = 22). We accessed streams feeding into the ocean by hiking into the site along the beach, while streams feeding into the Mattole River were accessed by hiking along BLM trails. Two teams of 1 to 4 people surveyed each site along a distance of 100 m to 1 km, contingent on the accessibility of the stream. Teams moved upstream to avoid clouding the water flow and startling individuals, which could result in double counts. We conducted surveys with the intent to maximize the number of amphibians seen during the survey by turning over rocks and debris in the water and along the bank of the stream. Individuals were identified to species based on visual characteristics and published species ranges overlapping the study area. Using Garmin eTrex Venture GPS (Garmin LLC; Olathe, Kansas) we noted the position of each amphibian we saw, along with life stage (larva, juvenile, adult). As we were assessing the presence or absence of each species, we counted each isolated group of tadpoles as one sighting. Continuous groups of tadpoles were counted as one.
Figure 1. Study area maps. Left: Distribution of Dicamptodon spp. observations between San Francisco and the California-Oregon border reported on iNaturalist as of January 17, 2022. The study area corresponds to the gap in coastal observations outlined in black. Right: Survey sites included in this study (n = 29).
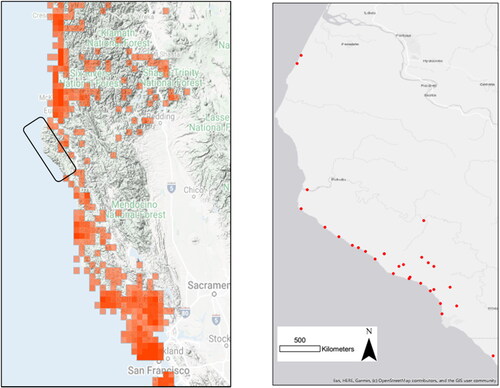
The survey distance for each reach established in the first pass was used for the subsequent passes. Teams completed three passes of each site, with the surveyors assigned randomly to each team to avoid bias. The order of sites surveyed was shuffled randomly for each pass, with survey passes of the same site spaced a minimum of two weeks apart to allow the ecosystem to recover from any disturbance. Surveys were conducted during the day between the hours of 8 am and 5 pm, excluding days of rain. All equipment and shoes were decontaminated using 6% diluted bleach solution between surveys.
Environmental DNA (eDNA)
At each site, we collected eDNA samples at starting and ending locations during the final visual encounter survey, with all samples collected upstream of the surveyors to minimize contamination by silt and human DNA in the stream. Water samples were taken mid-flow with a 60 mL syringe. The water was pushed through a 1.0 µm nylon filter attached to the syringe until the filter was entirely clogged with particulate matter and no water passed through. A single syringe of air was subsequently pushed through the filter to dry the collected material. We then used 1 mL of tris-EDTA preservative to fix DNA samples on the filter. The filter was removed from the syringe and placed in a sterile bag. We recorded the amount of water used for the sample, GPS coordinates of the sample and the site ID. Samples were sent to Jonah Labs (Jonah Ventures; Boulder, Colorado) for processing using next generation sequencing (NGS) for all amphibians and targeted qPCR specifically for foothill yellow-legged and northern red-legged frogs. The full laboratory methods are described in the Supporting material section.
Habitat analysis
We conducted a habitat survey of all sites. At 5 points evenly spaced along the survey area, we measured canopy cover and substrate. We measured canopy cover from the center of the stream using a smart-phone app ((NikhilPatel, "CanopyCapture" Version 1.0.2 (2018); University of New Hampshire, "CanopyApp" Version 1.0.3 (2018)). We established six classes of substrate based on the particle diameter: sand (0–2 mm), gravel (2 mm–1 cm), pebbles (1 cm–5 cm), cobble (5 cm–15 cm), rock (15 cm–1 m) and boulder (>1 m), characterizing substrate at each point as the one or two substrate classes composing the majority of the stream bottom. We calculated slope as the difference in elevation between the start and end of the survey stretch divided by the Euclidean distance between the points. We obtained elevations from one meter digital elevation maps downloaded from the USGS (https://apps.nationalmap.gov, 2021).
An additional note on canopy apps: Landert (Citation2016) ran an extensive analysis of the effectiveness of smartphone canopy cover apps in comparison to traditional densiometers, finding that phone-based canopy cover apps consistently underestimate canopy cover. For our study we analyzed canopy cover data on a continuum (high cover vs. low cover), so we obtained our results using the same apps consistently, and reproduction of this study would require the same apps to analyze cover. When conducting a quantitative canopy cover analysis, a traditional densiometer would provide more accurate results.
Data analysis
We conducted an occupancy analysis to estimate overall detection rates and assess the influence of survey type, survey effort and local habitat variables on detection probabilities (MacKenzie et al. Citation2002). We conducted separate analyses for each species observed at a minimum of five survey sites: coastal giant salamanders (Dicamptodon tenebrosus), foothill yellow-legged frogs (Rana boylii), black salamanders (Aneides flavipunctatus), and western toads (Anaxyrus boreas). For each of these four species, we fit occupancy models to detection/non-detection data from the three visual surveys and combined eDNA samples.
Occupancy models treat detection/non-detection data as a hierarchical process that considers the probability that a species is present as a function of site characteristics, as well as the probability that the species is detected (given that it is present), as a function of site characteristics, survey effort and survey type. We evaluated six site characteristics as potentially influencing site occupancy for each species: length of stream surveyed (survey distance), average slope, average canopy cover, percent of stream bed covered by sand, percent of stream bed covered by large substrates (rocks & boulders), and percent of stream bed covered by boulders alone. We also considered five variables that might influence detection rates: survey type (VES vs. eDNA sampling), survey distance (a measure of effort), average canopy cover, percent of substrate covered by medium sized substrates (gravel, pebbles or cobble), percent of substrate covered by large substrates, and percent of substrate covered by boulders.
For each of the four focal species, we initially created four global models for presence and detection including all variables save percent covered by large substrate and percent covered by boulders. These two variables are not independent, therefore each global model included only one in the detection (boulder for foothill yellow legged frog and giant salamander, large substrate for western toad and black salamander) and occupancy functions (boulder for western toad, large substrate for all other species). For black salamanders, only VES data were used and the global models did not include survey type because no eDNA was detected from this species. We fit each model using maximum likelihood methods as implemented in package “unmark”, run in R 4.05 (Fiske and Chandler Citation2011), and chose the model with the lowest Akaike Information Criterion (AIC) value to carry forward (Akaike Citation1973). We next eliminated the variable in the occupancy function that had the least support in the model, i.e., with the lowest absolute value z-scores associated with the corresponding parameter estimate, and refit the model. In some cases, variable removal resulted in a model that could not be fit to the data. In this instance, we removed the variable with the next lowest z-score. In every case, the previously identified least supported variable was also poorly supported in the next step and was eventually removed. We continued this process until the removal of any remaining variable resulted in a significantly worse fit (i.e., the model with a variable removed had an AIC score >2.0 higher than the same model including the variable). This model was considered the best occupancy model. We repeated the process with the global detection model coupled with the best occupancy model to determine the best detection model containing only models in the detection function that were significant at the p = 0.05 level or the removal of any remaining variable resulted in a significantly worse fit.
We assessed the validity of the best overall model by comparing it with the global model and two null models: an occupancy null model which assumed no variables influenced site occupancy, coupled with the best detection model, as well as a detection null model which assumed no variables influenced detection, coupled with the best occupancy model. Because small data sets are easily overfit, we applied a correction factor to AIC scores for this final comparison: AICc = AIC + (2k2 – 2k)/(n – k – 1) where k is the number of parameters in the model and n the sample size, which we set equal to the number of survey sites (n = 29).
Results
A total of thirteen species were found at least one site in the study area (), consisting of 7 salamanders, 5 frogs, and 1 turtle. Twelve species were observed during visual encounter surveys, and six species were detected from eDNA samples.
Table 1. List of species included in survey with the number of sites where each species was detected based on visual encounter surveys (VES) or eDNA sampling (eDNA).
Most eDNA fragments matched only a single species with a reported species range overlapping the study area. However, all DNA segments matching Anaxyrus and Dicamptodon were resolved only to genus level. We found a total of 7 Anaxyrus sequences with a 98.5%–100% match to four possible species: the western toad (A. boreas), Sierra Nevada toad (A. canorus), black toad (A. exsul), and Amargosa toad (A. nelsoni). Three of these species (A. canorus, A. exsul, and A. nelsoni) have highly restricted ranges separated from the study site by hundreds of kilometers and the California Central Valley, which poses a severe barrier to dispersal. We therefore assumed that the sequences belonged to A. boreas, which has a species range overlapping the study area, and was positively identified during visual encounter surveys.
We found a total of 24 Dicamptodon sequences with an 89.0%–94.1% match to two possible species, the Idaho giant salamander (D. aterrimus) and the California giant salamander (D. ensatus). The known species range for the Idaho giant salamander is restricted to parts of Western Montana, Idaho and eastern Washington, separated from our study site by over 500 km and multiple geographic dispersal barriers including the Great Basin Desert (Stebbins Citation1985; AmphibiaWeb Citation2011). We therefore ruled it out as a likely correct match. The known species range for the California giant salamander also does not overlap with the study area, but populations are known from within 100 km with no major gaps in suitable habitat posing a significant dispersal barrier (AmphibiaWeb Citation2011; Petranka Citation1998; Lannoo Citation2005).
All Dicamptodon individuals encountered during visual encounter surveys were larval or neotenic adults. The only species of giant salamander with a known range encompassing the King Range area is the coastal giant salamander (D. tenebrosus), however visual differentiation between the two northern California Dicamptodon species (D. tenebrosus and D. ensatus) can be difficult. While some reports indicate differences in color pattern and slight differences in morphology, the best method is to differentiate the species by their differing ranges (Stebbins and McGinnis Citation2012; AmphibiaWeb Citation2011; Nafis Citation2000). We therefore cannot rule out D. ensatus as a possible correct match for the Dicamptodon eDNA sequences collected.
The vast majority (23/29) of species identifications from eDNA samples corresponded to species observed at the same site during at least one visual survey. Four species were detected at one or more creeks only from eDNA samples. One species, the red-bellied newt (Taricha rivularis) was only detected from eDNA samples. At two creeks, eDNA revealed the presence of 1–2 amphibian species despite no amphibians being detected during visual encounter surveys. In contrast, six species detected during visual encounter surveys were not represented in any eDNA samples (excluding turtles, which were not tested for).
Foothill yellow-legged frogs (R. boylii) were detected at 5 sites using both targeted qPCR and NGS methods, and 4 sites only using qPCR sequencing. R. boylii was detected at one site through eDNA only, and 6 sites only during visual encounter surveys.
Occupancy analysis
Estimated stream occupancy of the four most commonly observed aquatic amphibians ranged from 26% for western toads to 80% for giant salamanders (). Estimated occupancy was higher than observed occupancy for western toads and black salamanders, but not for foothill yellow-legged frogs or giant salamanders. For all four species, the lower 95% confidence limit of estimated occupancy was less than the observed proportion of streams in which the species was detected.
Figure 2. Estimated stream occupancy and upper 95% confidence limit of four most commonly observed aquatic amphibian species in the King Range National Conservation Area, California.
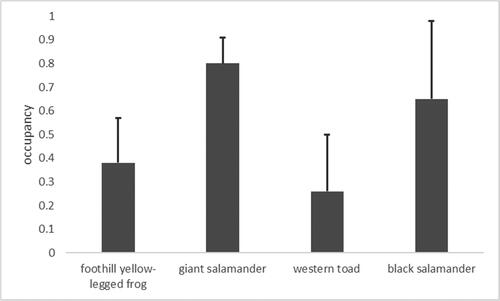
Habitat characteristics influenced detection probability for each of the four most commonly observed species (). Stream substrate and canopy cover affected detection probability for multiple species, and both variables had opposing effects for different species (). Foothill yellow-legged frogs and black salamanders were less likely to be detected in occupied streams that were primarily composed of medium or large diameter substrates, while giant salamanders were more commonly detected in occupied streams with a large boulder component. Similarly, canopy cover was associated with lower western toad detection rates, but higher giant salamander detection rates. The top model for each species included an effect of survey type or length of stream surveyed at a site (or both) on detection probability. Despite significantly improved fits of models including survey type and/or survey distance compared to corresponding models without these variables, the effects were not significantly different from zero in any model we examined.
Table 2. Comparison table for occupancy and detection models of the four most commonly observed species in the King Range National Conservation Area; foothill yellow-legged frog, coastal/California giant salamander, western toad, and black salamander.
Table 3. Most supported occupancy and detection models for the four most commonly observed species in the King Range National Conservation Area; foothill yellow-legged frog, coastal/California giant salamander, western toad, and black salamander.
Discussion
The King Range National Conservation Area and surrounding areas contain a vibrant and intact stream-dwelling amphibian community. During our survey, we found evidence for all stream dwelling amphibians native to the study area. There were three primarily terrestrial amphibians native to our study range that we did not detect, none of which are expected to be encountered during stream searches (Welsh and Hodgson Citation1997). Notably, we did not find evidence of any invasive amphibians, including the American bullfrog (Lithobates catesbeianus). Bullfrogs have been introduced throughout the Western United States through various methods including stocking of fish ponds, and once introduced, can move rapidly through waterways (Adams and Pearl Citation2007). When present, bullfrogs pose significant threats to native amphibians through predation and competition (Kupferberg Citation1997; Moyle Citation1973). The absence of L. catesbeianus, as well as the remarkable diversity of this area, exemplifies the potential for isolation from development and disturbance to promote healthy populations of native amphibians.
The river continuum theory (Vannote et al. Citation1980) proposes that in an ecosystem with limited anthropogenic impacts, natural hydrological processes create an equilibrium of diverse ecosystems and habitats along the course of a river, from steep densely-covered slopes and boulders close to the river head, and wider open channels closer to the mouth (Vannote et al. Citation1980; Kupferberg Citation1996). This allows organisms to coexist nested hierarchically in the same river, with different available habitats keeping populations stable. This is a key factor for ascertaining the health of a watershed - where the river has been dammed, dredged, or otherwise altered, we see disturbance of this balance (Kupferberg Citation1996; Williams et al Citation1989).
Several factors we analyzed in our occupancy analysis are tied together in the function of the riverine ecosystem as a whole, primarily substrate and canopy cover. As water travels down the course of the stream, it erodes substrate resulting in a decrease of rock size from boulder to sand, as well as a change in vegetation and a widening of the stream (Vannote et al. Citation1980). This creates a habitat gradient from dark narrow channels in the upper reaches of the stream, and wider broader open channels in the lower reaches where the watercourse reaches the ocean.
Consistent with expectations, our results give us an idea of how species at multiple trophic levels partition habitat to distribute themselves throughout the length of a stream. Giant salamanders (Dicamptodon), the highest of our focal species in the food web, prey on all the other focal species (Lind and Welsh Citation1990; Rundio and Olsen 2001; Parker Citation1994; Bury Citation1972), but are also subject to predation by snakes and river otters, both of which were observed feeding on them during the course of the study. It follows, therefore, that these large salamanders would survive best in habitat with large boulders for cover, both to facilitate their predation of smaller stream-dwelling animals, and to allow them to avoid larger predators. Likewise, thermal tolerance plays a part in distribution of species along the river gradient. Fast-flowing water with high cover provides a colder environment for Dicamptodon, which prefer cooler temperatures (Bury Citation2008).
Contrary to giant salamanders, yellow-legged frogs (R. boylii) were most commonly detected in streams with smaller substrate, generally associated with wider, warmer channels close to the stream mouth. These frogs thrive in warmer temperatures than giant salamanders (Catenazzi and Kupferberg Citation2017), and warm temperatures and slower water flow are associated with higher breeding success rates in this species (Kupferberg Citation1996). Likewise,western toads (A. boreas) and black salamanders (A. flavipunctatus) were found in areas with less cover and smaller substrate respectively, both associated with lower reaches on streams. Toad larvae and black salamanders of all life stages are subject to high predation rates from giant salamanders and others (Bury Citation1972), and as warmer temperatures increase breeding success, smaller substrate allows better camouflage and protection for larva (Kupferberg Citation1996, Bury Citation1972).
Employing a combination of eDNA sampling and VES benefits from the strengths and minimizes the limitations of each method used alone. The relative effectiveness of traditional and eDNA surveys is likely to vary across species (Moss et al. Citation2022). Furthermore, the most effective technique may change depending on the timing or environmental context of a survey. For example, the sensitivity of eDNA surveys is often related to standing biomass (Thomsen and Willerslev Citation2015), such that detection rates are greater when tadpoles are close to emergence than earlier in the spring and summer (Peek et al., Citation2019). Likewise, visual encounter surveys for many frogs are most effective earlier in the year, when adults are breeding and eggs are present in conspicuous clusters (Van Hattem et al. Citation2021; USFWS 2005). Environmental conditions such as water temperature influence both VES, by modifying animal behaviors (Bancroft et al Citation2008), and eDNA surveys, by affecting DNA degradation rates (Burian et al. Citation2021; Goldberg et al Citation2018). Visual encounter surveys also rely on well-trained surveyors, while eDNA samples are easily collected by citizen scientists (Biggs et al. Citation2015), provided volunteers are careful not to cross-contaminate samples.
Regardless of survey methods used, it is important to consider how local habitat characteristics influence detection probability, particularly for habitat features that have different effects for different species. For example, boulders and large stones provide cover for larval coastal giant salamanders and are positively associated with local abundance (Dudaniec and Richardson Citation2012). Since detection probability is correlated with abundance (Royle and Nichols Citation2003), it follows that detection rates for giant salamanders will likely be higher in occupied streams where more of the substrate is composed of rocks and boulders, as we found in our study. In contrast, rocks and boulders make good hiding places (Lynch Citation1974) without increasing local abundances of species like foothill yellow legged-frogs, which breed in areas with large cobble (Van Hattem et al. Citation2021) or the largely terrestrial black salamander (Petranka Citation1998). Consequently these substrates might be expected to reduce detection probabilities for these species.
Our eDNA results highlight an underappreciated limitation of eDNA surveys: data gaps in the eDNA library. The wide range of genome coverage among the species included in our survey is indicated by differences in the number and length of sequences cataloged in GenBank (). Some species such as bullfrogs, Pacific chorus frogs, and rough-skinned newts, are well represented, such that any DNA strands from these species collected during our survey would have matched a published sequence. Other species were less well characterized, but still had their entire mitochondrial DNA sequence represented (black salamanders and southern torrent salamanders). If their DNA was present in our samples, it was likely they would have been identified if an amplification primer targeted a mitochondrial sequence. On the other hand, most species were significantly underrepresented, with orders of magnitude fewer sequences available for comparison. This was the case for the unresolved Anaxyrus species group and for the two northern California Dicamptodon species. The inclusion of the Idaho giant salamander (D. aterrimus) as a false positive, and omission of the coastal giant salamander (D. tenebrosus), possibly as a false negative, may be due to the relatively good coverage of the former—its entire mitochondrial DNA sequence is cataloged—and relatively poor coverage of the latter .
The potential influence of data gaps in the DNA library on NGS biodiversity surveys has received little attention in literature. Numerous papers have discussed possible biases caused by contamination or lab-generated errors in sequencing, but the influence of data gaps in DNA libraries has received considerably less attention (Thomsen and Willerslev Citation2015). While it is recognized that coverage gaps may lead to some taxa being understudied (Thomsen and Willerslev Citation2015), we are not aware of any previously published papers acknowledging the potential for variable coverage within a taxonomic group to bias survey results.
One way to address the gaps in the DNA library is to develop species specific primers for each potential species of interest. The specificity of qPCR techniques often makes them more sensitive than NGS analyses, particularly for rare species (Moss et al. Citation2022). There are exceptions, however. While we found eDNA evidence of foothill yellow-legged frog presence in twice as many locations using qPCR as using NGS, our only positive match for northern red-legged frogs was by using NGS. Likewise, Moss et al. (Citation2022) found no difference in the sensitivity to California red-legged frogs (R. draytonii) between qPCR and NGS.
Using both traditional visual surveys and eDNA sampling, we were able to conduct a thorough assessment of the King Range National Conservation Area, information that will be invaluable for conservation and preservation of this pristine area. These techniques also provide an effective method of survey that allows citizen scientists to conduct eDNA surveys in their parks and back yards. Differences in species life histories and in local environmental conditions likely to affect the effectiveness of any particular survey technique or combination of techniques. Our survey shows that the most effective way to characterize the diversity of an area is to conduct repeated surveys using multiple methods. However, by continuing to add available amphibian DNA sequences, we can increase the power of these techniques, reduce false positives, and gain valuable insight into the presence and distribution of aquatic amphibians.
Author contribution statement
Conceptualisation: BRH. Developing methods: BRH, EM, MB. Data analysis: BRH, EM, LT, MEB, MB Preparation of figures and tables: BRH, LT. Conducting the research, data interpretation, writing: BRH, EM, LT, MEB, MB.
Acknowledgments
We thank the Bureau of Land Management Arcata Field Office and King Range National Conservation Area for their support, with particular thanks to Z. Ruddy and M. Holt. We thank M. Van Hattem for his insights and encouragement. An additional thank you to Barb Murphy, Micah, Xavier, and their family for help in the field.
Data availability
All data used in this study available upon request to the authors.
Conflict of Interest
No conflicts of interest that would affect objectivity existed for any author in this manuscript.
Additional information
Funding
References
- Adams MJ, Pearl CA. 2007. Problems and opportunities managing invasive bullfrogs: is there any hope?. In: Gherardi F. Biological invaders in inland waters: Profiles, distribution, and threats. Dordrecht: Springer.
- Akaike H. 1973. Information theory as an extension of the maximum likelihood principle. In: Petrov BN and Csaki F. Second International Symposium on Information Theory. Budapest: Akademiai Kiado; p. 276Á281.
- Alford RA, Richards SJ. 1999. Global amphibian declines: a problem in applied ecology. Annu Rev Ecol Syst. 30(1):133–165.
- AmphibiaWeb 2011. Dicamptodon aterrimus: Idaho Giant Salamander. https://amphibiaweb.org/species/3864.
- Bancroft BA, Baker NJ, Searle CL, Garcia TS, Blaustein AR. 2008. Larval amphibians seek warm temperatures and do not avoid harmful UVB radiation. Behav Ecol. 19(4):879–886.
- Bureau of Land Management. Programs: National Conservation Lands: California: King Range National Conservation Area. https://www.blm.gov/programs/national-conservation-lands/california/king-range-national-conservation-area.
- Biggs J, Ewald N, Valentini A, Gaboriaud C, Dejean T, Griffiths RA, Foster J, Wilkinson JW, Arnell A, Brotherton P, et al. 2015. Using eDNA to develop a national citizen science-based monitoring programme for the great crested newt (Triturus cristatus). Biol Conserv. 183:19–28.
- Burian A, Mauvisseau Q, Bulling M, Domisch S, Qian S, Sweet M. 2021. Improving the reliability of eDNA data interpretation. Mol Ecol Resour. 21(5):1422–1433.
- Bury RB. 2008. Low thermal tolerances of stream amphibians in the Pacific Northwest: Implications for riparian and forest management. Appl Herpetol. 5(1):63–74.
- Bury RB. 1972. Small mammals and other prey in the diet of the Pacific giant salamander (Dicamptodon ensatus). American Midland Naturalist. 87(2):524–526.
- Catenazzi A, Kupferberg SJ. 2017. Variation in thermal niche of a declining river‐breeding frog: From counter‐gradient responses to population distribution patterns. Freshw Biol. 62(7):1255–1265.
- Center for Biological Diversity (CBD). 2016. Petition to list the foothill yellow-legged frog (Rana boylii) as threatened under the California Endangered Species Act. Tuscon, AZ: CBD.
- Collins JP, Storfer A. 2003. Global amphibian declines: Sorting the hypotheses. Divers Distrib. 9(2):89–98.
- Dudaniec RY, Richardson JS. 2012. Habitat associations of the Coastal Giant Salamander (Dicamptodon tenebrosus) at its northern range limit. Herpetolog Conserv Biol. 7(1):1–15.
- Fediajevaite J, Priestley V, Arnold R, Savolainen V. 2021. Meta‐analysis shows that environmental DNA outperforms traditional surveys, but warrants better reporting standards. Ecol Evol. 11(9):4803–4815.
- Fiske I, Chandler R. 2011. Unmarked: an R package for fitting hierarchical models of wildlife occurrence and abundance. J Stat Soft. 43(10):1–23.
- Goldberg CS, Strickler KM, Fremier AK. 2018. Degradation and dispersion limit environmental DNA detection of rare amphibians in wetlands: Increasing efficacy of sampling designs. Sci Total Environ. 633:695–703.
- Halstead BJ, Kleeman PM, Goldberg CS, Bedwell M, Douglas RB, Ulrich DW. 2018. Occurrence of California red-Legged (Rana draytonii) and Northern red-legged (Rana aurora) frogs in timberlands of Mendocino County, California, examined with environmental DNA. Northwestern Naturalist. 99(1):9–20.
- Jiang L, Yang Y. 2017. Visualization of international environmental DNA research. Curr Sci. 112(08):1659–1664.
- Kupferberg SJ. 1996. Hydrologic and geomorphic factors affecting conservation of a river‐breeding frog (Rana boylii). Ecol Appl. 6(4):1332–1344.
- Kupferberg SJ. 1997. Bullfrog (Rana catesbeiana) invasion of a California river: the role of larval competition. Ecology 78(6):1736–1751.2.0.CO;2]
- Landert KA. 2016. Comparing photographic and GIS-based applications for estimating canopy cover in Southern Appalachian Bogs. 2016 NCUR.
- Lannoo M. 2005. Amphibian declines: The conservation of United States species. Berkeley: University of California Press. https://doi.org/10.1525/9780520929432
- Lind AJ, Welsh HH. 1990. Predation by Thamnophis couchii on Dicamptodon ensatus. J Herpetol. 24(1):104–106.
- Lopes CM, Sasso T, Valentini A, Dejean T, Martins M, Zamudio KR, Haddad CF. 2017. eDNA metabarcoding: a promising method for anuran surveys in highly diverse tropical forests. Mol Ecol Resour. 17(5):904–914.
- Lynch JF. 1974. Aneides flavipunctatus catalogue of American amphibians and reptiles. Society for the Study of Amphibians and Reptiles, 158.1
- MacKenzie DI, Nichols JD, Lachman GB, Droege S, Andrew Royle J, Langtimm CA. 2002. Estimating site occupancy rates when detection probabilities are less than one. Ecology. 83(8):2248–2255.2.0.CO;2]
- McCallum ML. 2007. Amphibian decline or extinction? Current declines dwarf background extinction rate. Journal of Herpetology. 41(3):483–491.2.0.CO;2]
- Morgan A, Cannon D. 2004. King Range National Conservation Area Case Study.
- Moss WE, Harper LR, Davis MA, Goldberg CS, Smith MM, Johnson PT. 2022. Navigating the trade‐offs between environmental DNA and conventional field surveys for improved amphibian monitoring. Ecosphere. 13(2):e3941.
- Moyle PB. 1973. Effects of introduced bullfrogs, Rana catesbeiana, on the native frogs of the San Joaquin Valley, California. Copeia. 1973(1):18–22.
- Nafis G. 2000. 2022). California Herps - A Guide to the Amphibians and Reptiles of California. Retrieved from http://www.californiaherps.com/index.html.
- Parker MS. 1994. Feeding ecology of stream-dwelling Pacific giant salamander larvae (Dicamptodon tenebrosus). Copeia. 1994(3):705–718.
- Peek RA, Bedwell M, O'Rourke SM, Goldberg C, Wengert GM, Miller MR. 2019. Hybridization between two parapatric ranid frog species in the northern Sierra Nevada, California, USA. Mol Ecol. 28(20):4636–4647.
- Petranka JW. 1998. Salamanders of the United States and Canada. Smithsonian Institution Press.
- Pilliod DS, Goldberg CS, Arkle RS, Waits LP. 2013. Estimating occupancy and abundance of stream amphibians using environmental DNA from filtered water samples. Can J Fish Aquat Sci. 70(8):1123–1130.
- R Core Team 2020. R: A language and environment for statistical computing. Vienna, Austria: R Foundation for Statistical Computing. https://www.R-project.org/.
- Rees HC, Maddison BC, Middleditch DJ, Patmore JR, Gough KC. 2014. The detection of aquatic animal species using environmental DNA–a review of eDNA as a survey tool in ecology. J Appl Ecol. 51(5):1450–1459.
- Royle JA, Nichols JD. 2003. Estimating abundance from repeated presence–absence data or point counts. Ecology 84(3):777–790.2.0.CO;2]
- Rundio DE, Olson DH. 2001. Palatability of southern torrent salamander (Rhyacotriton variegatus) larvae to Pacific giant salamander (Dicamptodon tenebrosus) larvae. J Herpetol. 35(1):133–136.
- Schütz R, Tollrian R, Schweinsberg M. 2020. A novel environmental DNA detection approach for the wading birds Platalea leucorodia, Recurvirostra avosetta and Tringa totanus. Conserv Genet Resour. 12(4):529–531.
- Stebbins RC. 1985. A field guide to western reptiles and amphibians. Boston: Houghton Mifflin.
- Stebbins RC, McGinnis SM. 2012. Field guide to amphibians and reptiles of California: Revised edition. Vol. 103. CA: University of California Press.
- Stuart SN, Chanson JS, Cox NA, Young BE, Rodrigues AS, Fischman DL, Waller RW. 2004. Status and trends of amphibian declines and extinctions worldwide. Science 306(5702):1783–1786.
- Thomsen PF, Willerslev E. 2015. Environmental DNA–An emerging tool in conservation for monitoring past and present biodiversity. Biol Conserv. 183:4–18.
- US Fish and Wildlife Service. 2005. Revised guidance on site assessments and field surveys for the California red-legged frog. Sacramento, CA: Sacramento Fish and Wildlife Service Office.
- Van Hattem M, Bean WT, Belamaric P, Gamblin H, Scherbinski JJ, Olson J, Semerdjian A, Katrina S, Widick I. 2021. Foothill yellow-legged frog breeding biology in a semi-regulated river, Humboldt County, CA. California Fish Game. 107:205–220.
- Vannote RL, Minshall GW, Cummins KW, Sedell JR, Cushing CE. 1980. The river continuum concept. Can J Fish Aquat Sci. 37(1):130–137.
- Welsh HH, Jr, Hodgson GR. 1997. A hierarchical strategy for sampling herpetofaunal assemblages along small streams in the western US, with an example from Northern California. Trans West Sect Wildlife Soc. 33:56–66.
- Welsh HH, Jr, Hodgson GR. 2011. Spatial relationships in a dendritic network: the herpetofaunal metacommunity of the Mattole River catchment of northwest California. Ecography 34(1):49–66.
- Welsh HH, Jr, Hodgson GR, Lind AJ. 2005. Ecogeography of the herpetofauna of a northern California watershed: linking species patterns to landscape processes. Ecography 28(4):521–536.
- Williams JE, Johnson JE, Hendrickson DA, Contreras-Balderas S, Williams JD, Navarro-Mendoza M, McAllister DE, Deacon JE. 1989. Fishes of North America endangered, threatened, or of special concern: 1989. Fisheries 14(6):2–20.