
ABSTRACT
Purpose: Protective effects of estradiol against H2O2-induced oxidative stress have been demonstrated in lens epithelial cells. The purpose of this study was to investigate the effects of 17β-estradiol (E2) on the different superoxide dismutase (SOD) isoenzymes, SOD-1, SOD-2, and SOD-3, as well as estrogen receptors (ERs), ERα and ERβ, in primary cultured human lens epithelial cells (HLECs).
Materials and methods: HLECs were exposed to 0.1 µM or 1 µM E2 for 1.5 h and 24 h after which the effects were studied. Protein expression and immunolocalization of SOD-1, SOD-2, ERα, and ERβ were studied with Western blot and immunocytochemistry. Total SOD activity was measured, and gene expression analyses were performed for SOD1, SOD2, and SOD3.
Results: Increased SOD activity was seen after 1.5 h exposure to both 0.1 µM and 1 µM E2. There were no significant changes in protein or gene expression of the different SODs. Immunolabeling of SOD-1 was evident in the cytosol and nucleus; whereas, SOD-2 was localized in the mitochondria. Both ERα and ERβ were immunolocalized to the nucleus, and mitochondrial localization of ERβ was evident by colocalization with MitoTracker. Both ERα and ERβ showed altered protein expression levels after exposure to E2.
Conclusions: The observed increase in SOD activity after exposure to E2 without accompanying increase in gene or protein expression supports a role for E2 in protection against oxidative stress mediated through non-genomic mechanisms.
Introduction
When comparing the incidence of cataract for men and women of the same age, women after menopause have an increased risk of developing cataract, as shown by several epidemiological studies.Citation1–Citation3 The dramatic reduction of estradiol at menopause has been hypothesized to lead to increased risk of cataract in women and accordingly, with studies showing reduced risk of cataract by exogenous estrogens, that is, hormonal replacement therapy, estrogens have been suggested to protect against cataract.Citation4–Citation6 The primary estrogen, estradiol, is found both in men and women and the most potent form, 17β-estradiol (E2), binds to estrogen receptors (ERs), ERα and ERβ. Both types of receptors have been found in the human eye lens.Citation7,Citation8 Protective effects of E2 against H2O2-induced oxidative stress have been demonstrated in lens epithelial cells (LECs).Citation9–Citation11 In addition, several animal models have demonstrated effects of estrogen in the lens indicating protective effects against cataract formation.Citation12,Citation13 The mechanism for estrogen-mediated protection is not fully elucidated, and both genomic and non-genomic mechanisms have been demonstrated. Estrogens can exert their effects through the classic genomic pathway by binding to ERs, thereby regulating gene expression via estrogen response elements (EREs) or by a non-classical genomic mechanism through ligand-activated ER interactions with co-regulators and transcription factors, such as activator protein 1 (AP-1) and transcription factor Sp1.Citation14,Citation15 Non-genomic effects of steroids in general do not depend on gene transcription or protein synthesis and involve cytoplasmic or membrane-bound regulatory proteins or membrane-localized ERs. There are also ligand-independent pathways where ER activity can be regulated through activation of several different signal transduction pathways such as extracellular signal-regulated kinases (ERKs) included in the mitogen-activated protein kinase (MAPK) pathway.Citation16 Non-genomic effects of E2 have been demonstrated in LECs by MAPK activation and prevention of mitochondrial membrane potential collapse during oxidative stress.Citation17 Moreover, studies have shown estrogen-mediated protection against oxidative stress through upregulation of antioxidative enzymes including superoxide dismutases (SODs).Citation18–Citation20
The purpose of the present study was to investigate the effects of 17β-estradiol (E2) on the activity, immunolocalization, protein and gene expression of the different SOD isoenzymes, SOD-1, SOD-2, and SOD-3, as well as the effects on protein expression and immunolocalization of ERα and ERβ in primary cultured human lens epithelial cells (HLECs).
Materials and methods
Human lens epithelial cell culture
Capsulorhexis specimens from patients undergoing cataract surgery were obtained, and primary cell cultures of HLECs were essentially cultured as previously described.Citation21 Capsulorhexis specimens and eventually HLECs were all cultured in a humidified CO2-incubator using Eagle’s minimum essential medium (MEM) with phenol red supplemented with 100 U/ml penicillin, 100 µg/ml streptomycin, 2 mM L-glutamine, 2.5 µg/ml amphotericin B (Sigma-Aldrich, St Louis, MO, USA), and 10% fetal bovine serum (FBS) (Thermo Fisher Scientific, Rockford, IL, USA). In all experiments, three or more different primary cell cultures of HLECs derived from separate individuals were used. Each cell culture was grown in monolayers, and passages between IV and XV were used. Prior to each experiment, cells were washed with Dulbecco’s phosphate buffered saline (PBS) without calcium and magnesium (Thermo Fisher Scientific, Rockford, IL, USA), after which the medium was changed to MEM without phenol red (Gibco, Paisley, Scotland, UK) and 5% FBS for 22–24 h before exposure to 17β-estradiol (E2) in serum free medium. Stock solution of E2 (10 mM) was prepared in 99.5% ethanol (Sigma-Aldrich, St Louis, MO, USA). HLECs were incubated in triplicates with E2 (0.1 µM and 1 µM) for 1.5 h or 24 h. Control cells were used in all experiments and were incubated simultaneously, in an ethanol concentration equivalent to the highest E2 concentration, for 1.5 h or 24 h. Cells were cultured in 6-well culture dishes (TPP, Trasadingen, Switzerland) and collected with cell scrapers before further analyses in all experiments except for visualization with immunofluorescence, then cells were cultured in 8-well chamber slides (Lab-Tek, Nalge Nunc International, Rochester, NY, USA). The Regional Research Ethics Committee in Gothenburg approved the study, and the tenets of the Declaration of Helsinki were followed.
Gene expression analysis
After exposure to E2, the cells were collected and pellets were used for extraction of total RNA, performed on the Maxwell 16 Instrument (Promega Corporation, Madison, WI, USA) according to the manufacturer’s protocol. The quality and integrity of RNA was determined in all samples with Agilent R6K ScreenTape on the Agilent 2200 TapeStation (Agilent Technologies Waldbronn, Germany). All samples had RNA integrity number (RIN) >8 and 28S/18S ratio >2, showing high quality and integrity of the total RNA extracted from HLECs. RNA concentration was measured on NanoDrop 1000 (Thermo Fisher Scientific, Rockford, IL, USA) and Infinite M200 PRO NanoQuant Plate (Tecan group Ltd., Männedorf, Switzerland). cDNA synthesis was performed with reverse transcription polymerase chain reaction (RT-PCR) and SuperScript VILO cDNA Synthesis Kit (Invitrogen, Carlsbad, CA, USA) using 0.6 µg of total RNA. Real-time quantitative polymerase chain reaction (qPCR) was performed using 2 µl cDNA (10 ng/µl) in a final volume of 10 µl with TaqMan Gene Expression Master Mix and TaqMan Gene Expression Assays specific for the genes studied: SOD1 (Hs00533490_m1) SOD2 (Hs00167309_m1) and SOD3 (Hs00162090_m1). Eight reference genes were tested, and ultimately the relative gene expression data were normalized to the reference genes: RPLP0 (Hs99999902_m1) and PPIA (Hs99999904_m1). Each reaction was performed in triplicate on 384-well plates on the ABI 7900HT (Applied Biosystems, Foster City, CA, USA).
Protein expression analysis
HLECs exposed to E2 were rinsed in ice cold PBS, followed by lysis in modified NuPage 0.5% lithium dodecyl sulfate (LDS) sample buffer (Novex, Life Technologies, Carlsbad, CA, USA). The cell lysates were heated at 70°C for 10 min and sonicated for 20 s at 50% amplitude (Branson Ultrasonic corporation, Danbury, CT, USA). All cell and lysate handling was performed on ice. Immediately before gel loading, the reducing agent (DTT; dithiothreitol) was added to a final concentration of 50 mM. Triplets of the samples were loaded on NuPage 4–12% Bis-Tris gradient minigels using NuPage MES or MOPS SDS running buffer and the Novex Sharp Pre-Stained Protein Standard (Novex, Life Technologies, Carlsbad, CA, USA). After electrophoresis, the proteins were transferred to nitrocellulose membranes followed by a blocking in 5% non-fat milk powder in PBS overnight in +4°C. Primary antibodies used for Western blotting included polyclonal rabbit anti-ERα (H-184; 1:50), ERβ (H-150; 1:50), SOD-1 (FL-154; 1:500), as well as monoclonal mouse anti-SOD-2 (B-1; 1:500), β-actin (C4; 1:500) (Santa Cruz Biotechnology, Dallas, TX, USA). Primary antibody binding was detected with the corresponding secondary antibodies conjugated to horseradish peroxidase (Santa Cruz Biotechnology, Dallas, TX, USA). Protein expression bands were visualized with Luminata Forte Western HRP Substrate (Millipore Corporation, Billerica, MA, USA) in ImageQuant LAS 500 (GE Healthcare, Piscataway, NJ, USA), followed by densitometric analysis using ImageJ software version 1.37 (National Institute of Health, USA). β-actin was used for normalization of densitometric data, and results were expressed as area under the curve (AUC).
Immunocytochemistry
After E2 exposure, the cells were rinsed in PBS and fixed in 4% paraformaldehyde (pH 7.4). The cells were rinsed again and permeabilized by 0.25% triton-X in PBS for 10 min at room temperature (Sigma-Aldrich, St Louis, MO, USA). Following standard protocols for immunocytochemistry, the cells were labeled with antibodies (same as used for Western Blot) against ERα (1:50), ERβ (1:50), SOD-1 (1:50), and SOD-2 (1:50) and visualized by Alexa Fluor 488 Goat Anti-Rabbit or Anti-Mouse IgG (H + L) antibodies (1:200) (Molecular Probes, Eugene, OR, USA). Nuclear morphology was viewed using cell permeable Hoechst 33342 (Sigma-Aldrich, St Louis, MO, USA) at final concentration of 10 μg/ml. Prior to fixation, cells were incubated with MitoTracker Deep Red FM (Molecular Probes, Eugene, OR, USA), which was used for mitochondrial localization at final concentration of 500 nM. The cells were viewed using a fluorescence microscope (Nikon Eclipse TE300; Nikon, Tokyo, Japan).
Total superoxide dismutase activity
HLECs exposed to E2 were rinsed with PBS, and the cell pellets were sonicated after which SOD activity was measured using the Superoxide Dismutase Assay kit, according to the manufacturer’s protocol (Cayman Chemical Company, Ann Arbor, MI, USA). Absorbance was measured at 440 nm on the microplate reader Infinite M200 PRO (Tecan group Ltd., Männedorf, Switzerland). The SOD assay uses tetrazolium salt to detect superoxide radicals generated by xanthine oxidase and hypoxanthine. One unit (U) of SOD is defined as the amount of enzyme needed to exhibit 50% dismutation of the superoxide radical. The SOD assay measured total SOD activity (U/ml) in whole cell lysate and protein concentration was determined with BCA protein assay reagent (Pierce, Perbio Science, Cheshire, UK) using bovine serum albumin as standard. Total SOD activity levels (U/ml) were related to cell protein levels (mg/ml) and expressed as U/mg.
Statistical analyses
Total SOD activity and Western blot experiments were repeated at least once with similar results, and data from triplicate samples (n = 3) are shown in figures as mean ± SD after analysis with one-way ANOVA with Dunnett’s post hoc test. Relative gene expression data were normalized to the reference genes, RPLP0 and PPIA, and compared to the expression in control cells according to the 2−ΔΔCt method.Citation22 Data were analyzed using a linear mixed model and expressed as fold change. Statistical analyses were performed using IBM SPSS Statistics version 21 (IBM Corp., Armonk, NY, USA), and p-values ≤0.05 were considered statistically significant.
Results
Gene expression of superoxide dismutases
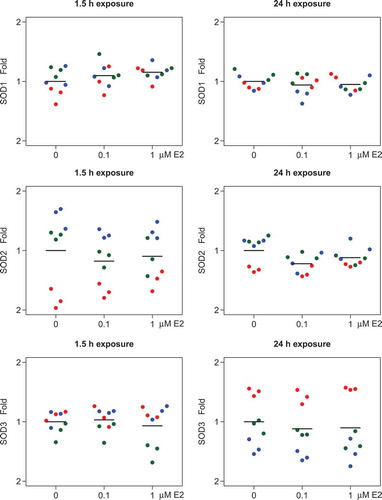
After normalization to the reference genes, no significant changes in SOD1, SOD2, or SOD3 gene expression were seen after 1.5 h or after 24 h exposure to 0.1 µM and 1 µM E2, when compared to the expression in control cells (). The SOD3 gene expression was generally lower compared to SOD1 and SOD2 (qPCR amplification curves not shown).
Figure 1. Effects of 17β-estradiol (E2) on gene expression levels of superoxide dismutases, SOD1, SOD2, and SOD3, in human lens epithelial cells (HLECs).
No significant changes were seen in the gene expression levels of SOD1, SOD2, or SOD3 after exposure to E2 for 1.5 h or 24 h. Relative gene expression data normalized to reference genes, RPLP0 and PPIA, and shown as fold change compared to control cells (0 µM E2). Each dot in the same color represents samples from the same cell culture, and the three different colors represent the three different cell cultures (n = 3).
Protein expression of superoxide dismutases
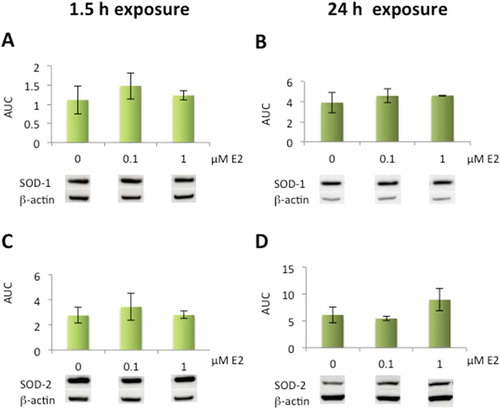
A slight increase in both SOD-1 and SOD-2 protein expression was seen at 0.1 µM after 1.5 h, and elevated SOD-2 levels were also seen at 1 µM E2 after 24 h. However, these results were not statistically significant compared to the control cells ().
Figure 2. Effects of 17β-estradiol (E2) on superoxide dismutase protein expression levels in human lens epithelial cells (HLECs).
No significant changes were seen in SOD-1 (A, B) or SOD-2 (C, D) expression levels after exposure to E2 for 1.5 h or 24 h. Data presented from densitometric analyses of Western blot bands normalized to β-actin (n = 3) and shown as mean ± SD.
Immunolocalization of superoxide dismutases
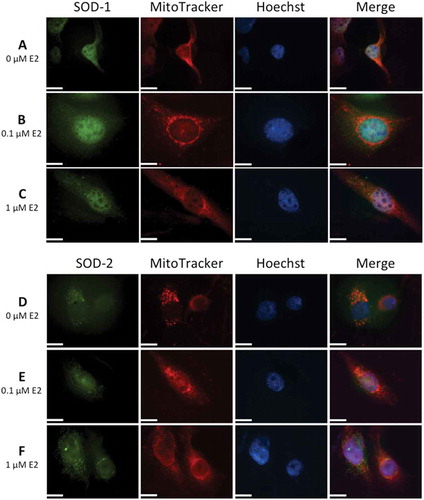
Strong immunolabeling with SOD-1 was seen in the cytosol and nucleus in contrast to SOD-2 where mitochondrial localization dominated for SOD-2. No subcellular redistribution of SOD-1 or SOD-2 was seen with E2 exposure ().
Figure 3. Immunolocalization of superoxide dismutases, SOD-1 and SOD-2, in human lens epithelial cells (HLECs) after exposure to 17β-estradiol (E2) for 1.5 h.
Nuclear morphology is shown with Hoechst 33342 and MitoTracker Deep Red FM was used for mitochondrial localization. Cells were labeled with antibodies against SOD-1 and SOD-2 and visualized by Alexa Fluor 488. Immunolabeling in the cytosol and nucleus was seen with SOD-1 antibody (A, B, C) Mitochondrial localization was evident by colocalization of SOD-2 with MitoTracker (D, E, F). Original magnification: 1000×. Scale bar: 20 µm.
Superoxide dismutase activity
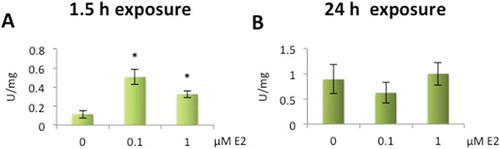
Significant increase in total SOD activity was seen in whole cell lysate from HLECs after exposure to 0.1 µM and 1 µM E2 for 1.5 h. By 24 h, however, the SOD activity was back to baseline values ().
Figure 4. Increased superoxide dismutase (SOD) activity levels after exposure to 17β-estradiol (E2) in human lens epithelial cells (HLECs).
Significant increase in activity levels after exposure to 0.1 µM and 1 µM E2 for 1.5 h (A). No significant changes were seen in activity after 24 h exposure (B) Data presented as SOD units related to protein concentration (U/mg) shown as mean ± SD. Asterisks indicate statistical significance p ≤ 0.05 for comparison with control cells (0 µM E2).
Protein expression and immunolocalization of estrogen receptors
Significantly decreased ERα expression was detected in cells exposed to the higher (1 µM) E2 concentration after 1.5 h as well as after 24 h exposure; whereas, significantly increased ERβ protein expression was seen at both 0.1 µM and 1 µM E2 after 1.5 h exposure and at 1 µM after 24 h, as compared to control cells (). Both ERα and ERβ were present in the nucleus and mitochondrial localization of ERβ was evident by colocalization with MitoTracker. The immunolabeling of ERβ increased slightly after exposure to 1 µM E2 ().
Figure 5. Altered protein expression levels of estrogen receptors (ERα and ERβ) after exposure to 17β-estradiol (E2) in human lens epithelial cells (HLECs)..
Decrease in ERα expression levels after exposure to 1 µM E2 for 1.5 h and 24 h (A, B). Elevated ERβ expression levels after exposure to 0.1 µM and 1 µM E2 for 1.5 h (C) and 1 µM E2 for 24 h (D). Data presented from densitometric analyses of Western blot bands normalized to β-actin (n = 3) shown as mean ± SD. Asterisks indicate statistical significance p ≤ 0.05 for comparison with control cells (0 µM E2).
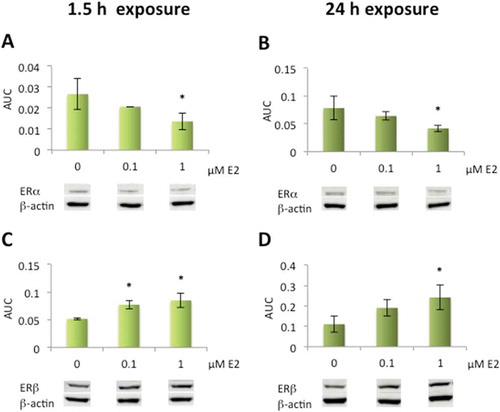
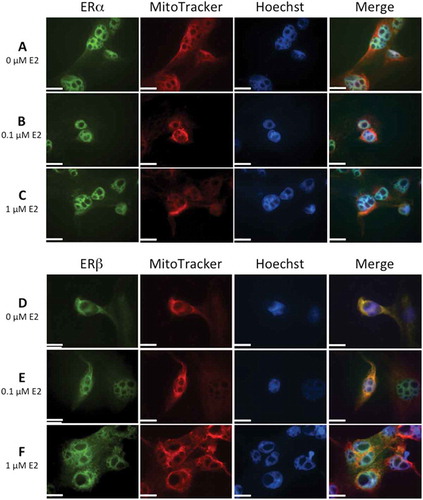
Figure 6. Immunolocalization of estrogen receptors, ERα and ERβ, in human lens epithelial cells (HLECs) after exposure to 17β-estradiol (E2) for 1.5 h.
Nuclear morphology is shown with Hoechst 33342, and MitoTracker Deep Red FM was used for mitochondrial localization. Cells were also labeled with antibodies against ERα and ERβ and visualized by Alexa Fluor 488. Images show ERα (A, B, C) and ERβ (D, E, F) localization in nucleus. Mitochondrial localization of ERβ is evident by the colocalization with MitoTracker, showing a more intense yellow color in merged images (D, E, F) compared to no colocaliztion with ERα (A,B,C). The immunolabeling of ERβ increased slightly at the highest E2 concentration, 1 µM (F). Original magnification: 1000×. Scale bar: 20 µm.
Discussion
Reactive oxygen species (ROS) can induce oxidative modifications to lens proteins, lens fiber membranes, and DNA, thereby contributing to cataract formation.Citation23 The SOD isoenzymes are part of the antioxidative defense in the lens and catalyze the dismutation of superoxide into hydrogen peroxide, which is further processed by catalase and glutathione peroxidase (GPx).Citation24 In humans, SOD-1 is primarily found in the cytosol and the nucleus and the predominant SOD isoenzyme in mitochondria is SOD-2, while SOD-3 on the other hand is secreted and found in the extracellular matrix of tissues.Citation25–Citation27 The crystalline lens is largely built up of tightly stacked lens fibers containing cytoplasm devoid of organelles, where SOD-1 is the predominant isoenzyme.Citation28 In the lens epithelium and the superficial lens fibers—the only parts of the lens that contain mitochondria—both SOD-1 and SOD-2 are found; whereas, SOD-3 is secreted extracellularly and found in the cell culture medium when lens epithelial cells are cultured. Thus, only SOD-1 and SOD-2 were studied with immunocytochemistry, and immunolabeling with SOD-1 was evident both in the nucleus and cytosol in contrast to SOD-2, which was localized mainly to the mitochondria. It has previously also been shown with immunocytochemistry that SOD-1 is widely distributed both in the nucleus and cytosol of human cells.Citation29 As expected, we observed lower gene expression levels of SOD3 in HLECs as compared to SOD1 and SOD2 levels. However, the relative gene expression data did not show any effects of E2 in gene expression of SOD1, SOD2, or SOD3 compared to control cells. The total SOD activity measured included all three SODs, and increased activity levels were seen after 1.5 h exposure to E2 although this effect did not correlate with protein or gene expression of the different SODs. These results are in accordance with Gottipati et al. who showed a significant increase in SOD-2 activity levels in transformed lens epithelial cells (HLE-B3) after exposure to E2 without any changes in either mRNA or protein expression levels.Citation30 In addition, studies have also reported that E2 increased SOD-2 activity levels without alteration of SOD-2 protein levels in mitochondria.Citation20,Citation31 However, other studies demonstrated both upregulated gene and protein expression of SOD-2 and SOD-3 in an E2 concentration- and time-dependent manner mediated by ERs, in vascular smooth muscle endothelial cells.Citation18 In addition, E2 showed antioxidative effects by upregulation in gene expression of GPx and SOD-2 via activation of MAPK pathway through ERK phosphorylation.Citation19 The discrepancies regarding E2 effects on SOD in both protein and gene expression may be attributed to difference between cell lines. However, the rapid, transient increase in activity seen in HLE-B3 was explained by Gottipati et al. to not influence mRNA or protein expression. This can also explain why we only observed an increase in activity after 1.5 h exposure in HLEC, indicating non-genomic mechanisms of E2.
Even though we have observed a slightly higher rate of cell growth in capsule-epithelium specimens derived from female cataract patients,Citation32 no difference in results were seen between cells from different genders in our previous study of estrogen effects. Therefore, HLECs, only derived from women over 60 years undergoing cataract surgery, were used in this study.Citation21 Flynn et al. has shown that estrogen protection and distribution of ER splice variants in HLECs are gender independent, and the estrogen-induced mitochondrial cytoprotection is wtERβ1 dependent. They also showed a difference in ERβ variants distribution and RNA expression as well as responsiveness to oxidative stress between primary cultured HLECs and the transformed lens epithelial cell line, HLE-B3.Citation33 However, the subcellular localization of wild-type ERβ was the same for the primary cultured HLECs as HLE-B3 and in accordance with our results; ERβ was found in both the nucleus and in mitochondria, colocalized with MitoTracker, while ERα was localized to the nucleus and cytosol and not found in mitochondria.Citation34,Citation35 Under normal physiological conditions, the ERα to ERβ ratio in breast tissue is determined by the plasma E2 levels. In postmenopausal women, the dramatic drop in E2 levels leads to elevated expression of ERα, and Cheng et al. showed that ERα and not ERβ was downregulated when E2 levels increased.Citation36 Our results also showed reduced ERα expression levels as well as the reversed effect, elevated ERβ expression levels, with increased E2 concentration. This may be explained by several studies demonstrating that ERα is inhibited to bind to the estrogen-responsive promoters by ERβ. E2-dependent AP-1 mediated transactivation by ERα is also suppressed by ERβ suggesting that ERβ exhibits an inhibitory effect on ERα-mediated gene expression, when ERs are coexpressed.Citation37–Citation39
Both estrogen receptors, ERα and ERβ, were immunolocalized in primary cultured HLECs and showed altered protein expression levels. The mitochondrial localization and elevated expression levels of ERβ owing to E2 exposure indicate mitochondrial involvement. Moreover, this is consistent with the suggestion that E2-induced mitochondrial cytoprotective effects are mediated through ER-dependent mechanisms in HLECs. However, no such conclusions can be drawn, and further investigations of E2-mediated antioxidative effects are essential. We observed increased SOD activity levels after 1.5 h exposure to E2, thereby implying non-genomic mechanisms of E2 because no changes were seen in neither gene nor protein expression levels of SODs.
Declaration of interest
The authors report no conflict of interest. The authors alone are responsible for the content and writing of the paper.
Acknowledgment
We thank the Genomics Core Facility platform at the Sahlgrenska Academy at University of Gothenburg, where the gene expression analyses were performed.
Additional information
Funding
References
- Mitchell P, Cumming RG, Attebo K, Panchapakesan J. Prevalence of cataract in Australia: The Blue Mountains Eye Study. Ophthalmology. 1997;104:581–88. doi: 10.1016/S0161-6420(97)30266-8.
- Lundstrom M, Stenevi U, Thorburn W. Gender and cataract surgery in Sweden 1992-1997. A Retrospective Observational Study Based on the Swedish National Cataract Register. Acta Ophthalmol Scand. 1999;77: 204–08.
- Klein BE, Klein R, Linton KL. Prevalence of age-related lens opacities in a population The Beaver Dam Eye Study. Ophthalmology. 1992;99: 546–52.
- Klein BE, Klein R, Ritter LL. Is there evidence of an estrogen effect on age-related lens opacities? The Beaver Dam Eye Study. Arch Ophthalmol. 1994;112: 85–91.
- Younan C, Mitchell P, Cumming RG, Panchapakesan J, Rochtchina E, Hales AM. Hormone replacement therapy, reproductive factors, and the incidence of cataract and cataract surgery: The Blue Mountains Eye Study. Am J Epidemiol. 2002;155: 997–1006.
- Worzala K, Hiller R, Sperduto RD, Mutalik K, Murabito JM, Moskowitz M, D'Agostino RB, Wilson PW. Postmenopausal estrogen use, type of menopause, and lens opacities: The Framingham studies. Arch Intern Med. 2001;161:1448–54.
- Ogueta SB, Schwartz SD, Yamashita CK, Farber DB. Estrogen receptor in the human eye: Influence of gender and age on gene expression. Invest Ophthalmol Vis Sci. 1999;40: 1906–11.
- Wickham LA, Gao J, Toda I, Rocha EM, Ono M, Sullivan DA. Identification of androgen, estrogen and progesterone receptor mRNAs in the eye. Acta Ophthalmol Scand. 2000;78: 146–53.
- Celojevic D, Petersen A, Karlsson JO, Behndig A, Zetterberg M. Effects of 17beta-estradiol on proliferation, cell viability and intracellular redox status in native human lens epithelial cells. Molecular Vision. 2011;17: 1987–96.
- Gajjar D, Patel D, Alapure B, Praveen MR, Patel A, Johar K, Sr., Vasavada AR. Rapid action of oestradiol against hydrogen peroxide-induced oxidative stress in cataractous lens epithelium: An in vitro study. Eye (Lond). 2009;23:1456–63.
- Wang X, Simpkins JW, Dykens JA, Cammarata PR. Oxidative damage to human lens epithelial cells in culture: Estrogen protection of mitochondrial potential, ATP, and cell viability. Invest Ophth Vis Sci. 2003;44: 2067–75.
- Bigsby RM, Cardenas H, Caperell-Grant A, Grubbs CJ. Protective effects of estrogen in a rat model of age-related cataracts. P Natl Acad Sci USA. 1999;96: 9328–32.
- Hales AM, Chamberlain CG, Murphy CR, McAvoy JW. Estrogen protects lenses against cataract induced by transforming growth factor-beta (TGFbeta). The Journal of Experimental Medicine. 1997;185: 273–80.
- Kushner PJ, Agard DA, Greene GL, Scanlan TS, Shiau AK, Uht RM, Webb P. Estrogen receptor pathways to AP-1. J Steroid Biochem Mol Biol. 2000;74:311–17.
- Saville B, Wormke M, Wang F, Nguyen T, Enmark E, Kuiper G, et al. Ligand-, cell-, and estrogen receptor subtype (alpha/beta)-dependent activation at GC-rich (Sp1) promoter elements. J Biol Chem. 2000;275:5379–87.
- Levin ER. Cell localization, physiology, and nongenomic actions of estrogen receptors. J Appl Physiol. 1985;2001(91): 1860–67.
- Moor AN, Flynn JM, Gottipati S, Giblin FJ, Cammarata PR. 17beta-estradiol stimulates MAPK signaling pathway in human lens epithelial cell cultures preventing collapse of mitochondrial membrane potential during acute oxidative stress. Mitochondrion. 2005;5: 235–47.
- Strehlow K, Rotter S, Wassmann S, Adam O, Grohe C, Laufs K, Böhm M, Nickenig G. Modulation of antioxidant enzyme expression and function by estrogen. Circ Res. 2003;93:170–77.
- Borras C, Gambini J, Gomez-Cabrera MC, Sastre J, Pallardo FV, Mann GE, Viña J. 17beta-oestradiol up-regulates longevity-related, antioxidant enzyme expression via the ERK1 and ERK2[MAPK]/NFkappaB cascade. Aging Cell. 2005;4:113–18.
- Razmara A, Duckles SP, Krause DN, Procaccio V. Estrogen suppresses brain mitochondrial oxidative stress in female and male rats. Brain Res. 2007;1176: 71–81.
- Celojevic D, Petersen A, Karlsson JO, Behndig A, Zetterberg M. Effects of 17beta-estradiol on proliferation, cell viability and intracellular redox status in native human lens epithelial cells. Mol Vis. 2011;17: 1987–96.
- Livak KJ, Schmittgen TD. Analysis of relative gene expression data using real-time quantitative PCR and the 2(-Delta Delta C(T)) Method. Methods. 2001;25: 402–08.
- Spector A. Oxidative stress-induced cataract: Mechanism of action. Faseb J. 1995;9: 1173–82.
- Brennan LA, McGreal RS, Kantorow M. Oxidative stress defense and repair systems of the ocular lens. Front Bioscience. 2012;4: 141–55.
- McCord JM, Fridovich I. Superoxide dismutase. An Enzymic Function for Erythrocuprein (Hemocuprein). The Journal of Biological Chemistry. 1969;244: 6049–55.
- Weisiger RA, Fridovich I. Mitochondrial superoxide dismutase. Site Synthesis Intramitochondrial Localization J Biol Chem. 1973;248: 4793–96.
- Marklund SL. Human copper-containing superoxide dismutase of high molecular weight. P Natl Acad Sci USA. 1982;79: 7634–38.
- Behndig A, Svensson B, Marklund SL, Karlsson K. Superoxide dismutase isoenzymes in the human eye. Invest Ophthalmol Vis Sci. 1998;39: 471–75.
- Crapo JD, Oury T, Rabouille C, Slot JW, Chang LY. Copper,zinc superoxide dismutase is primarily a cytosolic protein in human cells. Proc Natl Acad Sci U S A. 1992;89: 10405–09.
- Gottipati S, Cammarata PR. Mitochondrial superoxide dismutase activation with 17 beta-estradiol-treated human lens epithelial cells. Molecular Vision. 2008;14: 898–905.
- Pedram A, Razandi M, Wallace DC, Levin ER. Functional estrogen receptors in the mitochondria of breast cancer cells. Mol Biol Cell. 2006;17: 2125–37.
- Sundelin K, Petersen A, Soltanpour Y, Zetterberg M. In vitro growth of lens epithelial cells from cataract patients - association with possible risk factors for posterior capsule opacification. The Open Ophthalmology Journal. 2014;8: 19–23.
- Flynn JM, Dimitrijevich SD, Younes M, Skliris G, Murphy LC, Cammarata PR. Role of wild-type estrogen receptor-beta in mitochondrial cytoprotection of cultured normal male and female human lens epithelial cells. American Journal of Physiology Endocrinology and Metabolism. 2008;295: E637–647.
- Cammarata PR, Flynn J, Gottipati S, Chu S, Dimitrijevich S, Younes M, Skliris G, Murphy LC. Differential expression and comparative subcellular localization of estrogen receptor beta isoforms in virally transformed and normal cultured human lens epithelial cells. Experimental Eye Research. 2005;81:165–75.
- Cammarata PR, Chu S, Moor A, Wang Z, Yang SH, Simpkins JW. Subcellular distribution of native estrogen receptor alpha and beta subtypes in cultured human lens epithelial cells. Experimental Eye Research. 2004;78: 861–71.
- Cheng G, Li Y, Omoto Y, Wang Y, Berg T, Nord M, Vihko P, Warner M, Piao YS, Gustafsson JA. Differential regulation of estrogen receptor (ER)alpha and ERbeta in primate mammary gland. J Clin Endocrinol Metab. 2005;90:435–44.
- Paech K, Webb P, Kuiper GG, Nilsson S, Gustafsson J, Kushner PJ, Scanlan TS. Differential ligand activation of estrogen receptors ERalpha and ERbeta at AP1 sites. Science. 1997;277:1508–10.
- Lu S, Sun C, Miao C, Zhao Z. ERbeta compensates for the absence of ERalpha function to promote osteoblast viability by inhibition of SOST signaling. Exp Ther Med. 2017;14: 3387–92.
- Maruyama S, Fujimoto N, Asano K, Ito A. Suppression by estrogen receptor beta of AP-1 mediated transactivation through estrogen receptor alpha. J Steroid Biochem Mol Biol. 2001;78: 177–84.