
ABSTRACT
Purpose: Alpha 2-adrenergic receptor (α2-ADR) agonists are used clinically for a range of indications including reducing elevated intraocular pressure in patients with open-angle glaucoma or ocular hypertension. Animal experiments show that α2-ADR agonists attenuate the injury-induced Müller cell dedifferentiation by a mechanism that involves activation and regulation of extracellular signal-regulated kinase (ERK) 1/2 leading to transactivation of epidermal growth factor receptors (EGFRs). The purpose of this study was to study and corroborate the activation of this system in human cells.
Material and Methods: The human Müller cell line MIO-M1 was treated with the α2A-ADR agonist brimonidine in combination with inhibitors for Src-kinase, EGFR-kinase, matrix metalloproteinase (MMP) as well as small interfering RNAs (siRNAs) for the EGFR. The cells were analyzed using immunocytochemistry, quantitative PCR and western blot techniques.
Results: Our results show that human MIO-M1 cells express α2A-ADRs and that stimulation of these receptors caused a robust increase of ERK1/2 and protein kinase B (PKB/AKT) (Thr-308) phosphorylation in MIO-M1 cells. P-ERK1/2 and P-AKT (Thr-308) signaling was mediated by Src-kinase and associated with phosphorylation of tyrosine residue of epidermal growth factor receptor (P-EGFR Y1173). In addition, the agonist caused activation of MMPs. These effects could be blocked by Src-kinase inhibitors (PP1, PP2), EGFR-kinase inhibitor (AG1478), EGFR-siRNA and a MMP inhibitor (GM6001).
Conclusion: The results confirm that this human Müller cell line responds to ADR stimulation with phosphorylation of ERK and AKT, which suggests that it is possible to pharmacologically target ADR to modulate the early events in human Müller cell dedifferentiation in a similar fashion as been shown for chicken Müller cells.
Abbreviations: CRALBP: cellular retinaldehyde binding protein; EGFR: epidermal growth factor receptor; ERK1/2: extracellular signal-regulated kinase 1/2; GS: glutamine synthetase; GPCR: G protein-coupled receptor; IR: immunoreactivity; MAPK: mitogen-activated protein kinase; MMP: matrix metalloproteinase; P-ERK1/2: phospho-ERK1/2; qRT-PCR: quantitative reverse transcriptase PCR
Introduction
Müller cells are the principal supporting cell in retinaCitation1,Citation2 and in response to retinal disease or injury, they also provide a source for regenerated neurons.Citation3,Citation4 The adult mammalian retina has little or no capacity for regeneration while several cold-blooded vertebrates such as teleost fish functionally regenerate their retina following injury, with Müller cells as a source for new neurons.Citation5 The initial events after injury include Müller cell dedifferentiation to a retinal progenitor-like cell and proliferation. This process is regulated by several growth factors including fibroblast growth factors, Wnts and heparin-binding epidermal growth factor (HB-EGF) that act by stimulating a core of signaling cascades including mitogen-activated protein kinase (MAPK)/extracellular signal-activated kinases 1/2 (ERK1/2) and phosphatidyl inositide-3 kinase (PI3K) signaling.Citation6–Citation8 Even though regeneration is absent in mammalian retina, the mammalian Müller cells respond to injury with dedifferentiation and proliferationCitation9 and in fact functional regeneration in the mammalian retina can be stimulated by transgenic expression of the proneural transcription factor Ascl1.Citation10,Citation11 However, equipped with the capacity for dedifferentiation but not with the regenerative capacity, the injured mammalian retina will neither get support for the injured neurons from differentiated Müller cells nor it will get newly regenerated neurons. It has therefore been hypothesized that neurons in an injured retina will withstand injury better if the Müller cell dedifferentiation is blocked.Citation2
The stimulation of alpha 2-adrenergic receptors (α2-ADR) activates ERK1/2 MAPK signaling in Müller cellsCitation12,Citation13 and it was shown in chicken Müller cells that the ERK1/2 MAPK signaling is triggered by transactivation of epidermal growth factor receptors (EGFRs).Citation13 Interestingly, the transactivation triggers a negative feedback regulation that is able to attenuate both injury-induced ERK1/2 MAPK signaling and the dedifferentiation of the chicken Müller cells.Citation14 The initial activation of ERK1/2 MAPK signaling is important for the attenuation of the injury-induced events. The transactivation of EGFR occurs via the activation of cytosolic Src-kinase that causes shedding of the membrane-bound EGFR ligands such as heparin-binding epidermal growth factor (HB-EGF) by stimulation of matrix metalloproteinases (MMPs), which elicits an autocrine stimulation of the receptors.Citation13,Citation15
In this study, we corroborated the results from chicken and tested if α2-ADRs transactivate EGFRs in a human Müller cell line. 'The MIO-M1 cells were established by spontaneous immortalization from adult human retina.Citation16,Citation17 We analyzed the expression of α2-ADRs and stimulated the α2-ADR with the agonist brimonidine (BMD). The intracellular signaling pathways were then studied with focus on MAPK/ERK and PI3K/AKT-kinase signaling. Our results show that the human MIO-M1 cells express α2A-ADRs and stimulation by BMD triggers Src-kinase mediated ligand-dependent and ligand-independent transactivation of EGFRs with activation of ERK1/2 and AKT signaling. The results confirm that this human Müller cell line responds to ADR stimulation, in a similar way as chicken Müller cells, which when stimulated with BMD attenuate dedifferentiation in injured retina.Citation13,Citation14 The results imply that the early events in human Müller cell dedifferentiation are similar in the chicken and human systems.
Materials and methods
MIO-M1 cell culture
The cell line MIO M1 (Moorfields/Institute of Ophthalmology-Müller 1)Citation17 was obtained from E-LUCID, London, UK. The cells were grown in Dulbecco’s modified Eagle’s medium (DMEM) containing 10% NCS, 2 mM glutamine, 100 U/mL penicillin, and 100 mg/mL streptomycin at 37°C temperature in a humidified atmosphere of 5% CO2. The medium was changed twice a week and cells were ready to use when they reached 90% confluency. Cells were serum-starved for 16 h before addition of brimonidine tartrate (BMD, UK 14,304 tartrate, # 2466, Tocris Bioscience, Bristol, UK; 300 μM), EGF (# AF-100-15, PeproTech, Rocky Hill, NJ, USA; 100 ng/mL), or specific inhibitors: yohimbine (# 1127, Tocris Bioscience; 50 μM), AG1478 (# 1276, Tocris Bioscience; 50 μM), GM6001 (# BML-EI300-0001, ENZO Life Sciences, Farmingdale, NY, USA; 50 μM), PP1 (# P0040-5MG, Sigma-Aldrich, St. Louis, MO, USA; 5 μM), and PP2 (# 1407, Tocris Bioscience; 5 μM). All reagents were dissolved in the vehicle recommended by the manufacturer, which were also used as controls.
Transfection with small interfering RNA (siRNA)
MIO-M1 cells were plated in medium without serum and antibiotics and transfected with EGFR-siRNA (5′-GGAUCCCAGAAGAAGGUGAGAAAGUUAA-3′, Accession No. NM_005228.3, Cat. # s564, Invitrogen, Carlsbad, CA, USA) or non-specific target (Stealth RNAi Negative Control Duplex, Cat. # 12935-300, Invitrogen) using Lipofectamine RNAi-MAX (Cat # 13778-030, Invitrogen) according to the manufacturer’s instructions. Forty-eight hours after transfection, the cells were treated with BMD (300 μM) or vehicle for 60 min before analysis. The EGFR siRNA has been used in several studies,Citation18–Citation20 it is commercially available and the specificity and efficacy have been validated against human EGFR in HeLa cells (Invitrogen).
Immunocytochemistry and microscopy
Human MIO-M1 cells on coverslips were fixed in 4% paraformaldehyde in 0.1 M phosphate-buffered saline (PBS) for 15 min, and washed in 0.1 M PBS and then used for immunocytochemistry analysis. The immunocytochemistry was performed as described previously at Harun-Or-Rashid et al.13 Working dilution and sources of primary and secondary antibodies used in immunocytochemistry include: rabbit anti-P-ERK1/2, 1:200 (# 9101, Cell Signaling Technologies); rabbit anti-α2A receptor, 1:100 (# ab92560, Abcam); rabbit anti-α2B receptor, 1:100 (# T3257, Epitomics); rabbit anti-α2C receptor, 1:100 (# ab123368, Abcam); mouse anti-GS, 1:100 (# MAB302, Chemicon); mouse anti-CRALBP, 1:100 (# ab15051, Abcam); rabbit anti-P-EGFR (Y1173), 1:75 (#sc-12351-R, Santa Cruz Biotechnology); rabbit anti-EGFR, 1:75 (# sc-03, Santa Cruz Biotechnology); secondary mouse anti-IgG, Alexa 568 (Invitrogen); and secondary rabbit anti-IgG, Alexa 488 (Invitrogen). A Zeiss Axioplan2 microscope with Axiovision software v4.8 (CarlZeiss GmbH, Hamburg, Germany) was used for microscopy. The same exposure time settings were used for the experimental and control groups.
Quantitative reverse transcriptase-PCR (qRT-PCR)
Total RNA was extracted from the MIO-M1 cells by using TRIzol (Invitrogen). RNA was treated with DNase (1 μg/μl) and cDNA was synthesized from 1 μg RNA by using high capacity RNA to cDNA synthesis kit (Applied Biosystems, Foster City, CA, USA). The qRT-PCR analysis (IQ SyBr Green Supermix and a C1000 Thermal Cycler; Bio-Rad, Hercules, CA, USA) was performed as previously described.Citation13,Citation21 Primers were designed by using the Primer Express v2.0 software (Applied Biosystems). The mRNA expression levels were normalized to β-actin mRNA levels. The use of β-actin for normalization purposes has been validated using geNorm,Citation22 by analyzing the most stable mRNA expression of TATA binding protein (TBP), glyceraldehyde-3-phosphate dehydrogenase (GAPDH), β-2-microglobulin, and β-actin in the samples and over the experimental periods. Primer sequences and their corresponding accession numbers of target sequences are listed in . The efficiency, linearity and specificity of the amplification were checked and mRNA expression levels were calculated from cycle threshold (Ct) and 2−ΔΔCt method.Citation23 The mRNA levels were plotted relative to the β-actin level.
Table 1. List of QRT-PCR primers
Western blot and statistical analysis
The MIO-M1 cells were lysed and homogenized in buffer containing Halt Protease and Phosphatase Inhibitor Cocktail (Thermo Fisher Scientific, Rockford, IL, USA). Total protein concentration was measured by using DC Protein Assay kit (Bio-Rad). Western blot analysis was performed according to the manufacturer’s instruction (Bio-Rad) and as previously described.Citation13,Citation24 Protein densitometry was performed using Image Lab v4.1 software (Bio-Rad). The working dilution and sources of both primary and secondary antibodies for the western blot analysis include: rabbit anti-P-ERK1/2, 1:1000 (# 9101, Cell Signaling Technologies); rabbit anti-ERK1/2, 1:1000 (# 4695, Cell Signaling Technologies); rabbit anti-P-EGFR (Y1173), 1:1000 (# sc-12351-R, Santa Cruz Biotechnology); rabbit anti-EGFR, 1:1000 (# sc-03, Santa Cruz Biotechnology); and secondary rabbit anti-IgG, HRP conjugated (# ab97064, Abcam).
Statistical analysis
GraphPad Prism 6 (GraphPad Software Inc., La Jolla, CA, USA) software was used for statistical testing by one-way analysis of variance (ANOVA) followed by Tukey’s post hoc test as indicated in the figure legends.
Results
Expression of α2-ADRs in MIO-M1 cells
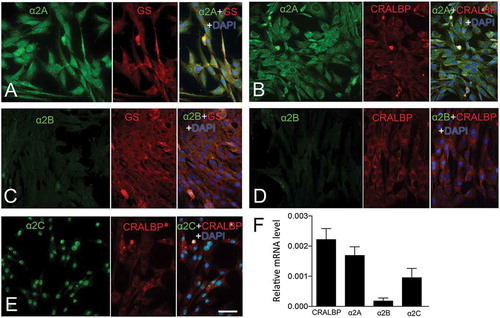
The expression of the three α2-ADR subtypes α2A, α2B, and α2C was studied by using immunocytochemistry and α2A-ADR immunoreactivity (IR) was diffuse in all cells over the entire cell as expected for a plasma membrane location (, ). Müller cell markers glutamine synthetase (GS) and cellular retinaldehyde-binding protein (CRALBP) showed granular cytoplasmic and perinuclear IR (, ).Citation17 Very low α2B-ADR IR was detected in the cells (, ). The α2C-ADR IR was mainly nuclear (). The qRT-PCR analysis was used to quantify the relative mRNA levels of the three α2-ADR subtypes. We found relatively high levels of α2A-ADR, very low levels of α2B-ADR and moderate levels of α2C-ADR mRNA ().
Figure 1. Expression of α2-ADRs in MIO-M1 human Müller cells.
Fluorescence micrographs of immunocytochemistry for (A, B) α2A-ADR, (C, D) α2B-ADR, (E) α2C-ADR, and (A–E) the Müller cell markers, GS and CRALBP. (F) qRT-PCR analysis of α2-ADR mRNA levels in MIO-M1 Müller cell culture. Bar graph shows normalized mRNA levels relative to β-actin for CRALBP, α2A-ADR, α2B-ADR and α2C-ADR mRNA in MIO-M1 Müller cell line. Bar graph is mean ± SEM, n = 6. Scale bar in (E) is 30 μm; valid also for (A–D).
Stimulation of α2-ADRs causes phosphorylation of ERK1/2 MAPK in MIO-M1 cells
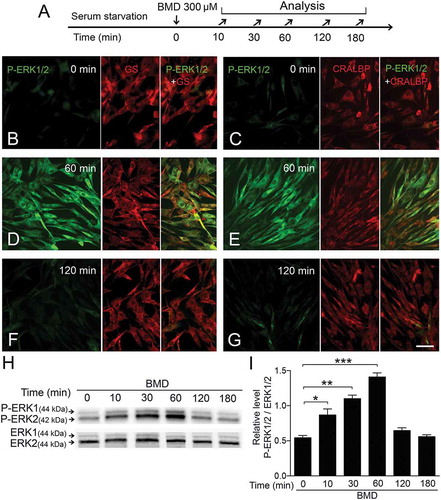
We used BMD to stimulate α2-ADRs and studied the activation of ERK1/2 MAPK by P-ERK1/2 immunocytochemistry and western blot analysis. Cells were serum-starved for 16 h to attain the basal P-ERK1/2 levels, treated with BMD or vehicle, and analyzed at several times (). A strong cytoplasmic and perinuclear P-ERK1/2 IR was observed in the MIO-M1 cells at 60 min after BMD treatment and background levels at 180 min (–). The P-ERK1/2 IR co-labeled with GS and CRALBP IR (–). Western blot analysis confirmed the immunocytochemistry results (). P-ERK1/2 levels were normalized to total ERK1/2 levels and densitometric analysis showed that P-ERK1/2 levels increased within 10 min after BMD treatment, with peak levels at 60 min and gradually decreased to lower levels by 120 min (). These results showed that stimulation of α2-ADRs triggered ERK1/2 phosphorylation in the MIO-M1 cells.
Figure 2. Brimonidine (BMD) treatment phosphorylates ERK1/2 in MIO-M1 human Müller cells.
(A) Experimental outline. Serum-starved MIO-M1 cells were treated with 300 μM BMD and analyzed at 0 min up to 180 min time points. (B–G) Fluorescence micrographs showing immunocytochemistry for P-ERK1/2, green and the Müller cell markers GS and CRALBP, red at (B, C) 0 min, (D, E) 60 min, and (F, G) 180 min time points after BMD treatment. (H) Western blot analysis of P-ERK1/2 levels in BMD-treated MIO-M1 Müller cells. (I) Bar graph with densitometry of P-ERK1/2 levels normalized by total ERK1/2 levels. Bar graph is mean ± SEM, n = 3 (*P < 0.01, **P < 0.001, ***P < 0.0001) analyzed by one-way ANOVA and Tukey’s post hoc test. Scale bar in (G) is 30 μm; valid also for (B–F). Significance is only indicated for comparisons: BMD 0 min–BMD 10, 30 and 60 min.
α2-ADR stimulation accelerates phosphorylation of AKT kinase in MIO-M1 cells
We stimulated the MIO-M1 cells with BMD and studied the PI3K pathway by P-AKT (Thr-308)-western blot analysis. Phosphorylation of threonine residue 308 of AKT is indicative of an active PI3K-pathway after growth factor stimulation.Citation25 Serum-starved human cells were treated with BMD and analyzed (). Western blot analysis was performed to quantify the P-AKT (Thr-308) levels (), which were normalized to non-phosphorylated (pan) AKT levels (). Densitometric analysis showed that P-AKT (Thr-308) levels increased within 10 min after BMD treatment, with peak levels at 60 min and lower levels by 120 min (). This result showed that the AKT is phosphorylated after α2-ADR stimulation in MIO-M1 cells.
Figure 3. Brimonidine (BMD) treatment induces phosphorylation of AKT in MIO-M1 human Müller cells.
(A) Experimental outline. Serum-starved MIO-M1 cells were treated with 300 μM BMD and analyzed at 0 min up to 180 min time points. (B) Western blot analysis of P-AKT (Thr-308) levels in BMD-treated MIO-M1 cells. (C) Bar graph with densitometry of P-AKT (Thr-308) levels normalized by AKT (Pan) levels. Bar graph is mean ± SEM, n = 3 (**P < 0.001, ***P < 0.0001) analyzed by one-way ANOVA and Tukey’s post hoc test. Significance is only indicated for comparisons: BMD 0 min–BMD 30 and 60 min.
Blocking of α2-ADRs inhibits ERK1/2 and AKT phosphorylation in MIO-M1 cells
To corroborate that BMD-induced ERK1/2 and AKT phosphorylation in the MIO-M1 cells was due to stimulation of α2-ADR signaling, we studied the effects of the selective α2-ADR blocker yohimbine.Citation26 Serum-starved human cells were pretreated with yohimbine and then treated with BMD (). Western blot analysis was used to quantify the P-ERK1/2 and P-AKT (Thr-308) levels and densitometric analysis showed that yohimbine treatment reduced the P-ERK1/2 (, ) and P-AKT (Thr-308) (, ) levels to control levels. Cells treated only with yohimbine did not alter the basal P-ERK1/2 (, ) or P-AKT (Thr-308) (, ) levels.
Figure 4. Blocking of brimonidine (BMD)-induced P-ERK1/2 or P-AKT (Thr-308) in MIO-M1 human Müller cells by yohimbine treatment.
(A) Experimental outline. Serum-starved MIO-M1 cells pretreated with 100 μM yohimbine or control (vehicle) for 30 min followed by treated with 300 μM BMD or vehicle for 60 min. Western blot analysis of (B) P-ERK1/2 and (D) P-AKT (Thr-308) levels in BMD-treated MIO-M1 cells. Bar graphs with densitometry of (C) P-ERK1/2 levels normalized by total ERK1/2 levels, and (E) P-AKT (Thr-308) levels normalized by AKT (Pan) levels. Bar graph are mean ± SEM, n = 3 (***P < 0.0001) analyzed by one-way ANOVA and Tukey’s post hoc test. Significance is only indicated for the comparison: BMD 60 min–BMD + yohimbine 60 min.
BMD-induced transactivation of EGFRs in MIO-M1 cells
α2-ADRs are G-protein-coupled receptors (GPCRs)Citation27 that have been showed to be involved in transactivation of EGFR in different cell types.Citation28 To assess whether α2-ADRs can transactivate EGFRs in MIO-M1 cells, we studied the effect of the EGFR kinase inhibitor AG1478Citation29 on BMD-induced ERK1/2 and AKT phosphorylation with EGF-induced ERK1/2 phosphorylation in the MIO-M1 cells as a positive control. Serum-starved MIO-M1 cells were treated with AG1478 for 30 min and then with BMD or EGF (). Western blot analysis was used to assay the effects of AG1478 on the cells (–). We found that AG1478 pretreatment in MIO-M1 cells reduced the P-ERK1/2 (, ) levels to basal levels and inhibited the EGF-induced ERK1/2 phosphorylation (, ). AG1478 pretreatment also reduced P-AKT (Thr-308) levels to basal levels (, ), indicating that phosphorylation of both ERK and AKT was down-stream of the EGFR. We did not observe any alternation of basal P-ERK1/2 and P-AKT (Thr-308) levels in cells treated only with AG1478 (, ).
Figure 5. Effects of EGFR kinase inhibitor AG1478 or EGFR-siRNA on brimonidine (BMD)-induced P-ERK1/2 or P-AKT (Thr-308) in MIO-M1 human Müller cells.
(A) Experimental outline. Serum-starved MIO-M1 cells pretreated with 100 μM AG1478 or control (vehicle) for 30 min followed by treatment with 300 μM BMD or vehicle for 60 min or with EGF 100 ng/mL or vehicle for 10 min. Western blot analyses of P-ERK1/2 levels in MIO-M1 cells treated with (B, C) BMD + AG1478 and (D, E) EGF + AG1478 and P-AKT (Thr-308) levels treated with (F, G) BMD + AG1478. Bar graph with densitometry of (C, E) P-ERK1/2 levels normalized to total ERK1/2 levels, and (G) P-AKT (Thr-308) levels normalized to AKT (Pan) levels. (H) MIO-M1 human Müller cells transfected with EGFR-siRNA or non-targeted siRNA (NT-siRNA) in absence of serum for 48 hours followed by treatment with 300 μM BMD or vehicle for 60 min. (I) Western blot analysis of P-ERK 1/2 and P-AKT (Thr-308) levels treated with BMD + EGFR-siRNA or BMD + NT-siRNA. Bar graph with densitometry of (J) P-ERK1/2 levels normalized to total ERK1/2 levels and (K) P-AKT (Thr-308) levels normalized to AKT (Pan) levels. Bar graphs are mean ± SEM, n = 3 (***P < 0.0001) analyzed by one-way ANOVA and Tukey’s post hoc test. Significance is only indicated for the comparisons: BMD 60 min–BMD + AG1478 60 min, EGF 10 min–EGF + AG1478 10 min, BMD 60 min–BMD + NT-siRNA 60 min and BMD 60 min–BMD + EGFR-siRNA 60 min.
To corroborate the involvement of the EGFR, we performed siRNA-mediated knock down of the EGFR expression in the MIO-M1 cells. Cells were transfected with EGFR-siRNA or control non-target siRNA for 48 h, followed by treatment with BMD for 60 min (). Western blot analysis was used to quantify the effects. We found that EGFR-siRNA specifically knocked down the EGFR levels () and consistent with reduced EGFR levels, EGFR-siRNA-transfected cells showed significantly reduced P-ERK1/2 (, ) and P-AKT (Thr-308) levels (, ) compared to non-transfected or non-target siRNA.
Figure 6. Brimonidine (BMD) treatment phosphorylates the tyrosine 1173 residue (Y1173) of EGFR in MIO-M1 human Müller cells.
(A) Experimental outline. Serum-starved MIO-M1 cells treated with 300 μM BMD or control (vehicle), 100 ng/mL EGF and P-EGFR (Y1173) levels were analyzed at 0–180 min time points. Immunocytochemistry was performed on harvested cells 60 min after BMD or vehicle treatment and 10 min after EGF treatment. Fluorescence micrographs showing immunocytochemistry for phospho-Y1173 of the EGFR and for Müller cell marker GS on (B–D) control, and (E–G) BMD- and (H–J) EGF-treated cells. (K) Western blot analysis of P-EGFR (Y1173) levels in MIO-M1 cells at indicated time points after BMD treatment. (L) Bar graph with densitometry of P-EGFR (Y1173) levels normalized to total EGFR levels. Bar graph is mean ± SEM, n = 3 (*P < 0.01, **P < 0.001, ***P < 0.0001) analyzed by one-way ANOVA and Tukey’s post hoc test. Scale bar in (J) is 30 μm; valid also for (B–I). Significance is only indicated for comparisons: BMD 0 min–BMD 10, 30 and 60 min.
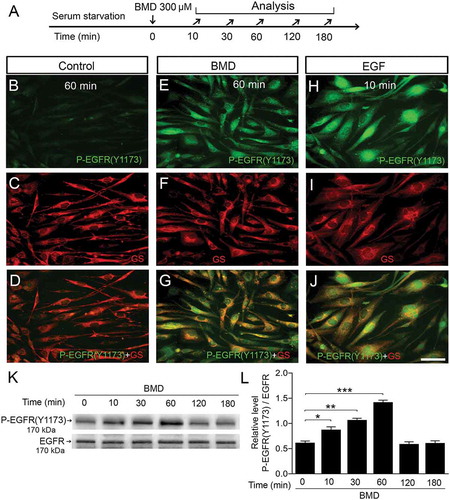
Studies have shown that phosphorylation of residue tyrosine 1173 in the EGFR is important for EGFR signaling.Citation30 Serum-starved human MIO-M1 cells had distinct P-EGFR (Y1173) IR at 60 min after BMD treatment with levels comparable with cells stimulated by EGF as a positive control (–). Co-labeling with GS supported the Müller cell-phenotype of the cells (–). There was no increase of P-EGFR (Y1173) IR in serum-starved control cells (, ). Western blot analysis corroborated the increase of P-EGFR (Y-1173) levels after BMD treatment (). P-EGFR (Y1173) levels were normalized to EGFR levels and we found a similar pattern of P-EGFR (Y-1173) as P-ERK1/2, with peak levels at 60 min that gradually decreased to background levels by 180 min (). The results are consistent with BMD-induced ERK1/2-, AKT phosphorylation and EGFR transactivation in MIO-M1 cells.
BMD-induced ERK1/2 and AKT phosphorylation requires SRC-kinase activity
Cytosolic Src is a non-receptor tyrosine kinase and mediates GPCR-triggered ERK1/2 activation by transactivation of EGFRs.Citation31,Citation32 To investigate whether BMD-induced ERK1/2 and AKT phosphorylation is Src-kinase-dependent, we studied the effects of the Src-kinase inhibitors PP1 and PP2 on BMD-induced ERK1/2 and AKT phosphorylation. As a control, we studied the effect of PP1 or PP2 on EGF-induced ERK1/2 phosphorylation. Serum-starved cells were pretreated 20 min with PP1 or PP2 before treatment with BMD or EGF (). Western blot analysis showed that blocking of Src-kinase by PP1 or PP2 reduced the P-ERK1/2 and P-AKT levels to control levels in the MIO-M1 cells (, , , ). We did not observe any effect of PP1 or PP2 on EGF-induced ERK1/2 phosphorylation (, ). Cells treated only with PP1 or PP2 expressed basal P-ERK1/2 and AKT levels (, , , ). These results show that cytosolic Src-kinase is involved in BMD-induced ERK1/2 and AKT phosphorylation in MIO-M1 cells.
Figure 7. Effects of Src-kinase inhibitors PP1 and PP2 on brimonidine (BMD)-induced P-ERK1/2 or P-AKT (Thr-308) or P-EGFR (Y1173) in MIO-M1 human Müller cells.
(A) Experimental outline. Serum-starved MIO-M1cells pretreated with 5 μM PP1 or 5 μM PP2, or control (vehicle) for 20 min followed by treatment with 300 μM BMD or vehicle for 60 min or with 100 ng/mL EGF or vehicle for 10 min. Western blot analyses of (B–E) P-ERK1/2 levels, (F, G) P-AKT (Thr-308) levels and (H, I) P-EGFR (Y1173) levels in MIO-M1 Müller cells. Bar graphs with densitometry of (C, E) P-ERK1/2 levels normalized to total ERK1/2 levels and (G) P-AKT (Thr-308) levels normalized to AKT (Pan) levels and (I) P-EGFR (Y1173) levels normalized to total EGFR levels. Bar graphs are mean ± SEM, n = 3 (***P < 0.0001) analyzed by one-way ANOVA and Tukey’s post hoc test. Significance is only indicated for the comparisons: BMD 60 min–BMD + PP1 60 min, and BMD 60 min–BMD + PP2 60 min.
To assess whether Src-kinase inhibitors altered the transactivation of EGFR after BMD treatment, we studied the effects of PP1 or PP2 on BMD-induced P-EGFR (Y-1173) and western blot analysis showed that PP1 as well as PP2 treatments reduced BMD-induced P-EGFR (Y-1173) levels in the cells (, ). These results demonstrate that BMD-induced EGFR-transactivation is Src-kinase dependent in MIO-M1 cells.
Matrix metalloproteinase is involved in BMD-induced ERK1/2 and AKT phosphorylation in MIO-M1 cells
The MMPs have been shown to be involved in GPCR-induced transactivation of EGFRs.Citation15,Citation33 Active MMPs release proteolytically the membrane-bound form of HB-EGF that binds to and activates EGFRs in an autocrine ligand-dependent fashion with subsequent activation of ERK1/2 and AKT.Citation15,Citation34 To investigate if BMD-induced ERK1/2 and AKT phosphorylation requires MMP activity in the MIO-M1 cells, we analyzed the effect of GM6001, a broad-spectrum MMPs inhibitorCitation35 on BMD-induced ERK1/2 and AKT phosphorylation. Serum-starved MIO-M1 cells were treated with GM6001 for 30 min followed by BMD or EGF (). Western blot analysis was performed to study the effect of GM6001 (–). We found that GM6001 pretreatment significantly inhibited the BMD-induced P-ERK1/2 (, ) and P-AKT (Thr-308) (, g) but not EGF-induced P-ERK1/2 (, ). GM6001 treatment only did not alter the basal P-ERK1/2 or P-AKT (Thr-309) levels (, , , ). The results show that MMP activity is block able by GM6001 and indicate that MMPs are involved in BMD-induced ERK1/2 and AKT phosphorylation in these cells.
Figure 8. Effect of MMPs inhibitor GM6001 on BMD-induced ERK1/2 or AKT activation and expression of EGFR and its ligand HB-EGF in MIO-M1 human Müller cells.
(A) Experimental outline. Serum-starved MIO-M1 cells pretreated with 50 μM GM6001 or control (vehicle) for 30 min followed by treatment with 300 μM BMD or vehicle for 60 min or with 100 ng/mL EGF or vehicle for 10 min. Western blot analyses of P-ERK1/2 levels treated with (B) BMD + GM6001 and (D) EGF + GM6001 and P-AKT (Thr-308) levels in MIO-M1 cells. Bar graphs with densitometry of (C, E) P-ERK1/2 levels normalized to total ERK1/2 levels and (G) P-AKT (Thr-308) levels normalized to AKT (Pan) levels. (H, I) qRT-PCR analysis of HB-EGF and EGFR mRNA levels in normal and BMD-treated MIO-M1 cells. Serum-starved cells treated with 300 μM BMD or vehicle and analyzed at 0, 10, 30, 60 and 120 min time points. Bar graph shows normalized mRNA levels relative to β-actin for (H) HB-EGF and (I) EGFR mRNA. Bar graphs are mean ± SEM, n = 3 (*P < 0.01, **P < 0.001) analyzed by one-way ANOVA and Tukey’s post hoc test. Significance is only indicated for the comparisons: Control 60 min–BMD + GM6001 60 min, and BMD 60 min–BMD + GM6001 60 min.
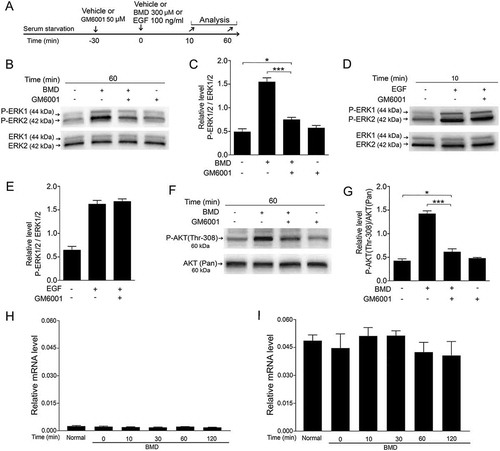
HB-EGF is the one of several endogenous ligands that may activate the EGFR.Citation36 We confirmed the expression of HB-EGF in the MIO-M1 cells and analyzed whether BMD induced the expression of HB-EGF or EGFR. HB-EGF and EGFR mRNA expression remained at the same level at different time points after BMD treatment (, ). The results corroborated expression of HB-EGF and EGFR mRNAs in MIO-M1 cells and showed that their expression is not transcriptionally regulated by the BMD treatment.
Discussion
In this work, we have studied the expression of α2-ADRs and signal transduction responses after stimulation of the human MIO-M1 Müller cell line, with the α2-ADR agonist BMD. Our results confirm that the cells express α2A-ADR and that BMD caused robust MAPK- and PI3K signaling with phosphorylation of ERK1/2 and AKT. The signaling was mediated by Src-kinase with involvement of both ligand-dependent and ligand-independent transactivation of EGFRs.
The data showed that MIO-M1 cells mainly express α2A-ADR localized to cell somata with lower levels of α2B and α2C (). α2A-ADR expression is found in ocular tissues in different species,Citation37,Citation38 and the expression in MIO-M1 cells is similar to chicken primary Müller cells, studied both in vitro and in vivo.Citation13 The nuclear localization of the α2C-ADR IR was unexpected because GPCRs are normally in the plasma membrane. However, nuclear localization has been demonstrated for several GPCRs including ADRs.Citation39,Citation40 The qRT-PCR results for the α2-ADRs were consistent with that of the cytochemical analyses.
α2-ADR agonists (e.g., Clonidine, Tizanidine, Dexmedetomodine) are used for various clinical indications including pain, sedation and to reduce anesthetic requirements, withdrawal symptoms,Citation41 and BMD specifically has been used for the treatment of open-angle glaucoma and ocular hypertension.Citation42 A large number of experimental preclinical studies suggest that BMD can protect retinal ganglion cells against injury and the function of Müller cells has been implied in the protection. However, the cellular mechanisms are not fully resolved. Our results show that stimulation of the MIO-M1 human Müller cell line with BMD resulted in a robust ERK1/2 and AKT phosphorylation with transactivation of EGFRs. The specificity of the stimulation was confirmed by the ability of the α2-ADR-specific blocker yohimbine to inhibit the activation. The engagement of EGFR in the response was shown both by the ability of the EGFR-kinase inhibitor AG1478 and siRNA knock down of EGFR expression, to inhibit the phosphorylation of ERK1/2 and AKT after BMD stimulation. The Src-kinase blockers, PP1 and PP2, abolished the BMD-induced ERK1/2 phosphorylation but were not able to block EGF-induced ERK1/2 phosphorylation, showing that the BMD-induced transactivation require Src activity, and confirmed the well-known fact that EGFR signaling in itself does not. Studies have shown that Src-kinase can directly associate with the catalytic domain of EGFRs and activate EGFRs in a ligand-independent pathway in epithelial and fibroblast cells.Citation43,Citation44 The BMD stimulation of the MIO-M1 cells resulted in phosphorylation of 1173 tyrosine residue of EGFR, which is one of the major autophosphorylation site that allows interaction of adapter proteins GRB2, SOS and SHC to intracellular domain of EGFR and that facilitates Ras-Raf activated MAPK/ERK and PI3K-activated AKT signaling.Citation45,Citation46
Membrane-bound extracellular MMPs have key roles in α2-ADR-induced EGFR transactivation.Citation28,Citation34 Activation of MMP leads to proteolytic release of membrane-bound HB-EGF or TGFα, which stimulate EGFRs in an auto- or paracrine mode of action.Citation15 Cytosolic Src-kinase activates MMPsCitation47 and the abrogated α2-ADR agonist-induced phosphorylation of ERK1/2 and AKT using the MMP blocker GM6001, indicated a ligand-dependent mechanism for EGFR transactivation in these cells. However, the phosphorylation of ERK1/2 and AKT was not completely blocked by MMP inhibitor treatment, indicating that both ligand-dependent and ligand-independent EGFR activation occurs in the MIO-M1 cells. HB-EGF is one of the endogenous EGFR ligands and we show that MIO-M1 cells express it. The expression was not induced or increased by the BMD treatment, indicating that the increased EGFR signaling was not due to increased HB-EGF synthesis. Instead, the increased EGFR signaling was likely due to increased shedding of plasma membrane-bound HB-EGF by MMPs as indicated by the blocking effect of the MMP-inhibitor GM6001. Further studies are required to demonstrate that HB-EGF is the only endogenous ligand that mediates the transactivation of EGFRs in human MIO-M1 cells.
In conclusion, our data show that the human MIO-M1 Müller cells express α2A-ADR and their stimulation triggers Src-kinase mediated ERK1/2 and AKT signaling, which involve both ligand-dependent and ligand-independent EGFR transactivation. The results from human cells are in line with our previous data based on animal cells, showing that stimulation of ADRs on retinal Müller cells may be used to modulate the immediate events in Müller cell dedifferentiation after an acute injury. The result also adds to an evolutionary perspective. Müller cells are a source for retinal regeneration after injury in several vertebrates, e.g. fish, frog and chicken, which is not observed to the same extent in mammals. However, these results indicate that the response by human Müller cells after injury may be targeted by α2A-ADR agonists as was shown for chicken Müller cells. The results provide knowledge that contributes to the development of a potential pharmacological strategy to regulate the responses of human Müller cell in a situation with injury or disease.
Acknowledgments
Authors would like to thank Ingvar Ferby for assisting with the EGFR-siRNA knock down.
Disclosure statement
Authors declare no conflicts of interest.
Additional information
Funding
References
- Bringmann A, Pannicke T, Biedermann B, Francke M, Iandiev I, Grosche J, Wiedemann P, Albrecht J, Reichenbach A. Role of retinal glial cells in neurotransmitter uptake and metabolism. Neurochem Int. 2009;54(3–4):143–60. doi:10.1016/j.neuint.2008.10.014.
- Bringmann A, Pannicke T, Grosche J, Francke M, Wiedemann P, Skatchkov SN, Osborne NN, Reichenbach A. Muller cells in the healthy and diseased retina. Prog Retin Eye Res. 2006;25(4):397–424. doi:10.1016/j.preteyeres.2006.05.003.
- Fischer AJ, Reh TA. Muller glia are a potential source of neural regeneration in the postnatal chicken retina. Nat Neurosci. 2001;4(3):247–52. doi:10.1038/85090.
- Dyer MA, Cepko CL. Control of Muller glial cell proliferation and activation following retinal injury. Nat Neurosci. 2000;3(9):873–80. doi:10.1038/78774.
- Wan J, Goldman D. Retina regeneration in zebrafish. Curr Opin Genet Dev. 2016;40:41–47. doi:10.1016/j.gde.2016.05.009.
- Fischer AJ, Scott MA, Tuten W. Mitogen-activated protein kinase-signaling stimulates Muller glia to proliferate in acutely damaged chicken retina. Glia. 2009;57(2):166–81. doi:10.1002/glia.20743.
- Wan J, Ramachandran R, Goldman D. HB-EGF is necessary and sufficient for Muller glia dedifferentiation and retina regeneration. Dev Cell. 2012;22(2):334–47. doi:10.1016/j.devcel.2011.11.020.
- Todd L, Volkov LI, Zelinka C, Squires N, Fischer AJ. Heparin-binding EGF-like growth factor (HB-EGF) stimulates the proliferation of Muller glia-derived progenitor cells in avian and murine retinas. Mol Cell Neurosci. 2015;69:54–64. doi:10.1016/j.mcn.2015.10.004.
- Karl MO, Hayes S, Nelson BR, Tan K, Buckingham B, Reh TA. Stimulation of neural regeneration in the mouse retina. Proc Natl Acad Sci U S A. 2008;105(49):19508–13. doi:10.1073/pnas.0807453105.
- Jorstad NL, Wilken MS, Grimes WN, Wohl SG, VandenBosch LS, Yoshimatsu T, Wong RO, Rieke F, Reh TA. Stimulation of functional neuronal regeneration from Muller glia in adult mice. Nature. 2017. doi:10.1038/nature23283.
- Ueki Y, Wilken MS, Cox KE, Chipman L, Jorstad N, Sternhagen K, Simic M, Ullom K, Nakafuku M, Reh TA. Transgenic expression of the proneural transcription factor Ascl1 in Muller glia stimulates retinal regeneration in young mice. Proc Natl Acad Sci U S A. 2015;112(44):13717–22. doi:10.1073/pnas.1510595112.
- Peng M, Li Y, Luo Z, Liu C, Laties AM, Wen R. Alpha2-adrenergic agonists selectively activate extracellular signal-regulated kinases in Muller cells in vivo. Invest Ophthalmol Vis Sci. 1998;39:1721–26.
- Harun-Or-Rashid M, Lindqvist N, Hallbook F. Transactivation of EGF receptors in chicken Muller cells by alpha2A-adrenergic receptors stimulated by brimonidine. Invest Ophthalmol Vis Sci. 2014;55(6):3385–94. doi:10.1167/iovs.13-13823.
- Harun-Or-Rashid M, Diaz-DelCastillo M, Galindo-Romero C, Hallbook F. Alpha2-adrenergic-agonist brimonidine stimulates negative feedback and attenuates injury-induced phospho-ERK and dedifferentiation of chicken muller cells. Invest Ophthalmol Vis Sci. 2015;56(10):5933–45. doi:10.1167/iovs.15-16816.
- Karkoulias G, Mastrogianni O, Lymperopoulos A, Paris H, Flordellis C. lpha(2)-Adrenergic receptors activate MAPK and Akt through a pathway involving arachidonic acid metabolism by cytochrome P450-dependent epoxygenase, matrix metalloproteinase activation and subtype-specific transactivation of EGFR. Cell Signal. 2006;18(5):729–39. doi:10.1016/j.cellsig.2005.06.014.
- Lawrence JM, Singhal S, Bhatia B, Keegan DJ, Reh TA, Luthert PJ, Khaw PT, Limb GA. MIO-M1 cells and similar muller glial cell lines derived from adult human retina exhibit neural stem cell characteristics. Stem Cells. 2007;25(8):2033–43. doi:10.1634/stemcells.2006-0724.
- Limb GA, Salt TE, Munro PM, Moss SE, Khaw PT. In vitro characterization of a spontaneously immortalized human Muller cell line (MIO-M1). Invest Ophthalmol Vis Sci. 2002;43:864–69.
- Ezzoukhry Z, Louandre C, Trecherel E, Godin C, Chauffert B, Dupont S, Diouf M, Barbare JC, Maziere JC, Galmiche A. EGFR activation is a potential determinant of primary resistance of hepatocellular carcinoma cells to sorafenib. Int J Cancer. 2012;131(12):2961–69. doi:10.1002/ijc.27604.
- Hu C, Huang L, Gest C, Xi X, Janin A, Soria C, Li H, Lu H. Opposite regulation by PI3K/Akt and MAPK/ERK pathways of tissue factor expression, cell-associated procoagulant activity and invasiveness in MDA-MB-231 cells. J Hematol Oncol. 2012;5:16. doi:10.1186/1756-8722-5-16.
- Miyawaki M, Yasuda H, Tani T, Hamamoto J, Arai D, Ishioka K, Ohgino K, Nukaga S, Hirano T, Kawada I, et al. Overcoming EGFR bypass signal-induced acquired resistance to ALK tyrosine kinase inhibitors in ALK-translocated lung cancer. Mol Cancer Res. 2017;15(1):106–14. doi:10.1158/1541-7786.MCR-16-0211.
- Boije H, Harun-Or-Rashid M, Lee YJ, Imsland F, Bruneau N, Vieaud A, Gourichon D, Tixier-Boichard M, Bed’hom B, Andersson L, et al. Sonic Hedgehog-signalling patterns the developing chicken comb as revealed by exploration of the pea-comb mutation. PLoS One. 2012;7(12):e50890. doi:10.1371/journal.pone.0050890.
- Vandesompele J, De Preter K, Pattyn F, Poppe B, Van Roy N, De Paepe A, Speleman F. Accurate normalization of real-time quantitative RT-PCR data by geometric averaging of multiple internal control genes. Genome Biol. 2002;3(7):RESEARCH0034. doi:10.1186/gb-2002-3-7-research0034.
- Livak KJ, Schmittgen TD. Analysis of relative gene expression data using real-time quantitative PCR and the 2(-delta delta C(T)) method. Methods. 2001;25(4):402–08. doi:10.1006/meth.2001.1262.
- Ka S, Markljung E, Ring H, Albert FW, Harun-Or-Rashid M, Wahlberg P, Garcia-Roves PM, Zierath JR, Denbow DM, Paabo S, et al. Expression of carnitine palmitoyl-CoA transferase-1B is influenced by a cis-acting eQTL in two chicken lines selected for high and low body weight. Physiol Genomics. 2013;45(9):367–76. doi:10.1152/physiolgenomics.00078.2012.
- Alessi DR, Andjelkovic M, Caudwell B, Cron P, Morrice N, Cohen P, Hemmings BA. Mechanism of activation of protein kinase B by insulin and IGF-1. EMBO J. 1996;15:6541–51.
- Verwaerde P, Tran MA, Montastruc JL, Senard JM, Portolan G. Effects of yohimbine, an alpha 2-adrenoceptor antagonist, on experimental neurogenic orthostatic hypotension. Fundam Clin Pharmacol. 1997;11(6):567–75. doi:10.1111/j.1472-8206.1997.tb00862.x.
- Takigawa M, Sakurai T, Kasuya Y, Abe Y, Masaki T, Goto K. Molecular identification of guanine-nucleotide-binding regulatory proteins which couple to endothelin receptors. Eur J Biochem. 1995;228(1):102–08. doi:10.1111/ejb.1995.228.issue-1.
- Daub H, Weiss FU, Wallasch C, Ullrich A. Role of transactivation of the EGF receptor in signalling by G-protein-coupled receptors. Nature. 1996;379(6565):557–60. doi:10.1038/379557a0.
- Han Y, Caday CG, Nanda A, Cavenee WK, Huang HJ, Tyrphostin AG. 1478 preferentially inhibits human glioma cells expressing truncated rather than wild-type epidermal growth factor receptors. Cancer Res. 1996;56:3859–61.
- Kong L, Deng Z, Shen H, Zhang Y. Src family kinase inhibitor PP2 efficiently inhibits cervical cancer cell proliferation through down-regulating phospho-Src-Y416 and phospho-EGFR-Y1173. Mol Cell Biochem. 2011;348(1–2):11–19. doi:10.1007/s11010-010-0632-1.
- Hanke JH, Gardner JP, Dow RL, Changelian PS, Brissette WH, Weringer EJ, Pollok BA, Connelly PA. Discovery of a novel, potent, and Src family-selective tyrosine kinase inhibitor. Study of Lck- and FynT-dependent T cell activation. J Biol Chem. 1996;271(2):695–701. doi:10.1074/jbc.271.2.695.
- Luttrell LM, Della Rocca GJ, van Biesen T, Luttrell DK, Lefkowitz RJ. Gbetagamma subunits mediate Src-dependent phosphorylation of the epidermal growth factor receptor. A scaffold for G protein-coupled receptor-mediated Ras activation. J Biol Chem. 1997;272(7):4637–44. doi:10.1074/jbc.272.7.4637.
- Du T, Li B, Liu S, Zang P, Prevot V, Hertz L, Peng L. ERK phosphorylation in intact, adult brain by alpha(2)-adrenergic transactivation of EGF receptors. Neurochem Int. 2009;55(7):593–600. doi:10.1016/j.neuint.2009.05.016.
- Prenzel N, Zwick E, Daub H, Leserer M, Abraham R, Wallasch C, Ullrich A. EGF receptor transactivation by G-protein-coupled receptors requires metalloproteinase cleavage of proHB-EGF. Nature. 1999;402(6764):884–88. doi:10.1038/47260.
- Santiskulvong C, Rozengurt E. Galardin (GM 6001), a broad-spectrum matrix metalloproteinase inhibitor, blocks bombesin- and LPA-induced EGF receptor transactivation and DNA synthesis in rat-1 cells. Exp Cell Res. 2003;290(2):437–46. doi:10.1016/S0014-4827(03)00355-0.
- Pierce KL, Tohgo A, Ahn S, Field ME, Luttrell LM, Lefkowitz RJ. Epidermal growth factor (EGF) receptor-dependent ERK activation by G protein-coupled receptors: a co-culture system for identifying intermediates upstream and downstream of heparin-binding EGF shedding. J Biol Chem. 2001;276(25):23155–60. doi:10.1074/jbc.M101303200.
- Kalapesi FB, Coroneo MT, Hill MA. Human ganglion cells express the alpha-2 adrenergic receptor: relevance to neuroprotection. Br J Ophthalmol. 2005;89(6):758–63. doi:10.1136/bjo.2004.053025.
- Woldemussie E, Wijono M, Pow D. Localization of alpha 2 receptors in ocular tissues. Vis Neurosci. 2007;24(5):745–56. doi:10.1017/S0952523807070605.
- Wright CD, Wu SC, Dahl EF, Sazama AJ, O’Connell TD. Nuclear localization drives alpha1-adrenergic receptor oligomerization and signaling in cardiac myocytes. Cell Signal. 2012;24(3):794–802. doi:10.1016/j.cellsig.2011.11.014.
- Bhosle VK, Rivera JC, Chemtob S. New insights into mechanisms of nuclear translocation of G-protein coupled receptors. Small GTPases. 2017:1–10. doi:10.1080/21541248.2017.1282402.
- Giovannitti JA Jr., Thoms SM, Crawford JJ. Alpha-2 adrenergic receptor agonists: a review of current clinical applications. Anesth Prog. 2015;62(1):31–39. doi:10.2344/0003-3006-62.1.31.
- Greenfield DS, Liebmann JM, Ritch R. Brimonidine: a new alpha2-adrenoreceptor agonist for glaucoma treatment. J Glaucoma. 1997;6(4):250–58. doi:10.1097/00061198-199708000-00010.
- Biscardi JS, Maa MC, Tice DA, Cox ME, Leu TH, Parsons SJ. c-Src-mediated phosphorylation of the epidermal growth factor receptor on Tyr845 and Tyr1101 is associated with modulation of receptor function. J Biol Chem. 1999;274(12):8335–43. doi:10.1074/jbc.274.12.8335.
- Kim H, Chan R, Dankort DL, Zuo D, Najoukas M, Park M, Muller WJ. The c-Src tyrosine kinase associates with the catalytic domain of ErbB-2: implications for ErbB-2 mediated signaling and transformation. Oncogene. 2005;24(51):7599–607. doi:10.1038/sj.onc.1208898.
- Rojas M, Yao S, Lin YZ. Controlling epidermal growth factor (EGF)-stimulated Ras activation in intact cells by a cell-permeable peptide mimicking phosphorylated EGF receptor. J Biol Chem. 1996;271(44):27456–61. doi:10.1074/jbc.271.44.27456.
- Zhou J, Du T, Li B, Rong Y, Verkhratsky A, Peng L. Crosstalk between MAPK/ERK and PI3K/AKT signal pathways during brain ischemia/reperfusion. ASN Neuro. 2015;7:5. doi:10.1177/1759091415602463.
- Gutwein P, Oleszewski M, Mechtersheimer S, Agmon-Levin N, Krauss K, Altevogt P. Role of Src kinases in the ADAM-mediated release of L1 adhesion molecule from human tumor cells. J Biol Chem. 2000;275(20):15490–97. doi:10.1074/jbc.275.20.15490.