
ABSTRACT
Purpose/Aim
Many genes have been associated with primary open-angle glaucoma (POAG). Knowing exactly where they are expressed in the eye helps to unravel POAG pathology and to select optimal targets for intervention. We investigated whether RNA in situ hybridization (RNA-ISH) is a convenient technique to obtain detailed pan-ocular expression data of these genes. We tested this for four diverse candidate POAG genes, selected because of unclear ocular distribution (F5 and Dusp1) and relevance for potential new therapies (Tnf, Tgfβr3). Optn, a POAG gene with well-known ocular expression pattern served as control.
Methods
We made a list of candidate glaucoma genes reported in genetic studies. A table of their ocular expression at the tissue level was compiled using publicly available microarray data (the ocular tissue database). To add cellular detail we performed RNA-ISH for Optn, Tnf, Tgfβr3, F5, and Dusp1 on eyes of healthy, 2-month-old, pigmented, and albino mice.
Results
Expression of the Optn control matched with published immunohistochemistry data. Ocular expression of Tnf was generally low, with patches of higher Tnf expression, superficially in the corneal epithelium. F5 had a restricted expression pattern with high expression in the nonpigmented ciliary body epithelium and moderate expression in the peripapillary region. Tgfβr3 and Dusp1 showed ubiquitous expression.
Conclusions
RNA-ISH is a suitable technique to determine the ocular expression pattern of POAG genes, adding meaningful cellular detail to existing microarray expression data. For instance, the high expression of F5 in the nonpigmented ciliary body epithelium suggests a role of this gene in aqueous humor dynamics and intraocular pressure. In addition, the ubiquitous expression of Tgfβr3 has implications for designing TGF-β-related glaucoma therapies, with respect to side effects. Creating pan-ocular expression maps of POAG genes with RNA-ISH will help to identify POAG pathways in specific cell types and to select targets for drug development.
Introduction
Glaucoma is the leading cause of irreversible blindness.Citation1,Citation2 The term glaucoma denotes a group of optic neuropathies, characterized by progressive degeneration of retinal ganglion cells (RGC).Citation3,Citation4 Primary open-angle glaucoma (POAG) is the most common form of glaucoma.Citation5 Elevated intraocular pressure (IOP) is an important risk factor for POAG.Citation6–Citation8 Current treatment modalities of glaucoma are aimed at lowering the IOP, which can slow down disease progression. Yet, visual field loss often does not stop, which underscores the importance of developing new therapies.
Identification of the genetic causes of POAG can help to elucidate the pathophysiology and to find new therapeutic targets. Linkage studies have found several loci in which gene mutations are responsible for hereditary glaucoma.Citation3,Citation9–Citation12 In addition, single nucleotide polymorphisms (SNPs) in over 100 genes have been reported to be associated with glaucoma or relevant quantitative traits like IOP, optic disc area (ODA), vertical cup disc ratio (VCDR), and central cornea thickness (CCT).Citation13–Citation16 Despite this wealth of genetic information, it remains difficult to identify the molecular pathways of POAG pathophysiology.Citation14,Citation16–Citation20 Partly, this may be due to the fact that many different tissues are involved in glaucoma, such as retina, optic nerve, trabecular meshwork (TM), ciliary body (CB), and cornea. POAG may well be a heterogeneous disease with multiple pathways acting in the various tissues involved. For identification of these tissue or cell type-specific pathways, it would be of great value to know which set of candidate glaucoma genes is active in each particular cell type, for example the retinal ganglion cells (RGC). Detailed knowledge of the gene expression pattern is also essential for designing new therapies. Since genes are often widely expressed, targeting a gene for glaucoma therapy may well have side effects in other cells.
High throughput methods have generated ocular expression data for most genes, but spatial resolution is limited to the tissue level, as for example in RNA microarray studies that use whole retina as input.Citation21 For a limited set of genes more detailed information has been generated by immunohistochemistry (IHC). However, this technique is not applicable for all genes since antibodies with high specificity and affinity are not available for all proteins. In addition, secreted proteins are often difficult to localize with this technique. RNA in situ hybridization (RNA-ISH) is another method to localize gene expression at the cellular level. This method has the advantage that the same probe design and staining protocol can be employed with similar efficiency for practically all genes. The method used to be difficult and cumbersome due to instability of mRNA molecules but recent advances have made the method more robust and easy to apply.Citation22
The main objective of this study was to investigate whether RNA-ISH can be used as a convenient, general purpose method to obtain pan-ocular expression data of candidate POAG genes. To study this, we first updated the list of candidate glaucoma genes and created an ocular expression map using the data of the ocular tissue database (OTDB), a mRNA microarray study that specifies expression at the tissue level.Citation23 In order to test RNA-ISH method, we selected five diverse genes from this list: Optineurin (Optn), tumor necrosis factor alpha (Tnf), transforming growth factor beta receptor 3 (Tgfβr3), blood coagulation factor V (F5), and dual specificity protein phosphatase 1 (Dusp1). Optn, a commonly referred to POAG gene, was selected as a control to validate the technique because its expression in the mouse eye has been well established using immunohistochemistry,Citation24,Citation25 Tnf and Tgfβr3 were selected because these genes are involved in pathways that are currently being targeted in new experimental POAG therapies and knowledge of the ocular expression of these genes is vital to predict potential side effects.Citation17,Citation18,Citation26 In addition, the expression of TNF-α being a secreted protein has been difficult to pinpoint using immunohistochemistry. F5 and Dusp1 were selected since little is known about their expression in the eye. F5 protein has been detected in aqueous humor (AH) but origin and ocular function is unclear.Citation27–Citation30 While Dusp1 has been demonstrated in the retina, it also is a target of miRNA hsa-mir-3185 that has been found upregulated in AH of glaucoma patients.Citation31,Citation32 A possible role of DUSP1 in the anterior segment during POAG is yet unknown.
Here, we showed that RNA-ISH is a suitable and convenient technique to provide detailed pan-ocular expression maps for these diverse genes.
Methods
Gene list
From October 2015 till February 2019, a literature search was conducted on PubMed and Embase using the MeSH terms “glaucoma, open-angle” combined with either “risk” AND “genes” or with “genetics” or with “polymorphism, single nucleotide.” A similar search was additionally performed for the glaucoma-associated endophenotypes “intraocular pressure” or “cornea” or “optic disc” combined with “risk” AND “genes” or “genetics” or “polymorphism, single nucleotide.” The scope of the paper was on the genetic background of POAG, as such only studies investigating genetic polymorphisms and mutations were eligible. Expression studies or animal studies were excluded. If a gene was reported, further PubMED and Embase searches were conducted to find replication studies for this particular candidate gene. Additional literature was handpicked by tracking the references of these papers (“snowballing”). We slightly modified Janssen et al.’s criteria,Citation14 and subdivided glaucoma candidate genes into three groups.
Familial glaucoma associated loci/gene: Loci or genes segregating in glaucoma families and identified in linkage studies.
Highly likely candidate POAG genes: Genes reported to have an association with glaucoma based on a meta-analysis of at least three independent case control studies. Genes reported in at least one GWAS with validation in an independent replication cohort.
Less likely candidate POAG risk genes: Reported only once or twice in case-control studies.
Ocular tissue database (OTDB)
We downloaded the rough gene expression data from the OTDB (https://genome.uiowa.edu/otdb/).Citation23 This database contains microarray expression data of microscopically dissected post-mortem human eye tissues. The array was analyzed using the Affymetrix Probe Logarithmic Intensity Error Estimation (PLIER) package to obtain PLIER values for each gene. We downloaded these files and calculated per tissue the PLIER value corresponding to the 90th percentile, 50th percentile, and 10th percentile. Based on their expression percentile range each gene was given a color as indicated in supplemental Table 1.
RNA in situ hybridization
Animals were obtained and treated in strict accordance with the recommendation in the Guide for the Care and Use of Laboratory Animals under Dutch law. Experiments were approved by the Dutch animal experiments committee. At 8 weeks of age, six pigmented C57BL/6 mice (Charles River) and four C57BL/6 albino mice (C57BL/6BrdCrHsd-Tyrc; Envigo) were anesthetized using CO2 and humanely killed by cervical dislocation. Eyes were taken out and fixed in 10% neutral buffered formalin (Fisher Scientific, Landsmeer, the Netherlands) for at least 24 h at 4°C prior to paraffin embedding. RNA-ISH was carried out using RNAscope® Technology (Advanced Cell Diagnostics, Milan, Italy) with the RNAscope® 2.5 HD Assay -RED (#322350) according the manufacturer’s instructions with probes targeting mouse Tnf (#311081), Tgfβr3 (#406221), Dusp1 (#424501), and F5 (custom designed for base pair region 319–1257). A probe targeting Optn (#484811) was selected as control. As per manufacturer’s recommendation, each experiment was additionally performed together with a positive (Polr2a; #312471) and negative control probe (DapB; #310043). Briefly, 5 μm formalin fixed paraffin embedded microtome sections (RM2255, Leica Microsystems, Eindhoven, the Netherlands) were placed on glass slides (SuperFrost Plus) and baked (1 h, 60°C). Sections were de-waxed in xylene, dehydrated in ethanol, boiled in target retrieval buffer (10 min) and protease treated (15–30 min, 40°C). Next, sections were hybridized with target probes (2 h, 40°C), followed by signal amplification steps and alkaline phosphatase labeling. Sections were treated with chromogenic Fast-Red substrate (10 min), counterstained with 50% Gill’s Hematoxylin-1 (Sigma-Aldrich, Zwijndrecht, the Netherlands), and mounted using Ecomount (Klinipath, Breda, the Netherlands). Expression levels were semiquantitatively scored based on the criteria described in supplemental Table 1. For scoring we skimmed through the whole section. Detailed information on the amount of sections scored per gene and per animal is provided in supplemental Table 1. The expression scores of the pigmented and albino animals were compared using a standard two-sided t-test. To generate the final heat map, scores of pigmented and albino groups were combined and the total average was rounded to the nearest score. Per tissue a representative section was imaged under a bright-field microscope (BX51, Olympus, Zoeterwoude, the Netherlands) fitted with a digital camera (SC-30 Olympus).
Results
Update of glaucoma gene list
Our literature search yielded SNPs or mutations in 263 genes associated with POAG or its endophenotypes. Based on our criteria, adapted from Janssen et al. (see methods),Citation14 we classified them: 11 Genes were classified as familial glaucoma associated genes based on 20 loci reported in linkage studies (supplemental Table 2); 147 genes were reported in multiple studies and therefore classified as highly likely candidate glaucoma genes (supplemental Table 3). The remaining 106 genes were classified as less likely candidate glaucoma genes (supplemental Table 4).
Ocular expression map
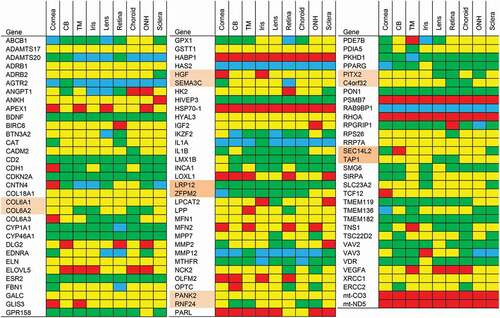
We then created a map of the expression of these genes in the eye using the data of the ocular tissue database (OTDB), a mRNA microarray study that specifies expression at the tissue level.Citation23 The ocular expression data of the familial glaucoma associated genes are shown in . For the highly and less likely candidate glaucoma risk genes, expression data are presented in –, respectively. Some SNPs are situated in between genes and it is difficult to establish which gene is affected by the SNP. For these SNPs, we took the gene expression of both genes in the vicinity of the SNP (these genes are highlighted in pink in the figures. Of eight highly likely (ADAMTS18, ARID5B, AVGR8, DIRC3, ENO4, NUDT7, PRR31, and U6) and seven less likely (DCLK3, GPDS1, THSD7A, RFPL4Bm mt-CYB, mt-CO1, and mt-ND2) candidate glaucoma genes we did not find expression levels in the OTDB. Seven SNPs were located in or near microRNA encoding transcripts (MIR548F3, MIR606, MIR3196, and MIR4707) or noncoding RNA transcripts (BASP1P1, LINC01734, and LINC00583) which were not measured on the microarray used in the OTDB study.
Figure 1. Heat map representation of familial glaucoma associated genes based on expression data from the ocular tissue database. We ranked genes by expression level and assigned percentiles (P). Red: >90th P, yellow: 50th –90th P, green: 10th–50th P, blue: <10th P. Abbreviations: CB: Ciliary body; TM: Trabecular meshwork; ONH: Optic nerve head.
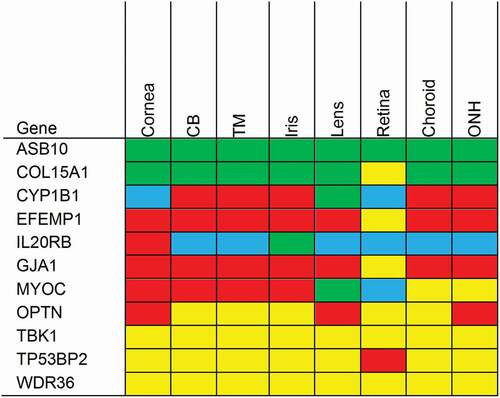
Figure 2. Heat map representation of highly likely POAG genes based on expression data from the ocular tissue database. We ranked genes by expression level and assigned percentiles (P). Red: >90th P, yellow: 50th–90th P, green: 10th–50th P, blue: <10th P. For SNPs situated in between genes, we listed the gene expression of both neighboring genes (these genes are highlighted in pairs in pink). Abbreviations: CB: Ciliary body; TM: Trabecular meshwork; ONH: Optic nerve head.
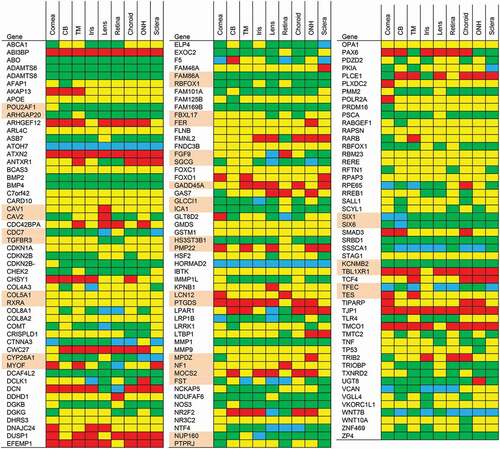
Figure 3. Heat map representation of less likely POAG genes based on expression data from the ocular tissue database. We ranked genes by expression level and assigned percentiles (P). Red: >90th P, yellow: 50th–90th P, green: 10th–50th P, blue: <10th P. For SNPs situated in between genes, we listed the gene expression of both neighboring genes (these genes are highlighted in pairs in pink). Abbreviations: CB: Ciliary body; TM: Trabecular meshwork; ONH: Optic nerve head.
RNA in situ hybridization
RNA-ISH produced distinct and detailed ocular expression maps of the five genes investigated. Using albino mice we could confirm our findings and add expression data of tissues normally pigmented. The expression of the nonpigmented tissues was not significantly different between the two animal groups (for every tissue p > 0.05 (supplemental Table 1). There was no noticeable difference between the different experiments as assessed by the positive and negative control probes Polr2a and DapB. Polr2a is ubiquitously expressed with a high expression whereas no signal was observed when staining for the bacterial gene DapB (supplemental Figure 1).
Optn
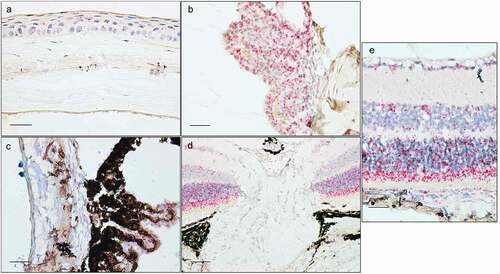
Optn was more strongly expressed in the posterior segment of the eye. Each of the retinal layers had a high expression (). In the area of the optic nerve head (ONH) cells Optn expression was low (). Both the pigmented and the nonpigmented CB epithelia (CBE) had a high expression (). Cornea epithelium had a low to moderate expression (). TM () expressed Optn to a lower extent.
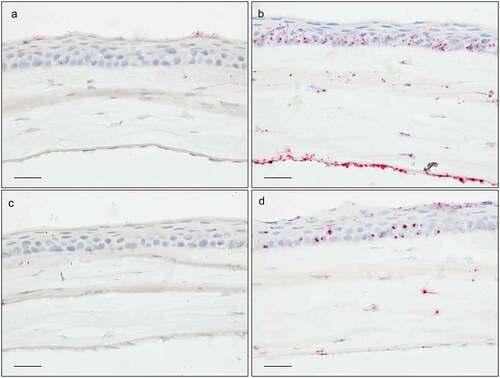
Figure 4. In situ hybridization staining (red dots) of Optn in cornea (a), ciliary body (b), trabecular meshwork with iridocorneal angle (c), optic nerve head (d), and retina (e). Sections are of pigmented (a, c, e) or albino mice (b, d). Scale bar: 50 µm for optic nerve, 25 µm for all other sections.
Tnf
Tnf had a very low expression in the healthy mouse eye. The most intense staining was found in the corneal epithelium. Here, a variable staining was found in the most superficial layer. Some patches of relatively high expression were noticed, while other areas lacked staining (). Apart from this, a very low expression was present in the inner nuclear layer (INL) and outer nuclear layer (ONL) of the retina (). All other tissues showed no expression.
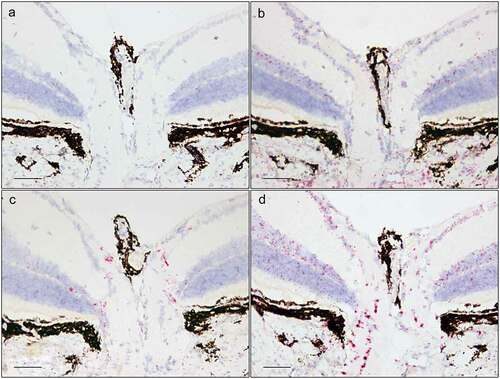
Figure 5. In situ hybridization staining (red dots) of Tnf (a), Tgfβr3 (b), F5 (c), and Dusp1 (d) transcripts in the central cornea. Scale bar: 25 µm.
Tgfβr3
In general, Tgfβr3 was ubiquitously expressed with more abundant expression in the anterior segment than the posterior segment. High Tgfβr3 expression was found in the cornea, in epithelium, stroma as well as endothelium (). In the epithelium, expression was localized mainly in the basal layer. Both the pigmented and the nonpigmented (CBE) had a very high expression (). Tgfβr3 also had a high expression in the TM (). In the retina, expression differed between the various cell types (). Highest expression was seen in the INL and the retinal pigment epithelium (RPE). A moderate expression was observed in the ganglion cell layer (GCL) and in the glial lamina of the ONH (). The ONL had almost no expression and no Tgfβr3 was found in the inner segments of the photoreceptors ().
Figure 6. In situ hybridization staining (red dots) of Tnf (a), Tgfβr3 (b), F5 (c), and Dusp1 (d) transcripts in the ciliary body of albino mice. Scale bar: 25 µm.
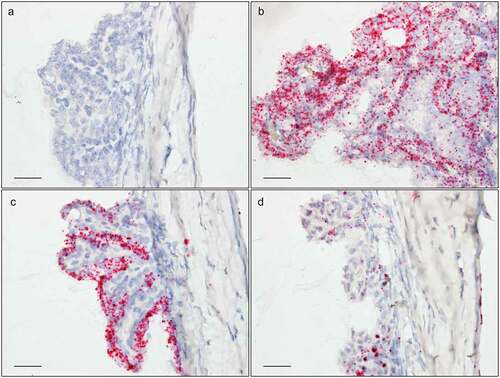
Figure 7. In situ hybridization staining (red dots) of Tnf (a), Tgfβr3 (b), F5 (c), and Dusp1 (d) transcripts in the trabecular meshwork and at the iridocorneal angle. Scale bar: 25 µm.
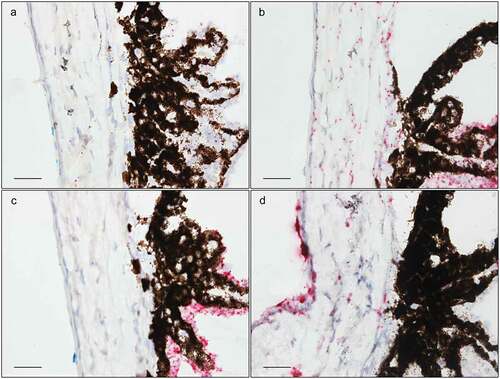
Figure 8. In situ hybridization staining (red dots) of Tnf (a), Tgfβr3 (b), F5 (c), and Dusp1 (d) transcripts in the retina of albino mice. Scale bar: 25 µm.
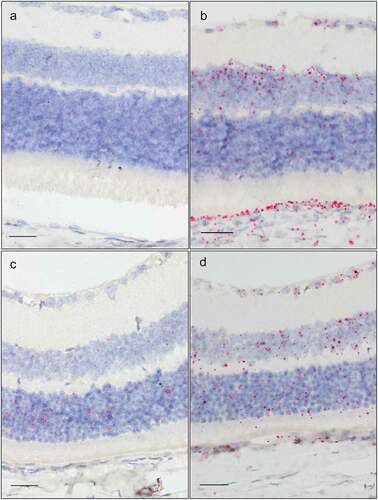
Figure 9. In situ hybridization staining (red dots) of Tnf (a), Tgfβr3 (b), F5 (c), and Dusp1 (d) transcripts in the optic nerve head region of the retina. Scale bar: 50 µm.
F5
F5 had a remarkable expression pattern, largely restricted to two regions: First, a high expression was found in the nonpigmented CBE, while the pigmented CBE had no F5 expression (). Second, a moderate expression was observed in the peripapillary region, surrounding the ONH (). In addition, a very low expression was seen in the corneal epithelium () and in the INL and ONL of the retina (). F5 expression was absent in the TM ().
Dusp1
Dusp1 had a ubiquitous expression in the eye. The intensity was lower than that observed for Tgfβr3. In the anterior section of the eye a strong, but patchy, irregular signal was observed in the corneal epithelium (). A moderate expression was observed in stroma and endothelium. Additionally, Dusp1 was moderately expressed in the CB and the TM (–). In the posterior segment, Dusp1 was highly expressed in several tissues including the GCL, INL, and ONH (). The optic nerve shows high expression in the glial cells of the glial lamina (). A moderate expression was seen in the ONL and the photoreceptor inner segments ().
Comparison of RNA-ISH data with OTDB
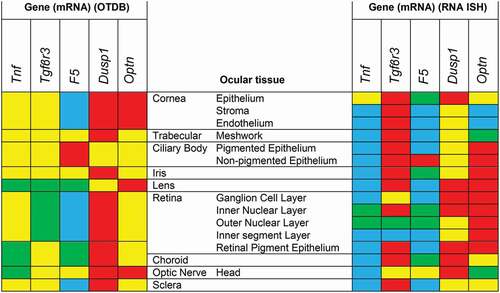
In , we summarized and compared our semiquantitative RNA-ISH expression data with the heat map created on the basis of the expression data of the OTDB. As can be expected, RNA-ISH showed that gene expression often differed between the different cell types in a tissue. For instance, patches of Tnf activity were concentrated in the corneal epithelium and not found in corneal stroma and endothelium. Expression of Tgfβr3 greatly varied between the different retinal layers and no activity was observed in the inner segments of the photoreceptors. High F5 activity was localized in the nonpigmented CBE, whereas no F5 expression was seen in the pigmented CBE. Clearly, RNA-ISH provided more detailed localization data as compared to the microarray data of the OTDB, which give an average expression level for the whole tissue.
Figure 10. mRNA expression heat maps based on the ocular tissue database (OTDB) microarray data on the left and RNA in situ hybridization (RNA-ISH) expression on the right. Microarray gene expression was classified in percentiles and RNA-ISH data in semiquantitative categories. Blue is <10th percentile; respectively no expression, green is between 10th and 50th percentile; low expression, yellow is between 50th and 90th percentile; moderate expression, red is >90th percentile; high expression.
Discussion
In the present study, we evaluated whether RNA-ISH is a suitable, general purpose method to generate pan-ocular expression maps of POAG genes. These maps can help to better unravel POAG pathophysiology and to select optimal targets for therapy. We tested this using Optn, as a control gene, being a POAG gene with known ocular expression pattern in the mouse eye and four candidate POAG genes (Tnf, Tgfβr3, F5, and Dusp1). RNA-ISH provided distinct, detailed expression maps for all these genes unveiling new cellular localizations.
In order to obtain an overview of the localization of glaucoma gene expression, we first updated the list of candidate glaucoma genes. The updated list contains 263 genes of which 147 have been implicated in multiple studies or separate cohorts. Based on the gene expression data of the OTDB,Citation23 we then created an ocular expression heat map of these genes. To our knowledge, this is the first time that an ocular expression map is provided for a large number of POAG genes. While this expression map certainly contains a lot of information, it also has limitations: It reflects the situation in healthy, adult tissue, which may well differ from the expression pattern in development or disease. Another limitation is that the expression is provided at the tissue level and not at the cellular level. Retinal expression for example does not necessarily mean that a particular gene is expressed in RGCs, the cells that are most affected in glaucoma. In the present study, we addressed this last limitation by testing whether RNA-ISH is a convenient method to add the lacking cellular expression details.
In comparison to IHC, RNA-ISH has several advantages and disadvantages. Clearly, the site of mRNA expression does not correspond to the site of the protein, nor does RNA-ISH labeling intensity necessarily reflect the amount of the encoded protein.Citation33 With IHC it may be difficult to identify the site of production of proteins that are secreted, and it is not possible to study expression of nonprotein-coding genes. As some of the POAG-associated SNPs are located in microRNA and noncoding RNA, IHC would not be able to obtain pan-ocular expression of them. Another downside of IHC is the generation of specific antibodies can be tedious design,Citation34 while production of specific probes for RNA-ISH is straightforward and highly comparable for all genes. In addition, while RNA-ISH in the past was difficult due to rapid mRNA decay, procedures have improved.Citation34–Citation36 Judging from the staining of the technical controls (positive and negative) and the biological control (Optn, see below), RNA-ISH provided reliable expression patterns. Of course, in our study we used optimally prepared animal tissue. RNA-ISH on human post-mortem tissue will be more challenging.
Localization of Optn expression
The ocular expression of Optn, a well-known causative POAG gene, has been thoroughly investigated, which makes this gene a suitable control to compare and validate our technique. Immunohistochemistry has shown that in healthy mice Optn is expressed in the cornea (cornea epithelium and stroma), CB, iris, TM, and several layers of the retina.Citation24,Citation25 With RNA-ISH we clearly demonstrated expression in all these cell types and could successfully validate the technique. The most intense labeling of Optn was in the retina, including RGCs, which fits well with the role of Optn in normal tension glaucoma.Citation37
Localization of TNF expression
TNF signaling has been implicated in glaucoma pathophysiology and studies report an increase of TNF-α in glaucomatous aqueous humor (AH).Citation38,Citation39 As TNF-α is a secreted protein, the origin of increased TNF expression is difficult to assess with antibodies. In addition, TNF-α is a target for development of new, neuroprotective glaucoma therapy.Citation40,Citation41 Precise localization of endogenous expression and secretion are relevant for the development of TNF-related therapy.
In general, we found a very low expression of Tnf in healthy mouse eyes. In contrast to our findings, the OTDB described a moderate expression in almost all eye tissues. Since aging is associated with an increase in TNF-α, the higher expression levels in the OTDB may relate to the advanced age of human donor eyes.Citation42 Specifically, we observed expression in the GCL and INL, which may correspond to known expression in Müller cells.Citation43 Most striking was our finding of a patchy expression of Tnf in superficial layers of the corneal epithelium, without expression in other corneal layers. To our knowledge, this specific pattern has not been reported before. Luo et al. measured approximately 10 pg/ml TNF-α in healthy cornea.Citation44 Our data suggest that this TNF-α is produced by superficial cells of the corneal epithelium. It is not known whether corneal TNF-α plays a role in glaucoma, but is certainly worth investigating as it may be relevant for (side-) effects of TNF-targeted therapy. Additionally, TNF-α could diffuse to the tears where it can be measured as a potential biomarker. In fact, TNF-α has been measured in tears of POAG patients and control subjects, but results were ambiguous.Citation45,Citation46
Localization of TGFβR3 expression
The TGF-β signaling pathway is often reported in relation to glaucoma, e.g. reviewed by Fuchshofer and Tamm.Citation47 Recently, it became a target for drug development for glaucoma as well as for fibrosis after eye surgery.Citation48–Citation50
We found a relatively high, ubiquitous expression of Tgfβr3, which underscores the importance of this pathway in the eye. These findings agree with those of a RT-PCR study,Citation51 as well as the microarray study of the OTDB in human eyes.Citation23 One study localized TGFβR3 in the cornea using immunohistochemistry; the authors noted in their discussion that the results were difficult to replicate due to varying staining intensities.Citation52 With RNA-ISH, we clearly observed expression in all corneal layers. The OTDB reports a low overall expression of Tgfβr3 in the retina. Our RNA-ISH data are more specific and show amongst others, a moderate expression in the GCL. We confirmed expression of Tgfβr3 in the TM. This is relevant for glaucoma since in POAG increased levels of its ligand TGF-β2 occur in the AH.Citation47,Citation53 Finally, the ubiquitous expression of Tgfβr3 in the eye, particularly in the anterior segment, suggests that new TGF-β-related glaucoma drugs targeting this receptor may have widespread (side-)effects.
Localization of F5 expression
SNPs in and near the F5 gene are associated with an increase in ODA and VCDR.Citation17,Citation18 Yet, not much is known regarding the expression in the eye. In our study, F5 showed a very distinct expression pattern with a high expression in two specific areas and hardly any staining in other tissues. High expression was found in the nonpigmented CBE. The OTDB showed a very high expression in the CB but was not able to discriminate between pigmented and nonpigmented CBE. Secondly, F5 was expressed in the peripapillary region. A study using RNA sequencing found a high expression of F5 in TM and CB and a low expression in the cornea.Citation54 Another study using microarray analysis of ex vivo corneoscleral specimens, found that F5 was significantly higher expressed in the TM than in cornea and sclera.Citation55 Clearly, these studies, as well as the OTDB, reported F5 expression in the TM, whereas we did not observe staining in this tissue. While it is possible that there is a difference between F5 expression in mouse and human tissue, an alternative explanation may be that the high levels of F5 in the CB have led to F5 mRNA contamination of the TM in these ex vivo samples.
The high expression in the CBE with virtually no expression in any other anterior segment tissue suggests that F5 in AH, is actively secreted from the CB into the AH When comparing the AH concentration of F5 between POAG patients and other ocular disease the results are inconclusive.Citation27–Citation30 Unfortunately, F5 SNPs were not determined in these studies. It would be interesting to investigate if there is a correlation between F5 polymorphisms and F5 concentration in the AH. In addition to changes in the AH, the expression of F5 in the border area of the ONH might affect ODA directly. Both these findings are interesting topics for further study.
Localization of Dusp1 expression
Polymorphisms in the Dusp1 gene are associated with an increase in the cup area and VCDR.Citation18,Citation26 Data on ocular Dusp1 expression are scarce and only one study investigated its function in the eye.Citation32 This study of the retina reported expression of Dusp1 in RGC, bipolar cells, amacrine cells, horizontal cells, and Müller cells. The study showed that Dusp1 played a role in RGC survival during ischemic conditions induced by elevated IOP, suggesting that expression of Dusp1 in the GCL may be relevant for glaucoma.
Our results showed that Dusp1 is ubiquitously expressed in the eye, which is overall in agreement with the, albeit less specific, microarray data of the OTDB. We localized Dusp1 mRNA in all retinal layers. In contrast to the above-mentioned retinal study, we also found expression in photoreceptors. A microarray expression study reported expression of Dusp1 in the corneal epithelium.Citation56 We confirmed this expression and showed that the strongest expression was observed in the superficial epithelium cells. Lastly, we showed that Dusp1 is also expressed in CB and TM. This implies that the previously reported hsa-mir-3185 can target Dusp1 in the TM.Citation31 Future studies can investigate if Dusp1 is downregulated in TM of glaucoma patients as a result of has-mir-3185 expression.
To conclude, we conveniently visualized publically available ocular expression data of glaucoma risk genes in a heat map. In this map, expression is localized at the tissue level. Using four candidate glaucoma genes (Tnf, Tgfβr3, F5, and Dusp1) and one causative POAG gene (Optn) as examples, we showed that RNA-ISH is an efficient, straightforward method to add cellular detail to these expression data. Future studies can utilize this technique in healthy and glaucoma tissues to create more detailed expression maps of glaucoma genes. This will facilitate identification of the specific molecular pathways that act in the various cell types, causing the pathology of glaucoma. In addition, it will help to identify the most promising targets for drug development, also accounting for side effects.
Supplemental Material
Download Zip (2.5 MB)Disclosure Statement
The authors report no conflicts of interest. The authors alone are responsible for the content and writing of the paper.
Supplementary Materials
Supplemental materials data can be accessed here.
Additional information
Funding
Related Research Data
References
- Quigley HA, Broman AT. The number of people with glaucoma worldwide in 2010 and 2020. Br J Ophthalmol. 2006;90(3):262–67. doi:10.1136/bjo.2005.081224.
- Tham YC, Li X, Wong TY, Quigley HA, Aung T, Cheng CY. Global prevalence of glaucoma and projections of glaucoma burden through 2040: a systematic review and meta-analysis. Ophthalmology. 2014;121(11):2081–90. doi:10.1016/j.ophtha.2014.05.013.
- Medeiros FA, Weinreb RN. Medical backgrounders: glaucoma. Drugs Today (Barc). 2002;38:563–70.
- Weinreb RN, Aung T, Medeiros FA. The pathophysiology and treatment of glaucoma: a review. JAMA. 2014;311(18):1901–11. doi:10.1001/jama.2014.3192.
- Gupta N, Weinreb RN. New definitions of glaucoma. Curr Opin Ophthalmol. 1997;8:38–41.
- AGIS. The Advanced Glaucoma Intervention Study (AGIS): 7. The relationship between control of intraocular pressure and visual field deterioration. The AGIS investigators. Am J Ophthalmol. 2000;130(4):429–40.
- Gordon MO, Beiser JA, Brandt JD, Heuer DK, Higginbotham EJ, Johnson CA, Keltner JL, Miller JP, Parrish RK 2nd, Wilson MR, et al. The ocular hypertension treatment study: baseline factors that predict the onset of primary open-angle glaucoma. Arch Ophthalmol. 2002;120(6):714–20. discussion 829-30.
- Leske MC, Connell AM, Wu SY, Nemesure B, Li X, Schachat A, Hennis A. Incidence of open-angle glaucoma: the barbados eye studies. The barbados eye studies group. Arch Ophthalmol. 2001;119:89–95.
- Gong G, Kosoko-Lasaki S, Haynatzki G, Lynch HT, Lynch JA, Wilson MR. Inherited, familial and sporadic primary open-angle glaucoma. J Natl Med Assoc. 2007;99:559–63.
- Stone EM, Fingert JH, Alward WL, Nguyen TD, Polansky JR, Sunden SL, Nishimura D, Clark AF, Nystuen A, Nichols BE, et al. Identification of a gene that causes primary open angle glaucoma. Science. 1997;275(5300):668–70.
- Rezaie T, Child A, Hitchings R, Brice G, Miller L, Coca-Prados M, Heon E, Krupin T, Ritch R, Kreutzer D, et al. Adult-onset primary open-angle glaucoma caused by mutations in optineurin. Science. 2002;295(5557):1077–79. doi:10.1126/science.1066901.
- Monemi S, Spaeth G, DaSilva A, Popinchalk S, Ilitchev E, Liebmann J, Ritch R, Heon E, Crick RP, Child A, et al. Identification of a novel adult-onset primary open-angle glaucoma (POAG) gene on 5q22.1. Hum Mol Genet. 2005;14(6):725–33. doi:10.1093/hmg/ddi068.
- Medeiros FA, Sample PA, Zangwill LM, Bowd C, Aihara M, Weinreb RN. Corneal thickness as a risk factor for visual field loss in patients with preperimetric glaucomatous optic neuropathy. Am J Ophthalmol. 2003;136:805–13.
- Janssen SF, Gorgels TG, Ramdas WD, Klaver CC, van Duijn CM, Jansonius NM, Bergen AA. The vast complexity of primary open angle glaucoma: disease genes, risks, molecular mechanisms and pathobiology. Prog Retin Eye Res. 2013;37:31–67. doi:10.1016/j.preteyeres.2013.09.001.
- Kumar S, Malik MA, Goswami S, Sihota R, Kaur J. Candidate genes involved in the susceptibility of primary open angle glaucoma. Gene. 2016;577(2):119–31. doi:10.1016/j.gene.2015.11.032.
- Iglesias AI, Springelkamp H, Ramdas WD, Klaver CC, Willemsen R, van Duijn CM. Genes, pathways, and animal models in primary open-angle glaucoma. Eye (Lond). 2015;29(10):1285–98. doi:10.1038/eye.2015.160.
- Springelkamp H, Mishra A, Hysi PG, Gharahkhani P, Hohn R, Khor CC, Cooke Bailey JN, Luo X, Ramdas WD, Vithana E, et al. Meta-analysis of genome-wide association studies identifies novel loci associated with optic disc morphology. Genet Epidemiol. 2015;39(3):207–16. doi:10.1002/gepi.21886.
- Springelkamp H, Iglesias AI, Mishra A, Hohn R, Wojciechowski R, Khawaja AP, Nag A, Wang YX, Wang JJ, Cuellar-Partida G, et al. New insights into the genetics of primary open-angle glaucoma based on meta-analyses of intraocular pressure and optic disc characteristics. Hum Mol Genet. 2017. doi:10.1093/hmg/ddw399.
- Zhou T, Souzeau E, Sharma S, Landers J, Mills R, Goldberg I, Healey PR, Graham S, Hewitt AW, Mackey DA, et al. Whole exome sequencing implicates eye development, the unfolded protein response and plasma membrane homeostasis in primary open-angle glaucoma. PLoS One. 2017;12(3):e0172427. doi:10.1371/journal.pone.0172427.
- Danford ID, Verkuil LD, Choi DJ, Collins DW, Gudiseva HV, Uyhazi KE, Lau MK, Kanu LN, Grant GR, Chavali VRM, et al. Characterizing the “POAGome”: a bioinformatics-driven approach to primary open-angle glaucoma. Prog Retin Eye Res. 2017;58:89–114. doi:10.1016/j.preteyeres.2017.02.001.
- Li M, Jia C, Kazmierkiewicz KL, Bowman AS, Tian L, Liu Y, Gupta NA, Gudiseva HV, Yee SS, Kim M, et al. Comprehensive analysis of gene expression in human retina and supporting tissues. Hum Mol Genet. 2014;23(15):4001–14. doi:10.1093/hmg/ddu114.
- Cassidy A, Jones J. Developments in in situ hybridisation. Methods. 2014;70(1):39–45. doi:10.1016/j.ymeth.2014.04.006.
- Wagner AH, Anand VN, Wang WH, Chatterton JE, Sun D, Shepard AR, Jacobson N, Pang IH, Deluca AP, Casavant TL, et al. Exon-level expression profiling of ocular tissues. Exp Eye Res. 2013;111:105–11. doi:10.1016/j.exer.2013.03.004.
- Kroeber M, Ohlmann A, Russell P, Tamm ER. Transgenic studies on the role of optineurin in the mouse eye. Exp Eye Res. 2006;82(6):1075–85. doi:10.1016/j.exer.2005.11.004.
- Rezaie T, Sarfarazi M. Molecular cloning, genomic structure, and protein characterization of mouse optineurin. Genomics. 2005;85(1):131–38. doi:10.1016/j.ygeno.2004.10.011.
- Springelkamp H, Hohn R, Mishra A, Hysi PG, Khor CC, Loomis SJ, Bailey JN, Gibson J, Thorleifsson G, Janssen SF, et al. Meta-analysis of genome-wide association studies identifies novel loci that influence cupping and the glaucomatous process. Nat Commun. 2014;5:4883. doi:10.1038/ncomms5972.
- Kaeslin MA, Killer HE, Fuhrer CA, Zeleny N, Huber AR, Neutzner A. Changes to the aqueous humor proteome during glaucoma. PLoS One. 2016;11(10):e0165314. doi:10.1371/journal.pone.0165314.
- Chowdhury UR, Madden BJ, Charlesworth MC, Fautsch MP. Proteome analysis of human aqueous humor. Invest Ophthalmol Vis Sci. 2010;51(10):4921–31. doi:10.1167/iovs.10-5531.
- Murthy KR, Rajagopalan P, Pinto SM, Advani J, Murthy PR, Goel R, Subbannayya Y, Balakrishnan L, Dash M, Anil AK, et al. Proteomics of human aqueous humor. OMICS. 2015;19(5):283–93. doi:10.1089/omi.2015.0029.
- Ji Y, Rong X, Ye H, Zhang K, Lu Y. Proteomic analysis of aqueous humor proteins associated with cataract development. Clin Biochem. 2015;48(18):1304–09. doi:10.1016/j.clinbiochem.2015.08.006.
- Tanaka Y, Tsuda S, Kunikata H, Sato J, Kokubun T, Yasuda M, Nishiguchi KM, Inada T, Nakazawa T. Profiles of extracellular miRNAs in the aqueous humor of glaucoma patients assessed with a microarray system. Sci Rep. 2014;4:5089. doi:10.1038/srep05089.
- Dreixler JC, Bratton A, Du E, Shaikh AR, Savoie B, Alexander M, Marcet MM, Roth S. Mitogen-activated protein kinase phosphatase-1 (MKP-1) in retinal ischemic preconditioning. Exp Eye Res. 2011;93(4):340–49. doi:10.1016/j.exer.2010.10.011.
- de Sousa Abreu R, Penalva LO, Marcotte EM, Vogel C. Global signatures of protein and mRNA expression levels. Mol Biosyst. 2009;5(12):1512–26. doi:10.1039/b908315d.
- Urbanek MO, Nawrocka AU, Krzyzosiak WJ. Small RNA detection by in situ hybridization methods. Int J Mol Sci. 2015;16(6):13259–86. doi:10.3390/ijms160613259.
- Levsky JM, Singer RH. Fluorescence in situ hybridization: past, present and future. J Cell Sci. 2003;116(Pt 14):2833–38. doi:10.1242/jcs.00633.
- Qian X, Lloyd RV. Recent developments in signal amplification methods for in situ hybridization. Diagn Mol Pathol. 2003;12:1–13.
- Minegishi Y, Nakayama M, Iejima D, Kawase K, Iwata T. Significance of optineurin mutations in glaucoma and other diseases. Prog Retin Eye Res. 2016;55:149–81. doi:10.1016/j.preteyeres.2016.08.002.
- Tezel G. TNF-alpha signaling in glaucomatous neurodegeneration. Prog Brain Res. 2008;173:409–21. doi:10.1016/S0079-6123(08)01128-X.
- Xin X, Gao L, Wu T, Sun F. Roles of tumor necrosis factor alpha gene polymorphisms, tumor necrosis factor alpha level in aqueous humor, and the risks of open angle glaucoma: a meta-analysis. Mol Vis. 2013;19:526–35.
- Agarwal R, Agarwal P. Glaucomatous neurodegeneration: an eye on tumor necrosis factor-alpha. Indian J Ophthalmol. 2012;60(4):255–61. doi:10.4103/0301-4738.98700.
- Roh M, Zhang Y, Murakami Y, Thanos A, Lee SC, Vavvas DG, Benowitz LI, Miller JW. Etanercept, a widely used inhibitor of tumor necrosis factor-alpha (TNF-alpha), prevents retinal ganglion cell loss in a rat model of glaucoma. PLoS One. 2012;7(7):e40065. doi:10.1371/journal.pone.0040065.
- Bruunsgaard H, Pedersen AN, Schroll M, Skinhoj P, Pedersen BK. TNF-alpha, leptin, and lymphocyte function in human aging. Life Sci. 2000;67:2721–31.
- Tezel G, Li LY, Patil RV, Wax MB. TNF-alpha and TNF-alpha receptor-1 in the retina of normal and glaucomatous eyes. Invest Ophthalmol Vis Sci. 2001;42:1787–94.
- Luo L, Li DQ, Doshi A, Farley W, Corrales RM, Pflugfelder SC. Experimental dry eye stimulates production of inflammatory cytokines and MMP-9 and activates MAPK signaling pathways on the ocular surface. Invest Ophthalmol Vis Sci. 2004;45(12):4293–301. doi:10.1167/iovs.03-1145.
- Malvitte L, Montange T, Vejux A, Baudouin C, Bron AM, Creuzot-Garcher C, Lizard G. Measurement of inflammatory cytokines by multicytokine assay in tears of patients with glaucoma topically treated with chronic drugs. Br J Ophthalmol. 2007;91(1):29–32. doi:10.1136/bjo.2006.101485.
- Gupta D, Wen JC, Huebner JL, Stinnett S, Kraus VB, Tseng HC, Walsh M. Cytokine biomarkers in tear film for primary open-angle glaucoma. Clin Ophthalmol. 2017;11:411–16. doi:10.2147/OPTH.S125364.
- Fuchshofer R, Tamm ER. The role of TGF-beta in the pathogenesis of primary open-angle glaucoma. Cell Tissue Res. 2012;347(1):279–90. doi:10.1007/s00441-011-1274-7.
- Pfeiffer N, Voykov B, Renieri G, Bell K, Richter P, Weigel M, Thieme H, Wilhelm B, Lorenz K, Feindor M, et al. First-in-human phase I study of ISTH0036, an antisense oligonucleotide selectively targeting transforming growth factor beta 2 (TGF-beta2), in subjects with open-angle glaucoma undergoing glaucoma filtration surgery. PLoS One. 2017;12(11):e0188899. doi:10.1371/journal.pone.0188899.
- Stahnke T, Kowtharapu BS, Stachs O, Schmitz KP, Wurm J, Wree A, Guthoff RF, Hovakimyan M. Suppression of TGF-beta pathway by pirfenidone decreases extracellular matrix deposition in ocular fibroblasts in vitro. PLoS One. 2017;12(2):e0172592. doi:10.1371/journal.pone.0172592.
- Maeda M, Kojima S, Sugiyama T, Jin D, Takai S, Oku H, Kohmoto R, Ueki M, Ikeda T. Effects of gelatin hydrogel containing anti-transforming growth factor-beta antibody in a canine filtration surgery model. Int J Mol Sci. 2017;18:5. doi:10.3390/ijms18050985.
- Li Z, Allingham RR, Nakano M, Jia L, Chen Y, Ikeda Y, Mani B, Chen LJ, Kee C, Garway-Heath DF, et al. A common variant near TGFBR3 is associated with primary open angle glaucoma. Hum Mol Genet. 2015;24(13):3880–92. doi:10.1093/hmg/ddv128.
- Joyce NC, Zieske JD. Transforming growth factor-beta receptor expression in human cornea. Invest Ophthalmol Vis Sci. 1997;38:1922–28.
- Tripathi RC, Li J, Chan WF, Tripathi BJ. Aqueous humor in glaucomatous eyes contains an increased level of TGF-beta 2. Exp Eye Res. 1994;59:723–27.
- Carnes MU, Allingham RR, Ashley-Koch A, Hauser MA. Transcriptome analysis of adult and fetal trabecular meshwork, cornea, and ciliary body tissues by RNA sequencing. Exp Eye Res. 2018;167:91–9.
- Sathiyanathan P, Tay CY, Stanton LW. Transcriptome analysis for the identification of cellular markers related to trabecular meshwork differentiation. BMC Genomics. 2017;18(1):383. doi:10.1186/s12864-016-3396-5.
- Wang Z, Reinach PS, Zhang F, Vellonen KS, Urtti A, Turner H, Wolosin JM. DUSP5 and DUSP6 modulate corneal epithelial cell proliferation. Mol Vis. 2010;16:1696–704.