
ABSTRACT
Purpose
To evaluate whether principal component analysis (PCA) can assess various diagnostic tests of dry eye disease (DED), providing a simplified, more informative measure of disease status than individual clinical test parameters (ICTP).
Materials and Methods
ICTP were analyzed using PCA in two groups of normal rabbits (Groups 1 and 2). Group 3, not truly normal, was also assessed. DED was induced in Group 1 by complete dacryoadenectomy; in Groups 2 and 3 by injection of concanavalin A. Tear break up time, tear osmolarity, Schirmer’s tear test and rose bengal staining were the ICTP measured in all groups. Statistical analysis including descriptive statistics, t test, correlation coefficients and PCA was done. PCA using ICTP data from Group 1 generated axes; Group 2 and 3 were plotted over these axes.
Results
All groups had induction of DED. Correlations for all ICTP were in the correct direction and were strongest for Group 1 and weakest in Group 3. PCA clearly separated DED and normal eyes. Principal component (PC) 1, made up of nearly equal contributions from the four clinical tests, explained 73% of the variation and provided a means to separate normal from DED. PC 1 values under 0.52 can be mathematically defined as DED. Of all pairwise comparisons, PC 1 vs PC 2 and PC 1 vs PC 3 were the most informative providing excellent spatial separation and additional information regarding DED status.
Conclusions
PCA proved useful for evaluating DED providing a simpler, more comprehensive assessment than ICTP. PC 1 is a valuable, clinically relevant, and informative metric for DED status and severity having superior diagnostic value and statistical strength compared to ICTP. Spatial information on biplots of PC 1 vs PC 3 is also informative. PCA, and specifically PC 1, has the potential to serve as a biomarker for DED.
Introduction
DED is a complex pathophysiological condition commonly assessed using four clinical tests which capture several aspects of tear physiology and anatomy of the ocular surface. These measures include: tear break up time (TBUT), a measure of tear stability; Schirmer’s Tear Test (STT), a measure of total tear secretion; tear osmolarity (TOsm), a measure of tear osmotic stress; and rose bengal (RB) staining, a measure of ocular surface integrity. That each of these tests assesses a different aspect of the condition explains, to some extent, their suboptimal performance evidenced by Citation1–5 disparate and at times conflicting results when evaluated individually or in combination. This shortcoming is compounded by biases inherent in the determination of their normal ranges and by the lack of standardization which explains limitations in terms of their accuracy, reproducibility and sensitivity/specificity.(1–Citation7reviewed inCitation8) Combinations of two or more tests failed to overcome this diagnostic conundrum.Citation6 Despite such major limitations, these tests currently remain the best practices for the clinical assessment and management of this condition and are still used as endpoints in large clinical studies validating their utility as assays for this complex pathological disease.
An ideal metric for DED, if one exists, should have the following characteristics: 1) it should be determined objectively and have pathophysiological relevance; 2) it should be represented by a single variable that incorporates multiple aspects of tear physiology and anatomy allowing for easy comparisons and statistical interpretation of results; 3) it should have the ability to differentiate normal from severe DED and all the various gradations in between; 4) it should have statistical power as good or better than any of the individual clinical DED parameters currently used; and 5) it should provide a means to compare and have the power to differentiate different sets of experiments over time. The current lack of such a diagnostic “gold standard” for DED hinders both clinical treatment and research advances.
Given the clinical importance of DED and limitations of current means of assessing this condition, we evaluated whether principal component analysis (PCA) could objectively and more comprehensively assess the various clinical tests of DED. PCA is a multivariate statistical technique that analyzes several correlated variables and reduces as much of the data variability as possible expressing the results in a new set of independent variables called principal components.Citation9–11 In addition, PCA provides valuable spatial information presenting patterns of similarity between groups by displaying them as points on biplots. PCA, increasingly used in biology and drug discovery,Citation12–14 reduces multidimensional data to lower dimensions while retaining most of the information. We have successfully used PCA to differentiate infrared spectra from normal and neoplastic cells, which are notoriously difficult to compare.Citation12,Citation13 In the case of DED, our expectation was that PCA, by “incorporating” the contribution of multiple tests into fewer outcomes would be more successful in measuring the disease than individual clinical tests. Our goal was to define objective variables (principal component scores), which could differentiate normal from DED better than individual clinical tests.
We chose to compare normal and dry eyes in two different rabbit models to evaluate the ability of PCA to better diagnose DEDCitation15–17 for many reasons. In the first model, complete dacryoadenectomy (surgical removal of both orbital lacrimal glands) eliminates the bulk of tear production creating severe DED.Citation15 In the second model, injection of the mitogen concanavalin A (ConA) into these lacrimal glands promptly induces DED, although milder compared to the previous one.Citation16 Our novel methods of inducing aqueous-deficient DED in rabbits using these methods have been shown to be consistently reproducible, stable, and efficacious. An additional advantage is that the size of a rabbit eye, close to that of human, allows for all of the clinical testing to be done with nearly identical techniques and instrumentation as used in humans. In addition, due to the similarity in surface area of the ocular tissues of rabbit and human, rabbit eyes should more accurately reflect compensatory changes of the ocular surface from the aqueous-deficient DED induced by our models than the eyes of mice or rats.Citation18 Finally, rabbits are routinely used to test drug delivery and efficacy of novel ocular therapeutics (including those for DED),Citation19 and this system could benefit from a more ideal metric to assess the status of DED.
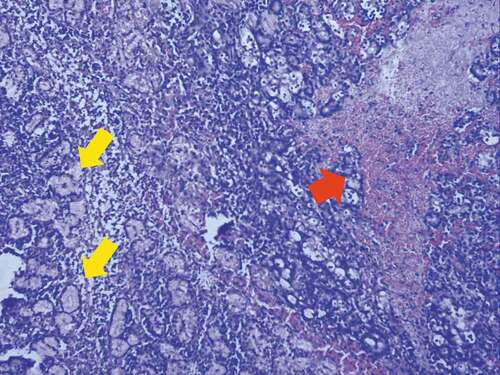
In addition to studying PCA using completely naïve (normal) eyes, we also used rabbits whose eyes were not truly naïve (abnormal) at baseline. These eyes had undergone prior DED induction and had already been used in pharmacological studies assessing the efficacy of novel agents. However, they had undergone an adequate washout and recovery period and had returned to what clinically appeared normal based on the individual diagnostic tests. However, it is unlikely they returned to normal. Previous reports using ConA to induce DED in rabbits have shown that localized areas of necrosis in the lacrimal gland can be present after mitogen injection.Citation20,Citation21 Histologic analysis of our own samples has also shown small areas of frank necrosis in some sections of lacrimal glands receiving ConA injection (). In glands with necrotic tissue, the return to normal of individual test parameters after the washout period cannot represent recovery of this tissue, but rather represents compensatory changes from other areas of the lacrimal gland or lacrimal functional unit. Our own data have shown that multiple serial injections of ConA result in a permanent DED condition after five injections supporting an irreversible effect of ConA presumably due to the destruction of the tissues.Citation22 We speculated that these eyes could act as a surrogate group representing chronic, compensated aqueous-deficient DED to determine if PCA has the ability and power to distinguish them from completely normal (naïve) eyes.
Figure 1. Histologic changes in inferior lacrimal gland following Concanavalin A
Our results, presented below, demonstrate the power and utility of PCA to discriminate between normal and aqueous-deficient DED using principal component scores generated from analysis of four interrelated, quantitative clinical variables. Correlational analyses of our data, performed in parallel, further support this approach.
Methods
Rabbits
New Zealand White (NZW) rabbits (male, 2–3 kg) were housed singly in rooms with a 12-h on/off light cycle and temperature (65 ± 5 °F) and humidity (45 ± 5%) control. Animals had unlimited access to water and standard rabbit chow without dietary enrichment. The nictitating membrane was removed from all eyes during a 2-week acclimatization period.
All animal studies were approved by the Institutional Review Board of Stony Brook University and performed in accordance with the ARVO Statement for the Use of Animals in Ophthalmic and Vision Research.
Surgical (complete dacryoadenectomy) model of DED
The method, performed on naïve rabbits, is detailed elsewhere.Citation23 Briefly, under general anesthesia, the orbital portion of the superior lacrimal gland (OSLG) is harvested through an incision over the posterior incisure exposing the gland and its excretory duct, while the palpebral portion of the superior lacrimal gland (PSLG) is removed through a transconjunctival incision. The inferior lacrimal gland (ILG) is removed last through a curvilinear incision surrounding the posterior and inferior orbit.
ConA-induced DED
This method is described in detail elsewhere.Citation16,Citation22 Briefly, naïve rabbits receive three ConA injections, one each into the ILG, the PSLG, and the OSLG. Ultrasound guidance directs the injection into the ILG and confirms the successful delivery of ConA. The PSLG is injected under direct visualization and OSLG transcranially through the posterior incisure.
We induced DED by this approach in two groups of rabbits: a) Naïve ConA rabbits, which consisted of rabbits never previously used for any study; and b) Abnormal ConA rabbits, which consisted of rabbits that had previously had DED induced by ConA. This group was used to study for 1 week the effect of a novel agent against DED administered locally as eye drops. Two weeks after the conclusion of that study (washout period), we confirmed that the clinical DED parameters described below (RB was not tested) had returned to normal. Therefore, the Abnormal ConA group of rabbits was not truly normal (hence their designation as Abnormal), given their prior DED and exposure to a drug.
Determination of DED
Of the four parameters used to determine DED in rabbits, the first three below were recently described in detail.Citation16
Tear osmolarity
After sedation and gentle retraction of the lower lid, tears are sampled with the TearLab Osmometer, and osmolarity is measured following the manufacturer’s instructions (TearLab Corp., San Diego, CA).
Tear break up time (TBUT)
Following topical anesthesia, 0.2% fluorescein is applied to the eye, and the pre-corneal tear film is observed under blue light. The time taken to develop black dots, lines or obvious disruption of the fluorescein film is measured up to 1 min. If break up is not seen by 1 min, observation is halted and TBUT is recorded as 60 s (even though actually longer).
Schirmer’s tear test (STT)
After application of 1% preservative-free lidocaine to the eye, a Weck-Cel® surgical sponge (Beaver-Visitec International, Waltham MA) is placed into the lower fornix to remove any fluid and then removed. Color Bar Schirmer strips (EagleVision, Memphis TN) are placed in the mid portion of the lower lid and tear production is recorded as the length of moistened strip at 5 min. The final score is the average of three separate measurements.
Rose bengal (RB) staining
After instillation of 50 µl of 1% preservative-free lidocaine, 25 µl of RB 1% is instilled on the ocular surface, the eyelid is manually blinked once to evenly distribute it, and a timer is started. After 4 min, a wire lid speculum is placed and photographs of the superior conjunctival and corneal surface are taken with the same camera and illumination.Citation24,Citation25 Photographs of both eyes are completed within 1 min. Images are graded using a modified NEI method.Citation26
Statistical analyses
Descriptive statistics are presented in for the DED parameters and stratified by group (surgical vs two ConA groups). P-values were calculated to evaluate significant differences in the variables of interest at baseline and week 1 post-op. The Kaiser-Meyer-Olkin test was used to assess the adequacy of our samples for each variable of interest. Spearman correlation coefficients were used to evaluate the relationships between variables in both models and t-tests were computed to determine differences between groups; paired t-tests were used when appropriate.
Table 1. Induction of DED in the three study groups
Principal component analysis
PCA was used to analyze data tables in which observations are described by several inter-correlated quantitative dependent variables, and to extract the important information from the data table and to express it as the new orthogonal variables (principal components).Citation9–11 PCA, depending upon the eigendecomposition of positive semidefinite matrices and upon the singular value decomposition of rectangular matrices, represents the pattern of similarity of the observations and the variables by displaying them as points on biplots. (e.g., ).
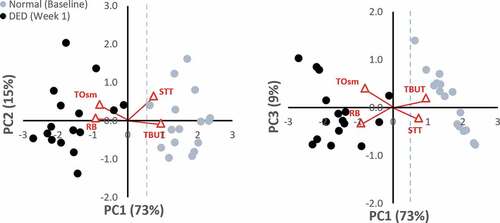
Figure 2. Principal Component Bi-Plots for surgical model of DED
PCA and graphical representations were done using either XLStat software (XLSTAT 2017: Data Analysis and Statistical Solution for Microsoft Excel. Addinsoft, Paris, France (2017)) or SPSS software (IBM Corp. Released 2017. IBM SPSS Statistics for Windows, Version 25.0. Armonk, NY: IBM Corp.). The software packages produced identical results for PC scores; graphical representations presented below were created from XLSTAT. The reduction in the dimensionality of data allowed for by PCA improved the visualization of DED states and allowed superior interpretation of DED compared to any individual test parameters.
Results
Group characteristics at baseline
As shown in , the surgical and two ConA-induced DED groups all showed similar values for the four DED parameters measured at baseline, with only two exceptions. In the Abnormal ConA-induced DED group, the RB staining score at baseline was significantly greater than in the other two groups (p ≤ 0.0001 for both comparisons). Also, at baseline, the STT was slightly lower in the Naïve ConA-induced group compared to the surgical group (14.6 vs 18.3, respectively, p = .048). Looking at the four individual clinical test parameters, one might conclude that the three groups were likely equivalent at baseline.
Induction of DED
DED was successfully induced in all three groups. As shown in , in animals that underwent complete dacryoadenectomy, TBUT was reduced from 60 to 5.2 sec; STT was reduced from 18.3 to 9.5 sec; TOsm increased from 291.3 to 315.8 mOsm/L; and the RB staining score increased from 0.0 to 5.6 (for all, p < .0001). Similarly, animals in the Naïve ConA-induced group also showed statistically significant changes in the correct direction for all DED parameters measured. However, the magnitude of the changes and their statistical significance were less pronounced than for the surgical model. In the Abnormal ConA-induced group, only TBUT and STT were significantly different compared to baseline. In this group, TOsm did not change and although the RB score increased appropriately, its change was not statistically significant. Of note, the baseline RB score of this group was significantly elevated, compared to the other two study groups.
Correlation of DED parameters and sample adequacy
An important aspect of the various parameters of DED is their potential correlation to each other. We first assessed the suitability of our data using the Kaiser-Meyer-Olkin test.Citation27 Overall, the sampling was adequate for each variable individually, as well as for the entire model. Adequacy ranged from 0.69 for TBUT to 0.92 for STT, with an overall adequacy of 0.77 for the complete model.Citation27
summarizes the Spearman correlation coefficients for all DED parameters in the three groups. In the dacryoadenectomy model, all parameters were in the direction expected for DED and showed statistically significant correlations to each other. The strongest negative correlations were between TBUT and RB score, and TBUT and TOsm, whereas the strongest positive correlation was between RB score and TOsm. Importantly, these correlations were sustained in magnitude and direction with essentially the same level of significance for more than 1 month after dacryoadenectomy (Supplemental Table 1). This observation suggests that these correlations were due to DED per se and not to the acute effects of the surgical intervention.
Table 2. Spearman correlation coefficients between DED parameters one week after its induction
For the Naïve ConA model, all individual test parameters showed correlations in the appropriate direction; however, only 4 of 6 correlations were statistically significant. In this group, the strongest positive correlation was between TOsm and RB score, while the strongest negative correlation was between TBUT and RB score.
The Abnormal ConA model demonstrated the weakest correlations; only STT and TBUT showed a significant correlation (positive). TBUT and TOsm, as well as TOsm and RB score, had correlations in the expected direction, but none reached statistical significance.
Principal component analysis
Of the three study groups, the dacryoadenectomy model is the definitive method to induce aqueous-deficient DED as all orbital lacrimal gland tissue is removed. Complete dacryoadenectomy had a uniform response to the intervention that induced DED (supported by the Spearman correlation results above) in contrast to the expected variation in response to ConA injection. Thus, PCA was first applied to the dacryoadenectomy group of rabbits to generate PC axes (PC1-PC4), which were later used to evaluate all ConA groups.
PCA, initially applied to the dacryoadenectomy-induced DED group, generated four PC axes. Six pairwise comparisons of these four PCs (PC1-PC2, PC1-PC3, PC1-PC4, PC2-PC3, PC2-PC4, PC3-PC4) were examined for their ability to differentiate DED (week 1) from normal (Baseline) eyes. shows biplots of the most informative PCs in this model. A clear separation between Normal (Baseline) and DED rabbits (Week 1) is observed in biplots of PC1 vs. PC2 and PC1 vs. PC3. Normal eyes segregate to the right side (positive values) and DED eyes segregate to the left side (negative values) of PC1. Statistical evaluation of the PC1 scores showed that the normal and DED groups were significantly different (paired t-test; p = 2.26 x 10⁻¹¹).
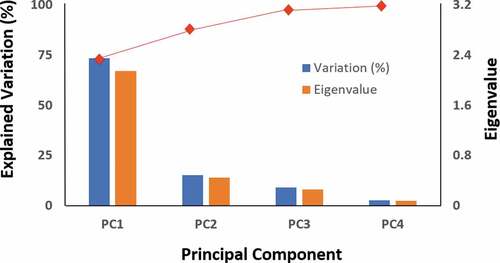
PC1 explains the great majority of the variation (73%) with the remaining three encompassing lower degrees of variation. graphically depicts the relative contribution of each individual PC showing the eigenvalues of the covariance (or correlation) matrix; they represent the “core” of a PCA, since they determine the magnitude of the eigenvectors (principal components). shows the contribution of each clinical test to these PCs. PC1 is composed of similar contributions from all four individual test parameters (18.4% to 30.5%). PC2 is composed almost exclusively from STT (68%) and TOsm (30%), while PC3 has its largest contributions from TOsm (47%) and RB score (29%). PC4 is composed almost exclusively from TBUT (57%) and RB (41%). The squared cosines for each of the variables were greatest along PC1.
Table 3. Relative contribution of the variables to principal components (%)
Figure 3. Variance for the surgical model of DED. The eigenvalues and explained variation for each of the four principal components (PC) is shown. The red line at the top depicts the cumulative variability explained, with the variability of each successive PC being added to that of the preceding one, reaching 100% with PC4. The majority of total variation (>70%) is explained by the first component
Data from the two ConA groups were then plotted using the PC axes generated from the dacryoadenectomy model as described above. The six pairwise comparisons of all four PC’s again demonstrated the best separation between Baseline and DED states for PC1 vs. PC2 and PC1 vs. PC3. The biplots demonstrating these separations are shown in .
Figure 4. Principal Component Bi-Plots for the ConA groups
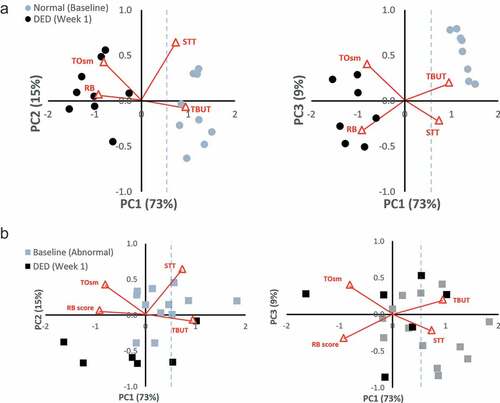
) shows the separation between Baseline and DED state in the Naive ConA group. No overlap exists between the Normal (Baseline) eyes, which segregate to the right (positive) side and the ConA-induced DED eyes that segregate to the left (negative) side of PC1. Of note, the Normal (Baseline) eyes in both the dacryoadenectomy and Naïve ConA groups occupy a similar position along PC1, as expected for eyes that should be entirely normal. The mean baseline PC1 scores were 1.6 for the surgical group and 1.2 for the Naïve ConA group.
) demonstrates the incomplete separation between the Baseline and DED state in the Abnormal ConA group. There is overlap between eyes at Baseline and after DED has been induced for both PC1 vs. PC2 and PC1 vs. PC3 comparisons. The biplot makes it clear that Baseline eyes in this group are not “normal” as they do not occupy the same linear position along PC1 as do the Dacryoadenectomy or Naïve ConA eyes at baseline. Instead, the corresponding baseline values of the Abnormal ConA eyes at baseline are shifted to the left along PC1 (towards the DED side), presumably due to their prior treatment with ConA and/or test agents. The mean baseline PC1 score for the Abnormal ConA group was 0.55, which was statistically different from both the dacryoadenectomy group and the Naïve ConA group at baseline (p < .006 for both).
shows p values for comparisons between various experimental groups. As shown, DED was successfully induced in all groups by the intervention. The p value was most significant for the Surgical Baseline vs Surgical DED (2.3 x 10⁻¹¹), and least significant for the Abnormal ConA Baseline compared to Abnormal ConA DED (0.02). Significance of the PC1 p value for each of the comparisons lies between the most and least significant p values for the same comparisons done with individual clinical tests of DED that were measured.
Table 4. P values for individual clinical test parameters and PC scores
Finally, the segregation of normal and DED states along PC1 allows for an objective, mathematically derived definition of aqueous-deficient DED in rabbits. The PC1 value for all Normal (Baseline) eyes in the Dacryoadenectomy and Naïve ConA groups is 1.44 ± 0.46 (mean ± SD). Using the convention that anything outside two standard deviations is abnormal; then, PC1 values under 0.52 are mathematically defined as DED.
Discussion
The “complex” dataset resulting from multiple individual tests used to measure and characterize aspects of tear physiology and anatomy in DED is often of only limited value. Multiple drawbacks limit the statistical power and utility of these individual tests for research and clinical management. Our results demonstrate that PCA provides a superior means to analyze this dataset providing a simplified and meaningful interpretation of these clinical parameters. The PC1 score, a composite metric incorporating all four DED parameters, is a relevant and actionable result superior to any clinical parameter alone. Additionally, clinically relevant information can be obtained from spatial information on biplots. PCA provides a metric having many characteristics of an ideal metric for DED.
Objectively determining a metric for DED with applicability to other animal models required an optimal system to test whether PCA could be useful for this purpose. Our rigorous experimental approach using novel rabbit models of DED provided such a system. As genetically unaltered rabbits were used with our methods, their compensatory responses are representative of all animals in this species and presumably reflect changes in other mammals including humans more closely than genetically altered animals. Both rabbit models induced aqueous-deficient DED of differing severity by inhibiting tear production from the orbital lacrimal glands via different means thus providing for a fair comparison between groups. Finally, the onset and duration of DED were unambiguous in this system allowing for accurate classification of eyes as normal or DED. This ability, which is not possible in a clinical or even some laboratory settings, is critically important for demonstrating correlations, a requisite for the successful application of PCA.
Objective determination of a metric for DED by experimental means requires a clear separation between normal and diseased states. All standard clinical tests used to assess DED confirmed the successful induction of aqueous-deficient DED in the three experimental groups. At baseline, all three groups appeared very similar based on the four DED diagnostic tests. The one exception was the Abnormal ConA group which had an elevated RB score at baseline. However, as the other three test parameters in the Abnormal ConA group were normal, many investigators would have considered this group normal. After one week, all three groups had DED as evidenced by the congruent responses of the four diagnostic tests.
The severity of DED, as measured by the number and magnitude of statistically significant changes in test parameters, varied between the three groups. DED was most severe in the dacryoadenectomy group where all four tests showed the greatest magnitude of change with the strongest p values. The least severe DED was created in the Abnormal ConA group, where only two of the four diagnostic tests changed significantly. Spearman correlation tests confirmed this as well. The best and strongest correlations were observed in the surgically induced DED group where all possible correlations were statistically significant and in the right direction, ranging in intensity between moderate and very strong (all rs values >0.4). This was less so in the Naive ConA group. The Abnormal ConA group again ranked third in this regard having only one statistically significant correlation (TBUT/STT); the remaining changed in the right direction but did not reach statistical significance.
The heterogeneous response of the clinical diagnostic tests following the induction of DED using the two methods provided the ideal setting to study the applicability of PCA. The dataset from the complete dacryoadenectomy group was chosen to establish the PC axes by which all other data were compared because of the completeness of lacrimal gland removal. This decision was supported by the consistency and severity of the induced DED as measured by the magnitude of change and associated p value for each clinical test parameter, as well as the strength of the correlations for changes in these tests.
PCA results from the Surgical Group clearly demonstrate the utility of PC1 for analyzing aqueous-deficient DED states and allows a mathematical definition of DED. Defining the normal range for PC1 provides a relevant range of values different from and without overlap compared to PC1 values in DED. This is better than the case for two of the individual clinical parameters of STT and TOsm where large physiologic variation results in the overlap between normal and abnormal ranges (even in this optimized experimental setting) limiting their utility in confidently assessing the DED status (Supplemental Table 2). Additionally, the normal range for PC1 is defined without any pre-existing biases. This new composite value, made up of nearly equal contributions from all individual clinical tests, provides a singular value that defines DED status for groups as well as individual eyes efficiently, being more robust and useful than any individual clinical parameter or when other individual parameters are grouped. PC1 greatly enhances the evaluation of DED simplifying a complex array of tests into a single variable, defining disease status and severity. PC1 removes the uncertainty of interpreting DED status when all of the clinical test parameters do not correlate as expected, as often occurs in the clinical or laboratory setting. Finally, the statistical power of PC1 remained excellent, in most cases providing a p value of slightly less strength than the best p value provided by any individual clinical test parameter. Therefore, PC1 can detect statistical change when many of the individual tests fail to do so.
The statistical benefit of using PC1 as a metric for DED is further demonstrated by results in , showing four comparisons between study groups. For example, in the surgical group and Normal ConA groups (rows 1 and 2), comparison of each of the four diagnostic tests between baseline and DED generates (as expected) statistically significant differences, which is also the case for PC1. However, a major advantage of using PC1 as the metric for DED is seen in row 3, where the Abnormal ConA group is assessed. Comparing the individual test results between Baseline and DED (week 1) in this group, only two of the four comparisons lead to statistically significant results, generating in a way the clinical conundrum mentioned earlier. It would be difficult for an investigator to tell if the injection of ConA succeeded in inducing DED as only 2 of 4 clinical measures showed significant change. However, in contrast, the PC1 result encompassing all four tests with roughly equal representation showed that Abnormal ConA eyes did infact become (more) dry following injection as PC1 decreased appropriately with a statistically significant change (p = .02).
Similar benefits are seen with the comparison between Abnormal ConA Baseline and Surgical Baseline eyes (, row 4). When the Abnormal ConA experiment was initiated, it was assumed (clinically) that the animals had undergone an adequate washout and recovery period and had returned to normal because three of the four clinical parameters were no longer statistically different. Only RB remained statistically different. RB, no longer considered a vital dye,Citation28 stains mainly dead or dying cells in the ocular surface indicating breaks in tear-film integrity or a dysfunction in the production of tear-film components such as mucin.Citation29 However, RB can also stain normal conjunctival or corneal cells and by itself cannot unequivocally diagnose DED. An investigator would be hard pressed to categorize this group as abnormal based on this sole measure. However, based on their prior ConA injection (and presumed localized areas of necrosis), it was unlikely that the Abnormal ConA eyes were truly normal at baseline. Of the remaining parameters, only the PC1 score still demonstrated a highly significant difference between these two groups at baseline. The strength of this conclusion is also far greater since PC1 is based on the three other clinical parameters in addition to RB (with almost equal contributions to the score).
Additional benefit from assessing DED status using PCA is obtained by analyzing the spatial information on the informative biplots. When comparing Normal (Baseline) eyes for both the Surgical () and Naïve ConA () groups on both biplots (PC1 vs. PC2 and PC1 vs. PC3) it is clear that Normal eyes populate the same region of space on these graphs. Such a result would be expected for two groups that were truly normal and equivalent. The distribution is especially noteworthy on the PC1 vs PC3 plots where Normal eyes populate the same linear region of space on the graph. This spatial information also aids differentiating abnormal eyes. As seen on the biplots (both PC1 vs PC2 and PC1 vs PC3) for the Abnormal ConA-induced DED, Baseline eyes occupy a position in between the locations filled by the Surgical group’s Normal and Surgical group’s DED data points (though nearer to the surgical DED points). Many of the points (eyes) fall below 0.52 on PC1 at Baseline suggesting these eyes still had DED, while others positioned above 0.52 on PC1 were still not fully recovered or normal. This result is consistent with experimental data as well, given that histological changes showing perturbations in glandular structure (including areas of necrosis) from ConA injections are evident weeks following these injectionsCitation20,Citation21 and that after repeated injections of ConA, a permanent DED condition can be inducedCitation22 suggesting such eyes may never fully recover or “normalize” even after a single injection. Spearman correlation coefficients for the Abnormal ConA group were also much weaker before and after DED induction. We speculate that this explains why a prior clinical study using correlational analysis has failed to show a consistent relationship between the clinical parameters of DED.Citation30,Citation31 Presumably, these studies were unable to do so because they measured compensated DED states of unknown duration where convincing correlations are no longer expected (simulating the location of Abnormal ConA eyes at their baseline position on the biplots).
In conclusion, we have demonstrated the potential of PCA to provide a new composite measure for DED. This approach, incorporating multiple aspects of tear physiology and function, is of clinical and physiological relevance. It can robustly identify DED in rabbits, describe its gradations and assess its course over time, being applicable to both individual eyes and experimental groups. PCA possesses many characteristics of an ideal metric for DED. This system, developed and validated for aqueous-deficient DED in rabbits should also work for other forms of DED assessed using the same parameters measured here. Although PCA has yet to be validated in humans, our work lays the foundation for its application to the human condition. It is conceivable that PCA could expand the spectrum of DED diagnosis to earlier stages not currently recognizable thus greatly assisting in the clinical management and research of this vexing condition. Confirmed in humans, PCA may alleviate diagnostic challenges in DED.
Supplemental Material
Download Zip (308.6 KB)Supplementary material
Supplemental data for this article can be accessed on the publisher’s website.
Additional information
Funding
References
- Goren MB, Goren SB. Diagnostic tests in patients with symptoms of keratoconjunctivitis sicca. Am J Ophthalmol. 1988;106(5):570–74. doi:10.1016/0002-9394(88)90587-9.
- Lucca JA, Nunez JN, Farris RL. A comparison of diagnostic tests for keratoconjunctivitis sicca: lactoplate, schirmer, and tear osmolarity. Clao J. 1990;16:109–12.
- Farris RL, Stuchell RN, Mandel ID. Basal and reflex human tear analysis. I. Physical measurements: osmolarity, basal volumes, and reflex flow rate. Ophthalmology. 1981;88(8):852–57. doi:10.1016/S0161-6420(81)34939-2.
- van Bijsterveld OP. Diagnostic tests in the sicca syndrome. Arch Ophthalmol. 1969;82(1):10–14. doi:10.1001/archopht.1969.00990020012003.
- Vitali C, Moutsopoulos HM, Bombardieri S. The european community study group on diagnostic criteria for sjogren’s syndrome. Sensitivity and specificity of tests for ocular and oral involvement in sjogren’s syndrome. Ann Rheum Dis. 1994;53(10):637–47. doi:10.1136/ard.53.10.637.
- Farris RL. Tear osmolarity–a new gold standard? Adv Exp Med Biol. 1994;350:495–503.
- Tomlinson A, Khanal S, Ramaesh K, Diaper C, McFadyen A. Tear film osmolarity: determination of a referent for dry eye diagnosis. Invest Ophthalmol Vis Sci. 2006;47(10):4309–15. doi:10.1167/iovs.05-1504.
- Methodologies to diagnose and monitor dry eye disease: report of the diagnostic methodology subcommittee of the international dry eye workshop (2007). Ocul Surf. 2007;5(2):108–52. doi:10.1016/S1542-0124(12)70083-6.
- Jolliffe IT, Cadima J. Principal component analysis: A review and recent developments. Philos Trans A Math Phys Eng Sci. 2016;374:20150202.
- Ringner M. What is principal component analysis? Nat Biotechnol. 2008;26(3):303–04. doi:10.1038/nbt0308-303.
- Abdi H, Williams LJ. Principal components analysis. Wiley Interdiscip Rev Comput Stat. 2010;2:433–50. doi:10.1002/wics.101.
- Cohenford MA, Rigas B. Cytologically normal cells from neoplastic cervical samples display extensive structural abnormalities on ir spectroscopy: implications for tumor biology. Proc Natl Acad Sci U S A. 1998;95(26):15327–32. doi:10.1073/pnas.95.26.15327.
- Cohenford MA, Lim S, Brown C, Chaudhry MA, Sigdel S, Beckelhimer E, Rigas B. Ft-ir microspectroscopy of mouse colon tissues: insight into the chemistry of carcinogenesis and diagnostic potential. Am J Pathol. 2012;181(6):1961–68. doi:10.1016/j.ajpath.2012.08.039.
- Giuliani A. The application of principal component analysis to drug discovery and biomedical data. Drug Discov Today. 2017;22(7):1069–76. doi:10.1016/j.drudis.2017.01.005.
- Honkanen R, Huang W, Huang L, Kaplowitz K, Weissbart S, Rigas B. A new rabbit model of chronic dry eye disease induced by complete surgical dacryoadenectomy. Curr Eye Res. 2019;44(8):863–72. doi:10.1080/02713683.2019.1594933.
- Honkanen RA, Huang L, Xie G, Rigas B. Phosphosulindac is efficacious in an improved concanavalin a-based rabbit model of chronic dry eye disease. Transl Res. 2018;198:58–72. doi:10.1016/j.trsl.2018.04.002.
- Honkanen R, Huang W, Huang L, Kaplowitz K, Weissbart S, Rigas B. A new rabbit model of chronic dry eye disease induced by complete surgical dacryoadenectomy. Curr Eye Res. 2019;in press:1–10.
- Bhattacharya D, Ning Y, Zhao F, Stevenson W, Chen R, Zhang J, Wang M. Tear production after bilateral main lacrimal gland resection in rabbits. Invest Ophthalmol Vis Sci. 2015;56(13):7774–83. doi:10.1167/iovs.15-17550.
- Destruel PL, Zeng N, Maury M, Mignet N, Boudy V. In vitro and in vivo evaluation of in situ gelling systems for sustained topical ophthalmic delivery: state of the art and beyond. Drug Discov Today. 2016;22(4):638–651.
- Zheng W, Ma M, Du E, Zhang Z, Jiang K, Gu Q, Ke B. Therapeutic efficacy of fibroblast growth factor 10 in a rabbit model of dry eye. Mol Med Rep. 2015;12(5):7344–50. doi:10.3892/mmr.2015.4368.
- Nagelhout TJ, Gamache DA, Roberts L, Brady MT, Yanni JM. Preservation of tear film integrity and inhibition of corneal injury by dexamethasone in a rabbit model of lacrimal gland inflammation-induced dry eye. J Ocul Pharmacol Ther. 2005;21(2):139–48. doi:10.1089/jop.2005.21.139.
- Honkanen RA, Huang L, Rigas B. A rabbit model of aqueous-deficient dry eye disease induced by concanavalin a injection into the lacrimal glands: application to drug efficacy studies. J Vis Exp. 2020;155.
- Honkanen RA, Huang L, Huang W, Rigas B. Establishment of a severe dry eye model using complete dacryoadenectomy in rabbits. J Vis Exp. 2019; Submitted.
- Bron AJ, Evans VE, Smith JA. Grading of corneal and conjunctival staining in the context of other dry eye tests. Cornea. 2003;22(7):640–50. doi:10.1097/00003226-200310000-00008.
- Savini G, Prabhawasat P, Kojima T, Grueterich M, Espana E, Goto E. The challenge of dry eye diagnosis. Clin Ophthalmol. 2008;2(1):31–55. doi:10.2147/OPTH.S1496.
- Lemp MA. Report of the national eye institute/industry workshop on clinical trials in dry eyes. Clao J. 1995;21:221–32.
- Cerny BA, Kaiser HF. A study of a measure of sampling adequacy for factor-analytic correlation matrices. Multivariate Behav Res. 1977;12(1):43–47. doi:10.1207/s15327906mbr1201_3.
- Doughty MJ. Rose bengal staining as an assessment of ocular surface damage and recovery in dry eye disease-a review. Cont Lens Anterior Eye. 2013;36(6):272–80. doi:10.1016/j.clae.2013.07.008.
- Khan-Lim D, Berry M. Still confused about rose bengal? Curr Eye Res. 2004;29(4–5):311–17. doi:10.1080/02713680490516864.
- Tsubota K, Kaido M, Yagi Y, Fujihara T, Shimmura S. Diseases associated with ocular surface abnormalities: the importance of reflex tearing. Br J Ophthalmol. 1999;83(1):89–91. doi:10.1136/bjo.83.1.89.
- Lemp MA. Recent developments in dry eye management. Ophthalmology. 1987;94(10):1299–304. doi:10.1016/S0161-6420(87)80015-5.