
ABSTRACT
Purpose
To describe the changes in corneal epithelial thickness and reflectivity following simple limbal epithelial transplantation (SLET) using anterior segment optical coherence tomography (ASOCT).
Methods
This was a prospective imaging study of 31 eyes of 29 patients who had undergone autologous or allogeneic SLET for limbal stem cell deficiency and had stable, avascular surfaces postoperatively. ASOCT scans of all four quadrants were taken preoperatively and at 1-week, 1-month, 3-month, 6-month, and 1-year postoperative time points in the eyes undergoing SLET. Baseline scans were also taken from the normal eye in unilateral cases. The following parameters were obtained from the scans: (i) epithelial thickness (ET), (ii) stromal thickness, (iii) total corneal thickness, (iv) epithelial reflectivity (ER), (v) stromal reflectivity, and (vi) epithelial/stromal (ES) reflectivity ratio.
Results
Chemical injury (24 eyes, 77.4%) was the most common indication for surgery. There was a significant improvement in the ET (184.8 ± 117.1 vs 60.3 ± 10 µm, p < .0001) and ER (144.5 ± 26.4 vs 120.9 ± 28.9, p < .0001) within the initial postoperative period following SLET, which remained stable at the end of 1 year follow-up. There was no difference in the ET of the post-SLET and normal eyes after the 3-month timepoint and this normalization was maintained until the end of the first year. A significant normalization was also noted in the ES reflectivity ratio at the end of 1 year (2.1 ± 0.8 vs 1 ± 0.2, p < .001). A significant correlation was found between the final visual acuity and the total corneal thickness (r = 0.942, p = .005).
Conclusion
There is a significant improvement in the epithelial thickness and reflectivity of the cornea in eyes undergoing SLET. ASOCT provides a reliable objective measure of these changes and can be used to monitor the outcomes in these eyes postoperatively.
Introduction
Limbal stem cells provide a reservoir for replenishing corneal epithelial cells and at the same time act as an anatomical barrier between corneal and conjunctival epithelial cells.Citation1,Citation2 When there is a deficiency of these cells, either partial or total, this barrier function is compromised leading to the conjunctivalization of the cornea.Citation2,Citation3 This is associated with an unstable surface with repeated breakdowns which eventually leads to corneal opacification.Citation4,Citation5 The underlying causes of limbal stem cell deficiency (LSCD) such as ocular burns, Stevens–Johnson syndrome, and mucous membrane pemphigoid can also independently contribute to the unstable epithelium.Citation2,Citation4,Citation5
The surgical management of LSCD includes several options such as conjunctival limbal autografting and cultivated limbal epithelial transplantation. Of these, simple limbal epithelial transplantation (SLET) has become popular over the last decade and is emerging as the management of choice, especially in unilateral cases.Citation6–8 Several studies have described the outcomes following this surgical procedure in terms of re-establishing an intact avascular epithelial surface and improvement in the visual acuity.Citation8–11 Interestingly, a few studies have also described a decrease in the degree of corneal scarring.Citation6,Citation12 However, there has been no prior attempt to objectively quantify the extent of these epithelial or stromal changes. With the advent of high-resolution anterior segment optical coherence tomography (ASOCT) which yields images with an axial resolution of 5–18 μm and a transverse resolution of 15–100 μm, it has become possible to monitor the in vivo changes occurring within the cornea following such procedures.Citation13 Thus, this study was conducted to provide an objective measurement of the normalization of corneal epithelium following SLET with the help of serial ASOCT scans.
Methods
This was a longitudinal prospective study conducted between December 2015 and May 2019 at the L.V. Prasad Eye Institute, Hyderabad, India. The study was approved by the Institute Ethics Committee and adhered to the tenets of the Declaration of Helsinki. A written informed consent was obtained from all study participants. All patients who were planned for either autologous or allogenic SLET were included in the study. Preoperative details including the demographic details, underlying cause of LSCD, the extent of LSCD (partial or total), duration of the disease, and baseline visual acuity were documented. The surgical technique of SLET has been described earlier.Citation12 The postoperative regimen of topical medications has also been described previously.Citation12 In brief, patients who underwent auto-SLET were given a tapering dose of topical steroids in combination with topical antibiotics over a period of 6 weeks, whereas patients who underwent allo-SLET were started on a standard dosing regimen of systemic immunosuppressants along with a tapered course of topical steroids.Citation12 These cases were continued on a maintenance dose of topical steroids (1–2 times/day). Epithelial healing was assessed with fluorescence staining until complete re-epithelialization was noted. Those eyes wherein the SLET procedure had failed to re-epithelialize the surface were excluded from the study.
High-resolution serial ASOCT scans were taken (Optovue Inc., Fremont, CA, USA) from all four quadrants of the cornea using the cross-line scan mode. The following parameters were documented with the internal calibration of the device: i) Total corneal thickness ii) Epithelial thickness iii) Stromal thickness. These scans were taken at the preoperative visit, 1 week, 1-month, 3-month, 6-month, and 1-year postoperative visits. Baseline scans from the normal eye in unilateral cases were also documented. The corresponding best corrected visual acuities at these visits were also noted. The image analysis was carried out using image annotation software ImageJ (1.52q Wayne Rasband, NIH, USA).Citation14 After transferring the image into the software, the epithelium and stromal areas were marked separately using the freehand selection tool. The measurement tool was then used to calculate the reflectivity of both layers using mean gray-scale units (GSU) in the respective areas.Citation14 The ratio of the mean corneal to the mean stromal GSU was calculated to give the epithelial/stromal reflectivity (ES) ratio. This process was repeated for scans taken at every time point pre and postoperatively. The total time taken for obtaining these scans and subjecting them to the process of image analysis ranged from 15 to 20 minutes per patient.
Statistical analysis was performed using GraphPad prism software version 9.1.2 (San Diego, CA, USA). The mixed model repeated measures ANOVA was used to compare the changes in reflectivity between different time points and between different quadrants at each time point. Post-hoc analysis of pairwise comparisons was done with Šídák’s and Tukey multiple comparison tests. The same procedure was repeated to compare the imaging data between the post-SLET and the normal eyes. Pearson correlation was used to determine the correlation between the final visual acuity and the corneal reflectivity. A probability of less than 0.05 was considered statistically significant.
Results
A total of 29 patients (n = 31 eyes) were included in the study. There were 17 males and 12 females with a median age of 21.5 years (IQR 14–30.75 years) (). Twenty-seven patients had unilateral surgery, while two patients had bilateral surgery. The median visual acuity at presentation was logMAR1.8 (IQR, 1.6–1.8). Twenty-five eyes (80.6%) had total LSCD, while five eyes (19.4%) had partial LSCD. The median duration of the underlying disease prior to undergoing SLET was 1 year (IQR 0.4–6 years) (). Chemical injury (24 eyes, 77.4%) was the most common indication for which the patients underwent SLET.
Table 1. Demographic details and baseline parameters of the patients
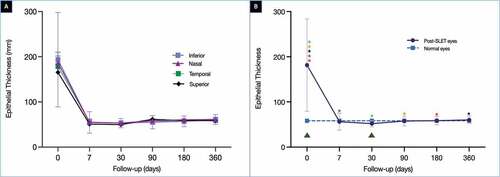
The mean corneal thickness (total corneal thickness [TCT], epithelial [ET], and stromal thickness [ST]) and mean corneal reflectivity (epithelial [ER] and stromal reflectivity [SR]) measured in different quadrants across different time points have been presented in . The mean TCT preoperatively was 571.5 ± 171.4 µm with an ET and ST of 184.8 ± 117.1 and 403.9 ± 105.3 µm, respectively. The TCT decreased over the initial postoperative period and was 403.7 ± 125.9 µm at the end of 1 year. The difference between this thickness and the preoperative one was significant (p < .00001). A similar significant drop was noted in the ET in the initial 1 week (54.7 ± 23.2 µm, p = .0006), with a final thickness of 60.3 ± 10 µm (). The ET measured in normal eyes was 58.3 µm. Although the difference between the ET of the post-SLET and normal eyes was significant at the 1 week (p = .0001) and 1-month time point (p = .02, ), no significant difference was noted between the ET of post-SLET and normal eyes at the subsequent time points. The ST in post-SLET also decreased postoperatively with a final ST of 343.6 ± 122.9 µm at the end of 1 year (p = .01).
Table 2. This table describes the total corneal thickness, epithelial and stromal thickness measured in different quadrants, and the visual acuity across different time points
Table 3. This table describes the epithelial reflectivity, stromal reflectivity, and the epithelial/stromal reflectivity ratio measured in different quadrants and across different time points
Figure 1. (A) The graph depicts the change in the epithelial thickness (ET) measured in all four quadrants over a period of one year. (B) The graph compares the average of the ET measured in four quadrants at each time point with the normal values. The difference between the post-SLET eyes and the normal eyes was significant (p < .0001). The green triangles depict the times points at which the difference in ET between the post-SLET eyes and the normal eyes was significant on post-hoc analysis. The coloured stars represent the time points at which the difference within the post-SLET eyes was significant on post-hoc analysis. The same coloured stars represent the pairs where the ET was significantly different
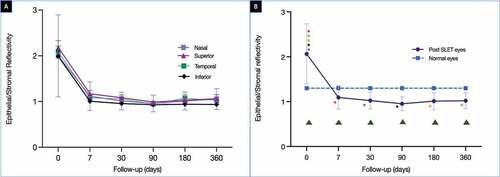
The preoperative ER was 144.5 ± 26.4 (). A steep fall in the ER was noted in the initial 1 week of the postoperative period (121.1 ± 37) after which the values remained stable (). This trend of change over time of the ER was found to be significant (p < .0001). The final mean ER was 120.9 ± 28.9 at the end of 1 year and it was significantly different from the mean epithelial reflectivity of normal eyes (86.9 ± 16.4, p < .0001) (, ). There was an increase in SR noted in all quadrants in the initial postoperative phase with significant differences between the pre-op and 1-week (p = .01) and 1 month (p = .0003) values. This continued to fluctuate over the next 1 year with a mean SR at the end of 1 year of 120.8 ± 30.3. This difference was significant when compared to the mean SR of normal eyes (p < .0001, ). The mean preoperative ES ratio was 2 ± 0.8. This ratio rapidly decreased over the first postoperative week (1.1 ± 0.3) after which the values remained stable (), and at the final follow-up of 1 year, the mean ES ratio was 1 ± 0.2. This decrease in ratio with time was significant (p = .005). The mean ES at the end of 1 year was significantly lower than that of normal eyes (p = .005, ). Detailed results have been given in .
Table 4. Comparison of different reflectivity parameters between post-SLET eyes and normal eyes
Table 5. This table details the results of the ANOVA test of the difference in epithelial thickness, reflectivity, and epithelial/stromal reflectivity of the post-SLET eyes at different time points
Table 6. This table details the results of the ANOVA test of the difference between the epithelial thickness, reflectivity, and epithelial/stromal reflectivity of the post-SLET eyes and normal eyes
Figure 2. (A) The graph illustrates the change in the epithelial reflectivity (ER) measured in all four quadrants over a period of one year. (B) The graph compares the average of the ER measured in four quadrants at each time point with the normal values. The difference between the post-SLET eyes and the normal eyes was significant (p < .0001). The green triangles depicts the times points at which the difference in ER between the post-SLET eyes and the normal eyes was significant on post-hoc analysis. The coloured stars represent the time points at which the difference within the post-SLET eyes was significant on post-hoc analysis. The same coloured stars represent the pairs where the ER was significantly different
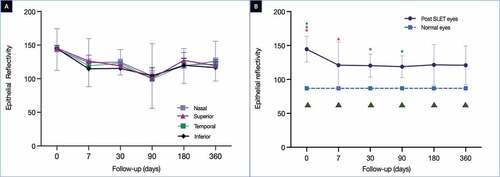
Figure 3. (A) The graph depicts the change in the epithelial/stromal reflectivity (ES) ratio measured in all four quadrants over a period of one year. (B) The graph compares the average of the ES ratio measured in four quadrants at each time point with the normal values. The difference between the post-SLET eyes and the normal eyes was significant (p = .005). The green triangles depict the times points at which the difference in ES ratio between the post-SLET eyes and the normal eyes was significant on post-hoc analysis. The coloured stars represent the time points at which the difference within the post-SLET eyes was significant on post-hoc analysis. The same coloured stars represent the pairs where the ES ratio was significantly different
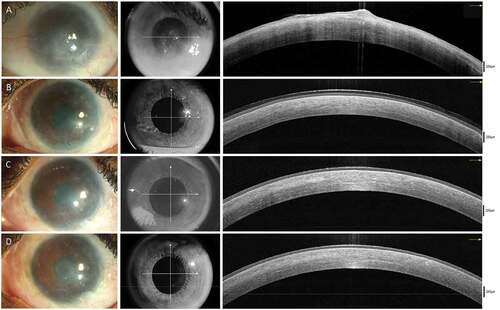
is a representative collage of clinical and OCT images showing the normalization of corneal epithelium following SLET. A steady improvement was noted in the visual acuity at all time points in the postoperative period, with the median final visual acuity being logMAR 0.6 (IQR 0.3–1) (). A significant difference was noted between the presenting and the final visual acuity (p < .00001). A strong positive correlation was found between visual acuity and total corneal thickness (r = 0. 942, p = .005). No correlation was found between epithelial reflectivity or ES ratio and vision.
Figure 4. This is a representative collage of serial preoperative (A) and postoperative (B,C,D) clinical images and corresponding OCT line scans that illustrate the improvement in corneal clarity post-SLET (left eye)
Discussion
Simple limbal epithelial transplant as a surgical modality for LSCD has gained momentum primarily because of its efficacy and simplicity, as the procedure is not dependent on the presence of a laboratory facility for cell expansion and is often a single staged procedure. Although several studies have reported restoration of a stable epithelialized surface following this surgery, the exact course of changes in the epithelial thickness and reflectivity are not well documented.Citation7–11,Citation15 The current study found a steady improvement in the epithelial thickness and reflectivity after SLET over the course of the first postoperative year. The epithelial thickness reached the baseline value of the normal eye after 3 months and this was maintained until the end of the follow-up period. A similar progressive decrease in the ES ratio was noted from the one-month postoperative period and this persisted until the end of the 1-year follow-up. However, the final values of epithelial reflectivity and ES ratio were still significantly different than those of the normal eyes.
ASOCT is a rapid, non-invasive tool that is also not very operator dependent. It has been used for the measurement of corneal reflectivity to assess the degree of corneal scarring. Wirbelauer et al. correlated the OCT findings with histopathology and found the device to be a good in vivo surrogate for objective morphometric assessment of corneal changes.Citation16 Corneal reflectivity measured from an AS-OCT has also been used to assess tear film hyperosmolarity in dry eye disease, corneal scarring in various disorders and to quantify changes in the cornea in LSCD.Citation14,Citation17,Citation18 Several other devices are also capable of recording corneal pachymetry and of these a corneal tomography probably provides the most composite representation of thickness in both the central and peripheral corneas. The Pentacam is one such device that captures a three-dimensional image of the cornea from nearly 25,000–138,000 separate points using a rotating Scheimpflug camera.Citation19 Although a few studies have reported a good correlation between ASOCT and Pentacam-derived values, the pachymetry values from ASOCT are more accurate especially in eyes with corneal edema and scarring.Citation20–23 Thus, this renders the ASOCT to be the modality of choice for measuring and monitoring changes in corneal thickness.
Restoration of a stable epithelial surface has been well documented following SLET; however, this has not been objectively quantified.Citation7–9,Citation11 This stabilization has been reported after both auto- and allo-SLET.Citation6,Citation12 Although the change in the ES ratio in post-SLET eyes has not been previously studied, Varma et al. described these parameters in the context of LSCD.Citation17 It is found that high epithelial reflectivity (>142.9) and ES ratio values (>1.29) correlate closely with the presence of LSCD. In the current study, the preoperative epithelial reflectivity values and ES ratios were higher than these cut-offs and dropped below them within the first postoperative week, indicating a reversal of LSCD and a trend towards normalization.
The dramatic improvement noted in the epithelial thickness and reflectivity can be attributed to the fact that the abnormal conjunctival epithelium, causing the higher preoperative values of ET and ER, is removed intraoperatively. Furthermore, several studies have reported completion of epithelialization within the initial 2 weeks following SLET.Citation24–26 This would also have resulted in the rapid normalization of ET seen in the current series. Although there was a significant decrease in the epithelial reflectivity, complete normalization was not achieved at the end of 1 year, suggesting a progressive remodeling process going beyond a mere substitution of one epithelium with the other. The improvement noted in the epithelial clarity was not replicated in the stromal reflectivity. This could be because the original baseline values obtained may be falsely low due to the back-shadowing from the highly reflective conjunctival epithelium within the pannus. And so, any improvement occurring subsequently may not be reflected in the serial measurements. Moreover, the duration of follow-up of these cases may not have been adequate to pick up these remodeling changes that may continue to occur in the years following SLET. As a result, the ES ratios in the post-SLET eyes were lower than those of the normal eyes. With progressive improvement in SR with time, the ES ratio may also probably normalize. This factor has to be considered when planning such cases for keratoplasty for visual rehabilitation. Improvements in the degree of the corneal scarring may continue to occur for a few years after the patient has undergone SLET and with options such as rigid contact lenses, keratoplasty may be rendered unnecessary.
The potential of SLET, a procedure aimed at correcting epithelial stability issues, to address underlying stromal scarring, is an interesting concept. The stromal mesenchymal stem cells in the limbal biopsy obtained during the surgical procedure are capable of establishing independent viable cell lines in in-vitro cultures of epithelial cells, suggesting that a similar phenomenon may be occurring in vivo as well.Citation27,Citation28 In the chronic phase of healing, once the scar formation is complete, these stem cells can induce remodeling of the scar by generating new keratocytes that can then lay down normal extracellular matrix and collagen complex.Citation29,Citation30 The degree to which this process can affect the severity of scarring is variable. Du et al. demonstrated complete restoration of transparency in mice cornea following treatment with stromal stem cells; however, human corneas are more crosslinked and thus more resilient to the induced remodeling changes.Citation30
The strength of our study is that it is the first attempt to objectively quantify epithelial changes in terms of thickness and reflectivity following SLET. This quantification has been done using simple measurements obtained from an ASOCT device, which is usually a part of the diagnostic armamentarium of all corneal surgeons practicing SLET. The comparison with normal eyes also provides a perspective into the time taken for normalization and the degree to which it was achieved at the end of the year. The small sample size and the lack of follow-up beyond the initial 1 year are the limitations of the study. However, not all eyes with LSCD are suitable for SLET, and the LSCD itself is not a common clinical entity encountered in the routine corneal clinics. And so, obtaining many cases in a prospective study on patients with successful SLET outcomes will be challenging. Studies with follow-up period of greater than a year that look into the changes in the OCT findings will provide a better understanding of the course of epithelial changes following surgical procedures.
Thus, this study provides a simple and objective tool to measure the changes in corneal epithelium following SLET. There is a significant improvement in the epithelial thickness, reflectivity, and ES ratio that remains stable until the end of 1 year. However, complete normalization is not achieved, at least within this time period. In conclusion, corneal surgeons practicing SLET and other stem cell therapies in patients with LSCD can use ASOCT as a tool to monitor postoperative epithelial improvement in these eyes.
Data availability
All the data relevant to the study have been provided in this manuscript.
Disclosure statement
No potential conflict of interest was reported by the author(s).
Additional information
Funding
References
- Sacchetti M, Rama P, Bruscolini A, Lambiase A. Limbal stem cell transplantation: clinical results, limits, and perspectives. Stem Cells Int. 2018;2018:e8086269. doi:10.1155/2018/8086269.
- Sangwan VS. Limbal stem cells in health and disease. Biosci Rep. 2001;21(4):385–405. doi:10.1023/A:1017935624867.
- Le Q, Xu J, Deng SX. The diagnosis of limbal stem cell deficiency. Ocul Surf. 2018;16(1):58–69. doi:10.1016/j.jtos.2017.11.002.
- Kim KH, Mian SI. Diagnosis of corneal limbal stem cell deficiency. Curr Opin Ophthalmol. 2017;28(4):355–62. doi:10.1097/ICU.0000000000000387.
- Yin J, Jurkunas U. Limbal stem cell transplantation and complications. Semin Ophthalmol. 2018;33(1):134–41. doi:10.1080/08820538.2017.1353834.
- Wang Y, Hu X, Yang K, Zhang Y, Deng S, Wang Z, Li S, Tian L, Jie Y. Clinical outcomes of modified simple limbal epithelial transplantation for limbal stem cell deficiency in Chinese population: a retrospective case series. Stem Cell Res Ther. 2021;12(1):259. doi:10.1186/s13287-021-02345-2.
- Basu S, Sureka SP, Shanbhag SS, Kethiri AR, Singh V, Sangwan VS. Simple limbal epithelial transplantation: long-term clinical outcomes in 125 cases of unilateral chronic ocular surface burns. Ophthalmology. 2016;123(5):1000–10. doi:10.1016/j.ophtha.2015.12.042.
- Vazirani J, Ali MH, Sharma N, Gupta N, Mittal V, Atallah M, Amescua G, Chowdhury T, Abdala-Figuerola A, Ramirez-Miranda A, et al. Autologous simple limbal epithelial transplantation for unilateral limbal stem cell deficiency: multicentre results. Br J Ophthalmol. 2016;100(10):1416–20. doi:10.1136/bjophthalmol-2015-307348.
- Gupta N, Joshi J, Farooqui JH, Mathur U. Results of simple limbal epithelial transplantation in unilateral ocular surface burn. Indian J Ophthalmol. 2018;66(1):45–52. doi:10.4103/ijo.IJO_602_17.
- Amescua G, Atallah M, Nikpoor N, Galor A, Perez VL. Modified simple limbal epithelial transplantation using cryopreserved amniotic membrane for unilateral limbal stem cell deficiency. Am J Ophthalmol. 2014;158(3):469–475.e2. doi:10.1016/j.ajo.2014.06.002.
- Basu S, Mohan S, Bhalekar S, Singh V, Sangwan V. Simple limbal epithelial transplantation (SLET) in failed cultivated limbal epithelial transplantation (CLET) for unilateral chronic ocular burns. Br J Ophthalmol. 2018;102(12):1640–45. doi:10.1136/bjophthalmol-2017-311506.
- Shanbhag SS, Patel CN, Goyal R, Donthineni PR, Singh V, Basu S. Simple limbal epithelial transplantation (SLET): review of indications, surgical technique, mechanism, outcomes, limitations, and impact. Indian J Ophthalmol. 2019;67(8):1265–77. doi:10.4103/ijo.IJO_117_19.
- Ang M, Baskaran M, Werkmeister RM, Chua J, Schmidl D, Aranha dos Santos V, Garhöfer G, JS M, Schmetterer L. Anterior segment optical coherence tomography. Prog Retin Eye Res. 2018;66:132–56.
- Joshi VP, Vaishnavi KS, Ojha SK, Singh V, Basu S. A reliable animal model of corneal stromal opacity: development and validation using in vivo imaging. Ocul Surf. 2020;18(4):681–88. doi:10.1016/j.jtos.2020.07.017.
- Prabhasawat P, Chirapapaisan C, Ngowyutagon P, Ekpo P, Tangpagasit W, Lekhanont K, Sikarinkul R, Matamnan S, Boonwong C, Pinitpuwadol W, et al. Efficacy and outcome of simple limbal epithelial transplantation for limbal stem cell deficiency verified by epithelial phenotypes integrated with clinical evaluation. Ocul Surf. 2021;22:27–37. doi:10.1016/j.jtos.2021.06.012.
- Wirbelauer C, Winkler J, Bastian GO, Häberle H, Pham DT. Histopathological correlation of corneal diseases with optical coherence tomography. Graefes Arch Clin Exp Ophthalmol. 2002;240(9):727–34. doi:10.1007/s00417-002-0518-3.
- Varma S, Shanbhag SS, Donthineni PR, Mishra DK, Singh V, Basu S. High-resolution optical coherence tomography angiography characteristics of limbal stem cell deficiency. Diagnostics. 2021;11(6):1130. doi:10.3390/diagnostics11061130.
- Deinema LA, Vingrys AJ, Chinnery HR, Downie LE. Optical coherence tomography reveals changes to corneal reflectivity and thickness in individuals with tear hyperosmolarity. Trans Vis Sci Tech. 2017;6(3):6–6. doi:10.1167/tvst.6.3.6.
- Motlagh MN, Moshirfar M, Murri MS, Skanchy DF, Momeni-Moghaddam H, Ronquillo YC, Hoopes PC. Pentacam® corneal tomography for screening of refractive surgery candidates: a review of the literature, part I. Med Hypothesis Discov Innov Ophthalmol. 2019;8:177–203.
- Wongchaisuwat N, Metheetrairat A, Chonpimai P, Nujoi W, Prabhasawat P. Comparison of central corneal thickness measurements in corneal edema using ultrasound pachymetry, Visante anterior-segment optical coherence tomography, Cirrus optical coherence tomography, and Pentacam Scheimpflug camera tomography. Clin Ophthalmol. 2018;12:1865–73. doi:10.2147/OPTH.S172159.
- Kanellopoulos AJ, Asimellis G. Comparison of high-resolution Scheimpflug and high-frequency ultrasound biomicroscopy to anterior-segment OCT corneal thickness measurements. Clin Ophthalmol. 2013;7:2239–47. doi:10.2147/OPTH.S53718.
- González-Pérez J, Queiruga Piñeiro J, Sánchez García Á, González Méijome JM. Comparison of central corneal thickness measured by standard ultrasound pachymetry, corneal topography, tono-pachymetry and anterior segment optical coherence tomography. Curr Eye Res. 2018;43(7):866–72. doi:10.1080/02713683.2018.1461910.
- Baghdasaryan E, Huang X, Marion KM, Tepelus TC, Bagherinia H, Sadda SR, Hsu HY. Reproducibility of central corneal thickness measurements in normal eyes using the zeiss cirrus 5000 HD-OCT and Pentacam HR. Open J Ophthalmol. 2018;12:1. doi:10.2174/1874364101812010072.
- Mittal V, Jain R, Mittal R. Ocular surface epithelialization pattern after simple limbal epithelial transplantation: an in vivo observational study. Cornea. 2015;34(10):1227–32. doi:10.1097/ICO.0000000000000573.
- Kate A, Shanbhag SS, Goyal R, Basu S. Serial anterior segment optical coherence tomography post autologous simple limbal epithelial transplantation. BMJ Case Rep. 2020;13(12):e236692. doi:10.1136/bcr-2020-236692.
- Ray Chaudhuri B, Bhaduri A, Sengupta M. The ocular surface after simple limbal epithelial transplant (SLET): a high-resolution OCT study of the early postoperative period. Indian J Ophthalmol. 2019;67(8):1348–50. doi:10.4103/ijo.IJO_1722_18.
- Polisetty N, Fatima A, Madhira SL, Sangwan VS, Vemuganti GK. Mesenchymal cells from limbal stroma of human eye. Mol Vis. 2008;14:431–42.
- Basu S, Hertsenberg AJ, Funderburgh ML, Burrow MK, Mann MM, Du Y, Lathrop KL, Syed-Picard FN, Adams SM, Birk DE, et al. Human limbal biopsy-derived stromal stem cells prevent corneal scarring. Sci Transl Med. 2014;6(266):266ra172. doi:10.1126/scitranslmed.3009644.
- Demirayak B, Yüksel N, Çelik OS, Subaşı C, Duruksu G, Unal ZS, Yıldız DK, Karaöz E. Effect of bone marrow and adipose tissue-derived mesenchymal stem cells on the natural course of corneal scarring after penetrating injury. Exp Eye Res. 2016;151:227–35. doi:10.1016/j.exer.2016.08.011.
- Du Y, Carlson EC, Funderburgh ML, Birk DE, Pearlman E, Guo N, Kao WW-Y, Funderburgh JL. Stem cell therapy restores transparency to defective murine corneas. Stem Cells. 2009;27(7):1635–42. doi:10.1002/stem.91.