
Abstract
Purpose
To evaluate the relationship between ocular magnification correction and macular choroidal thickness (ChT) measurements in children, and to demonstrate when ocular magnification correction is necessary.
Methods
Chinese children aged 6–9 years with various refractive statuses were included. Swept-source optical coherence tomography was used to measure macular ChT. A self-designed program was adopted to simulate ChT changes in each sector of the ETDRS grid in the macula under various simulated axial lengths (ALs).
Results
ChT measurements were not affected for all simulated ALs in over 95% of the individuals in the central fovea. In the inferior, superior, and temporal parafoveal sectors, the extent of AL that may include 95% of the individuals narrowed from approximately 22.0 mm to 27.2 mm. In the nasal parafoveal sector and inferior, superior, and temporal perifoveal sectors, the extent of AL that may include 95% of the individuals became even narrower, from approximately 22.8 mm to 26.0 mm. The narrowest extent was observed in the perifoveal nasal sector, ranging from 23.3 mm to 25.5 mm. The effect of ocular magnification was more significant in hyperopes than in myopes in the inferior parafoveal sector and temporal, superior, and nasal perifoveal sectors.
Conclusion
During macular ChT measurements, ocular magnification correction is not necessary in the central fovea. However, ocular magnification should be corrected normally in the nasal perifoveal region and in individuals with ALs shorter than 22.8 mm or longer than 26.0 mm in the remaining macular regions.
Introduction
Swept-source optical coherence tomography (SS-OCT) is commonly used to study the choroid in vivo and measure choroidal thickness (ChT), which is useful for grading myopic fundus changes.Citation1–5 Among the various methods used for ChT measurements, the Early Treatment of Diabetic Retinopathy Study (ETDRS) grid is widely employed because it can reflect the mean ChT of the macular region.Citation4–8 Based on the Gullstrand schematic eye, the diameters of the inner circle (central foveal), middle circle (parafoveal), and outer circle (perifoveal) of the ETDRS grid are 1 mm, 3 mm, and 6 mm, respectively. However, the actual size of the OCT scan area may vary among individuals because of differences in ocular magnification.Citation9,Citation10 Several factors, such as axial length (AL) and corneal power, may influence the level of ocular magnification, and AL is considered the leading impact factor.Citation11–13
Ocular magnification was first described using fundus photographs.Citation10,Citation14 Later, it was found to influence the measurements of circumpapillary retinal nerve fiber layer (cpRNFL) thickness on OCT.Citation15–23 A previous study showed that ALs shorter than 23.60 mm and longer than 25.55 mm need ocular magnification correction during cpRNFL thickness measurements.Citation23 In recent years, its impact on the measurement of macular parameters has also been reported.Citation24–27 In general, previous research mainly focused on the relationship between ocular magnification and macular retinal layer thickness measurements; however, the relationship between ocular magnification and macular ChT measurements remains unclear.
Littmann’s method is commonly used to correct ocular magnification because it can correct for the actual size of the scan area.Citation28,Citation29 However, only some OCT devices can make corrections in ocular magnification using Littmann’s method before imaging. Unlike the measurement of cpRNFL thickness, which can correct for ocular magnification using Kang’s method even after imaging,Citation30 no standard approach can be used to correct ocular magnification in macular ChT measurements using the ETDRS grid after imaging. Therefore, it is critical to understand the relationship between macular ChT measurements and ocular magnification to help assess the real macular ChT.
To date, no quantitative analysis has been performed to evaluate the relationship between ocular magnification and macular ChT measurements, and ALs requiring correction for ocular magnification have not been well evaluated. Therefore, our study aimed to explore the relationship between macular ChT measurements and ocular magnification correction to determine ALs requiring adjustment in macular ChT measurements for ocular magnification during SS-OCT examinations.
Materials and methods
Participants and ethical approval
This study was conducted between May 2017 and June 2017 in Shanghai, China. Chinese children aged 6–9 years with different refractive statuses were included. Children with ptosis, amblyopia, strabismus, congenital cataracts, glaucoma, fundus diseases, or previous ocular surgery were excluded from the study.
Ethical approval was obtained from the Institutional Review Board of Shanghai General Hospital, Shanghai Jiao Tong University (ethics approval number: 2015KYl50), and the study was performed in accordance with the tenets of the Declaration of Helsinki. Written informed consent was obtained from the parents or guardians before the study, and oral consent was obtained from all participating children.
Comprehensive ocular examinations
Visual acuity was tested at a 4-m distance using a retro-illuminated ETDRS chart (Guangzhou Xieyi Weishikang, China). AL was obtained using ocular biometry (IOLMaster, version 5.02, Carl Zeiss Meditec, Germany). After cycloplegia, refraction and corneal curvature were measured using an autorefractor (KR-8900, Topcon, Japan). The protocol for cycloplegia was described in detail in our previous studies.Citation4–6
SS-OCT examination
SS-OCT (DRI OCT-1 Atlantis, Topcon, Japan) was used to measure macular ChT in the right eye. Children with clear OCT images and image signal strength > 60 were included in the final analyses. The axial resolution of the SS-OCT was 8 μm. SS-OCT examinations were performed after cycloplegia by one trained examiner from 10:00 a.m. to 3:00 p.m. each day to minimize the influence of diurnal variation.Citation31 The spherical power, cylindrical power, AL, and cornea curvature radius were inputted into the OCT system to compensate for the magnification factors associated with AL before each OCT image collection.
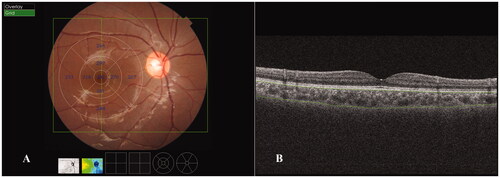
A wide three-dimensional mode consisting of 256 scan lines in a 12 mm × 9 mm scan area was adopted in the current study, and the ETDRS grid was applied in the final analysis of the ChT (). Four B-scan OCT images were obtained along each scan line and were automatically averaged using built-in software to create an averaged image. Segmentation of the choroidal layers in the OCT images and construction of topographic maps were automatically completed using built-in software. The segmentation was carefully inspected, and manual correction was performed by the same staff members as in our previous studies when the software misjudged the borderlines.Citation5 ChT was defined as the vertical distance between the Bruch’s membrane and the choroid-scleral interface ().
Figure 1. Choroidal thickness (ChT) measurements obtained using swept-source optical coherence tomography in the macular region. (A) ChT measurements in the ETDRS grid in the macular region. The mean ChT (μm) for each sector is shown in the grid. A wide three-dimensional mode, which consisted of 256 scan lines (vertical green line) in a 12 mm × 9 mm scan area (green rectangle), was adopted in the current study. (B) ChT was defined as the vertical distance between Bruch’s membrane (upper green line) and the choroid-scleral interface (lower green line).
Measurements of macular ChT with various simulated ALs
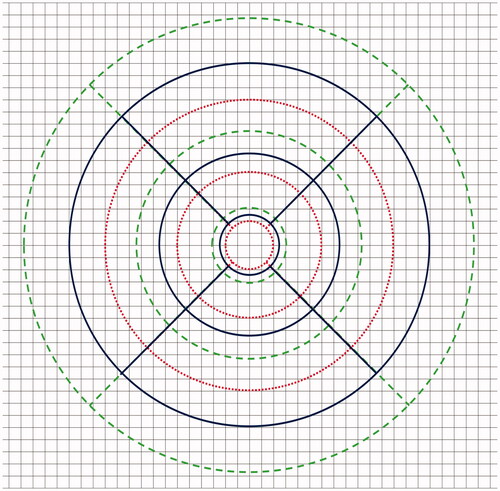
For ocular magnification correction, the real scan size was 12 mm × 9 mm, and the diameters of the inner, middle, and outer circles of the ETDRS grid were 1, 3, and 6 mm, respectively. To simulate the conditions without ocular magnification correction, we changed the size of the ETDRS grid based on Littmann’s method by simulating various scan sizes under different ALs. The range of simulated AL was set at 20.00–30.00 mm, with an interval of 0.01 mm. The size of the ETDRS grid for different simulated ALs is shown in .
Figure 2. Different sizes of the ETDRS grid for various simulated axial lengths (ALs). The blue ETDRS grid is an ETDRS grid of a standard size. The diameters of the inner circle (central foveal circle), middle circle (parafoveal circle), and outer circle (perifoveal circle) are 1, 3, and 6 mm, respectively. The red EDTRS grid represents the size of the ETDRS grid for a simulated AL of 20.00 mm, and the green ETDRS grid represents the size of the ETDRS grid for a simulated AL of 30.00 mm.
According to Littmann’s method, the relationship between a measured SS-OCT image and its actual size can be expressed as t = p × q × s, where t is the actual scan size, s is the default SS-OCT measurement, p is the magnification factor related to the OCT system, and q is the magnification factor related to AL. Given the default AL (AL = 24.39 mm) and refraction (0 diopter) of the SS-OCT system, p can be calculated as 1/[0.01306 × (24.39 − 1.82)] = 3.393 (i.e. t = s). Therefore, the actual size of the ETDRS grid under different simulated ALs can be expressed as t = 3.393 × 0.01306 × (AL − 1.82) × s.
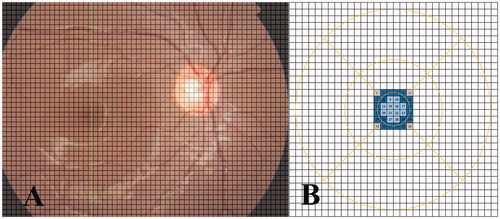
To precisely calculate the ChT in the uncorrected ETDRS grid, a 12 mm × 9 mm scan area was divided into many small cells (45 rows × 60 columns). The size of each cell was 200 μm × 200 μm, and the mean ChT of each cell was calculated automatically using the OCT software (). To calculate the mean ChT of each ETDRS sector, the weighted mean ChT of each cell inside or partially inside the sector was added together and then divided by the total area of each ETDRS sector.
Figure 3. Calculation of the choroidal thickness (ChT) in an uncorrected ETDRS grid using a self-designed program. (A) A 12 mm × 9 mm scan area is placed in a matrix form containing 45 rows and 60 columns. The scan area is divided into several tiny cells, and the size of each cell is 200 × 200 μm. The mean ChT of each cell is calculated automatically using the OCT software. (B) When assessing the central foveal sector for instance, the grids near the central foveal sector are numbered consecutively from 1 to 36. When the entire cell is outside the central foveal sector, the weighting coefficient = 0 (grid number = 1, 6, 31, 36 and are marked in grey); when the entire cell is inside the central foveal sector, the weighting coefficient = 1 (grid number = 9, 10, 14–17, 20–23, 27, 28 and are marked in light blue); when a portion of the cell is inside the central foveal sector, the weighting coefficient = the area inside the central foveal sector/the whole cell size (0 < weighting coefficient < 1, grid number = 2–5, 7, 8, 11, 12, 13, 18, 19, 24, 25, 26, 29, 30, 32–35 and are marked in dark blue). The weighted mean ChT of each cell = the mean ChT of each cell × weighting coefficient; the mean ChT of the central foveal sector = the sum of the weighted mean ChT of each cell (from 1 to 36)/the total area of the central foveal sector. The mean ChT of other ETDRS sectors are calculated using the similar method. The area of each ETDRS sector for various simulated ALs is calculated according to Littmann’s formula. The actual size of the ETDRS grid under different simulated ALs can be expressed as t = 3.393 × 0.01306 × (AL − 1.82) × s, where t is the actual scan size, s is the default SS-OCT measurement, p is the magnification factor related to the OCT system, and q is the magnification factor related to AL.
Weighted mean ChT of each cell = mean ChT of each cell × weighting coefficient, where the weighting coefficient of each cell = the area inside the sector/whole cell size (detailed calculation procedure is displayed in ). The area of each ETDRS sector for various simulated ALs was calculated according to Littmann’s formula. A self-designed program was used to complete the above work (the code is shown in the Supplementary material).
Statistical analysis
The examination data were recorded in handwritten and digital versions. An online database system was used for the real-time examination of data input, creating a digital record for each participant. The auto-refraction and choroidal thickness data were uploaded directly from the instruments to the system. Before the analysis, the output dataset from the system and the original handwritten records were checked by a staff member to exclude discrepancies. SPSS statistical software (IBM SPSS Statistics Inc., Version 22.0, IL, USA) was used to perform statistical analyses. Data distribution was examined using the Kolmogorov–Smirnov test. Intergroup differences were assessed using the Kruskal–Wallis test (Dunn–Bonferroni method for post hoc tests).
Three main analyses were conducted. First, the relationship between uncorrected ChT and simulated ALs was assessed. Second, the range of ALs requiring adjustment for ocular magnification during SS-OCT examinations was determined. Considering the axial resolution of SS-OCT, a difference larger than 8 μm between the corrected and uncorrected ChT was regarded as meaningful. The default AL (24.39 mm) was set as the baseline value. Third, given that the distribution pattern of ChT may vary according to the refractive status, a subgroup analysis was performed according to refractive status. The spherical equivalent (SE = sphere + 0.5 × cylinder) was used to categorize the refractive status. Hyperopia, emmetropia, and myopia were defined as SE ≥ + 0.5 diopter (D), −0.5 D < SE < +0.5 D, and SE ≤ −0.5 D, respectively. Statistical significance was defined as p < 0.05 (two-tailed).
Results
General characteristics of the study participants
A total of 172 children (boys, n = 96) with a mean age of 7.83 ± 0.58 years were included. The mean SE, cornea curvature radius, and AL were −0.81 ± 1.92 D (ranging from −5.75 D to 6.38 D), 7.81 ± 0.26 mm (ranging from 7.25 mm to 8.57 mm), and 23.58 ± 0.97 mm (ranging from 21.40 mm to 26.45 mm), respectively. The mean SE for the myopic, emmetropic, and hyperopic group was −1.39 ± 1.09 D (n = 117), 0.28 ± 0.47 D (n = 22), and 2.65 ± 1.77 D (n = 33), respectively. Detailed information is provided in .
Table 1. General characteristics of the study participants.
Relationship between ChT and simulated AL
As shown in , a thinner mean ChT was discovered with a longer simulated AL in most sectors except for the parafoveal temporal sector. The results of ChT measurements under different simulated axial lengths were compared with that under default axial length (i.e. AL = 24.39 mm). The difference was the most significant in the perifoveal region, followed by the parafoveal region, and was the least significant in the central foveal region. Moreover, the difference was much larger in the nasal sectors than in other sectors. In addition, the relationship between the mean ChT and the simulated AL is shown in . Linear models with high R2 values were observed in most sectors, except for the perifoveal temporal sector, which was better described by a quadratic equation model. In general, the mean ChT in the central fovea was almost constant, regardless of the various ALs, and the rangeability of the ChT was larger in the perifoveal region than in the corresponding sector in the parafoveal region. For demonstration purposes, the simulated ALs with only integer values are listed in and .
Figure 4. Relationship between mean choroidal thickness (ChT) and simulated axial length (AL). Linear models with high R2 values were observed in most sectors, except for Sector 7 (temporal sector of the perifoveal region), which was described by a quadratic equation model. The mean ChT in the central fovea was almost constant regardless of the AL, and the rangeability of ChT was larger in the perifoveal region than in the corresponding sector of the parafoveal region. I1, T1, S1, and N1 represent the inferior, temporal, superior, and nasal sectors, respectively, of the parafoveal region. I2, T2, S2, and N2 represent the inferior, temporal, superior, and nasal sectors, respectively, of the perifoveal region.
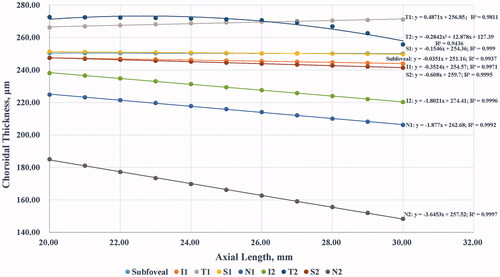
Table 2. Changes in the choroidal thickness measurements with the variation of axial length.
Extent of AL requiring adjustment for ocular magnification
We calculated the extent of simulated ALs that required adjustment for ocular magnification, which was determined by the axial resolution of the OCT device. As shown in , the extent of the mean AL (20.02–29.97 mm), without the need for adjusting the ocular magnification in the central fovea was almost equal to the full extent of the simulated AL (20.00–30.00 mm), suggesting that the effect of ocular magnification on the central foveal ChT was small. Similar results were obtained for the inferior, superior, and temporal sectors of the parafoveal region. However, in the nasal sector of the parafoveal region, the extent was smaller than that in other sectors of the parafoveal region, and the interindividual difference was much larger (), indicating that the ChT measurements were more easily affected by ocular magnification. In the perifoveal region, the problems caused by ocular magnification were more remarkable. The extent of the mean AL without the need to adjust the ocular magnification was much smaller, and the interindividual difference was much larger than the corresponding values for sectors in the parafoveal region ().
Figure 5. Box diagram showing the extent of axial length (AL) requiring adjustment for ocular magnification. The extent of the mean AL without the need to adjust ocular magnification in the central foveal region was almost equal to the full extent of the simulated AL. Similar results were obtained in the inferior, superior, and temporal sectors of the parafoveal region. However, in the nasal sector of the parafoveal region, the extent was smaller than that in the other sectors of the parafoveal region, and the interindividual difference was much larger. In the perifoveal region, the extent of the mean AL without the need to adjust ocular magnification was much smaller, and the interindividual difference was much larger than that in the corresponding sectors of the parafoveal region. I1, T1, S1, and N1 represent the inferior, temporal, superior, and nasal sectors, respectively, of the parafoveal region. I2, T2, S2, and N2 represent the inferior, temporal, superior, and nasal sectors, respectively, of the perifoveal region.
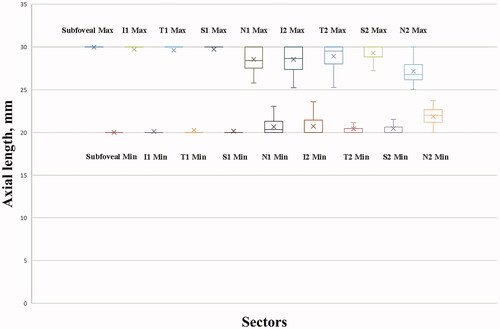
Table 3. Extent of the axial length requiring adjustment for ocular magnification.
Considering the interindividual differences, we further determined the extent of AL, which may include 95% of the individuals. The fifth percentile for the upper limit and the 95th percentile for the lower limit were calculated (). The ChT measurements were not affected by all simulated ALs in 95% of the individuals in the central fovea. In the inferior, superior, and temporal sectors of the parafoveal region, the extent of AL that may include 95% of the individuals narrowed from approximately 22.0 mm to 27.2 mm. In the nasal sector of the parafoveal region and the inferior, superior, and temporal sectors of the perifoveal region, the extent of AL that may include 95% of the individuals became even narrower, from approximately 22.8 mm to 26.0 mm. The narrowest extent was observed in the nasal sector of the perifoveal region, from 23.3 mm to 25.5 mm.
Subgroup analysis for individuals with different refractive statuses
We compared the extent of simulated ALs without the need to adjust ocular magnification among the various refractive statuses. As shown in , significant differences were observed among the three refractive groups for the upper and lower limits in the inferior sector of the parafoveal region (p = 0.041 and p < 0.001) and in the temporal (p < 0.001 and p = 0.001), superior (p = 0.018 and p = 0.001), and nasal (p < 0.001 and p < 0.001) sectors of the perifoveal region. Furthermore, post hoc analyses indicated that the extent of simulated ALs without the need for ocular magnification correction in these sectors was larger in myopes than in hyperopes (all p < 0.05), while the difference between myopes and emmetropes was negligible.
Table 4. Subgroup analysis of the individuals with different refractive statuses.
Discussion
In the current study, we assessed the relations between macular ChT measurements and ocular magnification by using a self-designed mathematical model. The main idea of the model was to divide the scan area into numerous small cells and then combine these cells into the shape of the ETDRS grid. Considering the cell size and continuity of choroidal tissue, the ChT within one cell can be regarded as uniformly distributed. Therefore, an ETDRS grid of any size can be calculated using this differential method. As discovered by our study, ChT measurements may appear thinner with the elongation of simulated ALs in most sectors, except the parafoveal temporal sector. ChT measurements were least affected by ocular magnification in the central fovea, whereas the perifoveal nasal sector was the most dramatically affected. Moreover, the effect of ocular magnification was more significant in hyperopes than in myopes in the inferior sector of the parafoveal region, and in the temporal, superior, and nasal sectors of the perifoveal region.
According to previous studies, ocular magnification is a well-explored issue in the measurement of cpRNFL thickness, and most studies suggest that correction of ocular magnification in eyes with extremely long or short ALs is necessary.Citation15–23 According to one study, the cut-off values for correcting ocular magnification during cpRNFL thickness measurements were set as ALs shorter than 23.60 mm and longer than 25.55 mm, respectively.Citation23 In recent years, the impact of ocular magnification on the measurements of macular retinal layers has also been reported, but the cut-off value has not been fully demonstrated.Citation24–27 Our study is the first to propose a range of AL requiring adjustment for ocular magnification in macular ChT measurements. Differences were observed between the measurements of cpRNFL thickness and macular ChT, indicating that the extent of ALs requiring correction for ocular magnification was closely associated with the location and distribution pattern of each fundus tissue. To confirm this, all fundus layers should be compared together in the same population with a large sample size and various AL distributions using the same OCT equipment and measurement mode.
Based on these findings, the extent of ALs requiring adjustment for ocular magnification, which is relevant to the selected area and refractive status, was determined. In the central fovea, the change in the ChT was small in most individuals (less than 1 μm in various sizes), and the effect of ocular magnification can be neglected. However, with changes in the ChT and interindividual differences in the peripheral area, ocular magnification should be assessed in detail. The effect of ocular magnification on the superior and inferior sectors was slightly smaller for the parafoveal region than that on the temporal sector. This may be explained by the thicker choroid and larger change rate of ChT in the temporal sector of the parafoveal region. For the perifoveal region, the effect of ocular magnification on the inferior sector was greater than that on the temporal and superior sectors. This may be due to the significant thinning of the choroid in the inferior peripheral region, which is closely associated with the development pattern of the eyes, as the optic fissure is located inferiorly and is the last part to close during ocular development.Citation32 For the nasal sectors in the parafoveal and perifoveal regions, the effect of ocular magnification was much greater than that on the corresponding sectors in other areas, which was caused by a sharp decrease in ChT toward the optic disc. For highly myopic eyes with peripapillary diffuse chorioretinal atrophy, where the choroid becomes sharply thin in the peripapillary region, the effect of ocular magnification may be even greater in the nasal sector.
In addition to location, refractive status may also influence the extent of ALs requiring adjustment for ocular magnification. As calculated above, the extent of simulated ALs with no need for ocular magnification correction was larger in myopes than in hyperopes, at least in some sectors. This may be due to the choroidal thinning in children with myopia. According to our previous study, the difference in ChT among the central foveal, parafoveal, and perifoveal regions was more significant in hyperopes than in myopes, suggesting that the change rate of ChT from the central area to the peripheral area was smaller in myopes than in hyperopes.Citation5 As the threshold for ocular magnification correction for all individuals was set to 8 μm, which was determined by the axial resolution of SS-OCT, more areas should be included in myopic children with thinner choroids to reach the threshold. However, this conclusion may not be applicable to eyes with pathological myopia as the choroid may undergo drastic changes in areas with severe lesions.
Our study had several limitations. First, only the AL was considered in our mathematical model, whereas the corneal radius was not, which could have caused a slight difference. Nevertheless, previous studies have reported that the effect of corneal radius on ocular magnification is small.Citation13,Citation29 Additionally, eyes with an extremely high degree of myopia and pathological changes were excluded. ChTs may become extremely thin and snatchy in eyes with severe pathological myopia. This influencing factor was not included; thus, our conclusions might not be applicable to these pathological cases. To solve this issue, more children with higher degrees of myopia should be included in future studies, and a sophisticated mathematical model that includes more influencing factors is expected in the future. Moreover, as this study included only young Chinese children, the results may not be applicable to children of other ethnicities and age groups.
In conclusion, our study quantitatively evaluated the relationship between ocular magnification and macular ChT measurements in a pediatric population using a new mathematical model. Generally, the effect of ocular magnification is more significant in the peripheral region than in the central region, and more significant in hyperopes than in myopes. The central foveal region was the least affected. Ocular magnification may be neglected in the vast majority of cases, while the nasal sector of the perifoveal region was the most dramatically affected; thus, ocular magnification should be corrected normally. The effect of ocular magnification was negligible in children with AL of 22.8–26.0 mm in the remaining sectors, and this accounted for the majority of the cases in this age group. In future studies, more children with higher degrees of myopia should be included, and the findings should be confirmed and extended to a larger population.
Supplemental Material
Download PDF (311.5 KB)Disclosure statement
The sponsor or funding organization had no role in the design or conduct of this research. No potential conflict of interest was reported by the author(s).
Data availability statement
The data that support the findings of this study are available from the corresponding author, Xiangui He, upon reasonable request.
Additional information
Funding
References
- Fang Y, Du R, Nagaoka N, Yokoi T, Shinohara K, Xu X, Takahashi H, Onishi Y, Yoshida T, Ohno-Matsui K. OCT-based diagnostic criteria for different stages of myopic maculopathy. Ophthalmology. 2019;126(7):1018–1032. doi:10.1016/j.ophtha.2019.01.012.
- Yokoi T, Zhu D, Bi HS, Jonas JB, Jonas RA, Nagaoka N, Moriyama M, Yoshida T, Ohno-Matsui K. Parapapillary diffuse choroidal atrophy in children is associated with extreme thinning of parapapillary choroid. Invest Ophthalmol Vis Sci. 2017;58(2):901–906. doi:10.1167/iovs.16-20652.
- Ikuno Y, Kawaguchi K, Nouchi T, Yasuno Y. Choroidal thickness in healthy Japanese subjects. Invest Ophthalmol Vis Sci. 2010;51(4):2173–2176. doi:10.1167/iovs.09-4383.
- Xiong S, He X, Deng J, Lv M, Jin J, Sun S, Yao C, Zhu J, Zou H, Xu X. Choroidal thickness in 3001 Chinese children aged 6 to 19 years using swept-source OCT. Sci Rep. 2017;7:45059. doi:10.1038/srep45059.
- Deng J, Li X, Jin J, Zhang B, Zhu J, Zou H, Xu X, Xie J, Wang L, Zhu S, et al. Distribution pattern of choroidal thickness at the posterior pole in Chinese children with myopia. Invest Ophthalmol Vis Sci. 2018;59(3):1577–1586. doi:10.1167/iovs.17-22748.
- Xiong S, He X, Zhang B, Deng J, Wang J, Lv M, Zhu J, Zou H, Xu X. Changes in choroidal thickness varied by age and refraction in children and adolescents: a 1-year longitudinal study. Am J Ophthalmol. 2020;213:46–56. doi:10.1016/j.ajo.2020.01.003.
- He XG, Deng JJ, Yin Y, Zhang B, Xiong SY, Zhu JF, Zou HD, Xu X, Wang L. Macular choroidal thickness in Chinese preschool children: decrease with axial length but no evident change with age. Int J Ophthalmol. 2019;12(9):1465–1473. doi:10.18240/ijo.2019.09.15.
- Nagasawa T, Mitamura Y, Katome T, Shinomiya K, Naito T, Nagasato D, Shimizu Y, Tabuchi H, Kiuchi Y. Macular choroidal thickness and volume in healthy pediatric individuals measured by swept-source optical coherence tomography. Invest Ophthalmol Vis Sci. 2013;54(10):7068–7074. doi:10.1167/iovs.13-12350.
- Dawczynski J, Gebhardt M, Mohr T, Koschmieder I, Rassow B, Schubert AK, Strobel J. Determination of absolute size of fundus objects. Graefes Arch Clin Exp Ophthalmol. 2011;249(3):381–387. doi:10.1007/s00417-010-1498-3.
- Garway-Heath DF, Rudnicka AR, Lowe T, Foster PJ, Fitzke FW, Hitchings RA. Measurement of optic disc size: equivalence of methods to correct for ocular magnification. Br J Ophthalmol. 1998;82(6):643–649. doi:10.1136/bjo.82.6.643.
- Sanchez-Cano A, Baraibar B, Pablo LE, Honrubia FM. Magnification characteristics of the Optical Coherence Tomograph STRATUS OCT 3000. Ophthalmic Physiol Opt. 2008;28(1):21–28. doi:10.1111/j.1475-1313.2007.00527.x.
- Nowroozizadeh S, Cirineo N, Amini N, Knipping S, Chang T, Chou T, Caprioli J, Nouri-Mahdavi K. Influence of correction of ocular magnification on spectral-domain OCT retinal nerve fiber layer measurement variability and performance. Invest Ophthalmol Vis Sci. 2014;55(6):3439–3446. doi:10.1167/iovs.14-13880.
- Hirasawa K, Shoji N. Influence of corneal power on circumpapillary retinal nerve fiber layer and optic nerve head measurements by spectral-domain optical coherence tomography. Int J Ophthalmol. 2017;10(9):1385–1391.
- Bengtsson B, Krakau CE. Correction of optic disc measurements on fundus photographs. Graefes Arch Clin Exp Ophthalmol. 1992;230(1):24–28. doi:10.1007/BF00166758.
- Bayraktar S, Bayraktar Z, Yilmaz OF. Influence of scan radius correction for ocular magnification and relationship between scan radius with retinal nerve fiber layer thickness measured by optical coherence tomography. J Glaucoma. 2001;10:163–169.
- Kang SH, Hong SW, Im SK, Lee SH, Ahn MD. Effect of myopia on the thickness of the retinal nerve fiber layer measured by Cirrus HD optical coherence tomography. Invest Ophthalmol Vis Sci. 2010;51(8):4075–4083. doi:10.1167/iovs.09-4737.
- Leung CK-S, Cheng ACK, Chong KKL, Leung KS, Mohamed S, Lau CSL, Cheung CYL, Chu GC-H, Lai RYK, Pang CCP, et al. Optic disc measurements in myopia with optical coherence tomography and confocal scanning laser ophthalmoscopy. Invest Ophthalmol Vis Sci. 2007;48(7):3178–3183. doi:10.1167/iovs.06-1315.
- Savini G, Barboni P, Parisi V, Carbonelli M. The influence of axial length on retinal nerve fibre layer thickness and optic-disc size measurements by spectral-domain OCT. Br J Ophthalmol. 2012;96(1):57–61. doi:10.1136/bjo.2010.196782.
- Huang D, Chopra V, Lu AT, Tan O, Francis B, Varma R. Does optic nerve head size variation affect circumpapillary retinal nerve fiber layer thickness measurement by optical coherence tomography? Invest Ophthalmol Vis Sci. 2012;53(8):4990–4997. doi:10.1167/iovs.11-8214.
- Öner V, Taş M, Türkcü FM, Alakuş MF, Işcan Y, Yazıcı AT. Evaluation of peripapillary retinal nerve fiber layer thickness of myopic and hyperopic patients: a controlled study by Stratus optical coherence tomography. Curr Eye Res. 2013;38(1):102–107. doi:10.3109/02713683.2012.715714.
- Öner V, Aykut V, Taş M, Alakuş MF, İşcan Y. Effect of refractive status on peripapillary retinal nerve fibre layer thickness: a study by RTVue spectral domain optical coherence tomography. Br J Ophthalmol. 2013;97(1):75–79. doi:10.1136/bjophthalmol-2012-301865.
- Wang M, Elze T, Li D, Baniasadi N, Wirkner K, Kirsten T, Thiery J, Loeffler M, Engel C, Rauscher FG. Age, ocular magnification, and circumpapillary retinal nerve fiber layer thickness. J Biomed Opt. 2017;22(12):1–19. doi:10.1117/1.JBO.22.12.121718.
- Hirasawa K, Shoji N, Yoshii Y, Haraguchi S. Determination of axial length requiring adjustment of measured circumpapillary retinal nerve fiber layer thickness for ocular magnification. PLoS One. 2014;9(9):e107553. doi:10.1371/journal.pone.0107553.
- Wang XY, Huynh SC, Burlutsky G, Ip J, Stapleton F, Mitchell P. Reproducibility of and effect of magnification on optical coherence tomography measurements in children. Am J Ophthalmol. 2007;143(3):484–488.e2. doi:10.1016/j.ajo.2006.11.042.
- Mwanza J-C, Durbin MK, Budenz DL, Girkin CA, Leung CK, Liebmann JM, Peace JH, Werner JS, Wollstein G. Profile and predictors of normal ganglion cell-inner plexiform layer thickness measured with frequency-domain optical coherence tomography. Invest Ophthalmol Vis Sci. 2011;52(11):7872–7879. doi:10.1167/iovs.11-7896.
- Francisconi CLM, Wagner MB, Ribeiro RVP, Freitas AM. Effects of axial length on retinal nerve fiber layer and macular ganglion cell-inner plexiform layer measured by spectral-domain OCT. Arq Bras Oftalmol. 2020;83(4):269–276.
- Parthasarathy MK, Bhende M. Effect of ocular magnification on macular measurements made using spectral domain optical coherence tomography. Indian J Ophthalmol. 2015;63(5):427–431. doi:10.4103/0301-4738.159877.
- Littmann H. Determination of the real size of an object on the fundus of the living eye. Klin Monbl Augenheilkd. 1982;180(4):286–289. doi:10.1055/s-2008-1055068.
- Bennett AG, Rudnicka AR, Edgar DF. Improvements on Littmann’s method of determining the size of retinal features by fundus photography. Graefes Arch Clin Exp Ophthalmol. 1994;232(6):361–367. doi:10.1007/BF00175988.
- Hirasawa K, Shoji N, Yoshii Y, Haraguchi S. Comparison of Kang’s and Littmann’s methods of correction for ocular magnification in circumpapillary retinal nerve fiber layer measurement. Invest Ophthalmol Vis Sci. 2014;55(12):8353–8358. doi:10.1167/iovs.14-15720.
- Tan CS, Ouyang Y, Ruiz H, Sadda SR. Diurnal variation of choroidal thickness in normal, healthy subjects measured by spectral domain optical coherence tomography. Invest Ophthalmol Vis Sci. 2012;53(1):261–266. doi:10.1167/iovs.11-8782.
- Schoenwolf G, Bleyl S, Brauer P, Francis-West P. Larsen’s human embryology. 2009.