
Abstract
Purpose
Patients with cystic fibrosis (CF) are at risk to develop CF related diabetes (CFRD) and subsequently even diabetic neuro- and/or vasculopathy. We sought to determine if there are typical signs of diabetes-related retinal alterations present in CF patients with preserved and impaired glycemic control.
Methods
During routine annual examination CF patients were offered an additional 7-day period of real time continuous glucose monitoring (rtCGM) and an ophthalmological examination including retinal optical coherence tomography (OCT). Patients were categorized according to the glycemic control, i.e. the results of an oral glucose tolerance test (OGTT) and rtCGM were taken into consideration. OCT data was analyzed by our previously published visual analysis software generating dedicated and spatially resolved deviation maps for visualization and quantification of differences in total retinal thickness and thickness of retinal nerve fiber layer (RNFL) as well as ganglion cell layer (GCL) in comparison to age-matched healthy controls and patients with either type 1 or type 2 diabetes mellitus.
Results
Results of the rtCGM and/or OGTT enabled discrimination between patients with normal glycemic control (CFNG; n = 6), with abnormal glycemic control (CFAG; n = 6) and overt CFRD (n = 4). OCT data indicates gradually increasing retinal thinning in all 3 groups, depending on the degree of glucose metabolism disorder compared to healthy controls. At the foveal region total retinal thickness and GCL thickness were significantly thinner in CFRD patients compared to CFNG patients (total retinal thickness: 260.4 µm (239.3–270.8) vs. 275.4 µm (254.3–289.5); GCL: 11.82 µm (11.16–15.25) vs. 17.30 µm (13.95–19.82); each p < 0.05).
Conclusion
Although we investigated a rather small number of patients, we obtained evidence that intraretinal neurodegenerative changes occur in each of our subgroups (CFNG, CFAG, CFRD). Beyond this, our results favor the detrimental role of additional diabetes, as the deviations from healthy controls were most pronounced in the CFRD group and are similar to those seen in patients suffering from type 1 or type 2 diabetes.
Introduction
Cystic fibrosis (CF) is an autosomal recessive disease caused by mutations of the cystic fibrosis transmembrane conductance regulator gene (CFTR). Clinical features of the disease include recurrent pulmonary infections with progressive decline in lung function and pancreatic insufficiency in up-to 85% of patients.Citation1,Citation2
In addition to the improvements related to screening and general management of the symptoms, the introduction of CFTR modulators like ivacaftor in 2012 and subsequent modifications to counteract the mutation-related dysfunction of the CFTR gene more specifically have seriously improved life expectancy of patients with CF.Citation3 Despite, chronically ill children in general and CF patients in particular are at risk to experience disease and/or aging related comorbidities already at young age.Citation4 Due to progressive pancreatic insufficiency cystic fibrosis related diabetes (CFRD) has become the most frequently seen comorbidity affecting 2% in childhood, 20% in adolescence and up to 50% of adult CF patients.Citation5 CFRD is characterized by a reduced and delayed insulin response to carbohydrates with frequently normal fasting glucose and postprandial hyperglycemia, which makes the pathophysiology different from the one of type 1 and type 2 diabetes mellitus (T1DM, T2DM). CFRD has been related to accelerated progression of pulmonary insufficiencyCitation5 and weight lossCitation6 which contribute to an increased mortality in young adults.Citation7
Dysglycemia in CF starts early in life, but it usually takes several years before clinically relevant symptoms, i.e. polyuria or polydipsia, occur and insulin substitution is required for normoglycemia.Citation8–11 According to current guidelines an oral glucose tolerance test (OGTT) is part of the annual routine examination for all patients being at least 10 years of age.Citation12,Citation13
Although an OGTT is a well-established procedure for diagnosis of a clinically relevant impairment of glucose metabolism, it might not be sufficient to detect mild dysglycemia, especially in CF patients. Therefore, the use of real-time continuous glucose monitoring (rtCGM) as a powerful tool for the detection of abnormal glycemic control has been suggested,Citation8,Citation14–17 has been validated for more than one decadeCitation18 and its practical use is nowadays discussed.Citation19
Several case reports and few studies indicate, that CFRD-patients are at risk to develop some of the “classical” complications related to diabetes, e.g. diabetic retinopathy, microalbuminuria and signs of mild neuropathy.Citation20–29 It has been suggested that CF may contribute to peripheral nerve disease even before manifestation of CFRD.Citation30–32 Beyond nerve conduction studies, sensory examination and application of either the neuropathy symptom or neuropathy deficient score, optical coherence tomography (OCT) of the macula was established as an effective tool for the non-invasive detection of neurodegenerative changes.Citation33,Citation34 Recently, we used OCT to quantify total retinal thickness and the thickness of intraretinal layers in healthy controls as well as in cohorts of pediatric T1DM and adult T2DM patients.Citation34–36 This approach revealed subtle but significant thinning of distinct retinal layers in T1DM patients already at young age compared to healthy controls, i.e. when the impact of life style and comorbidities are neglectable.Citation35,Citation36 Such alterations may precede clinically to diabetic neuropathy and/or neurovascular changes and therefore need to be adequately addressed. Similarly, significant thinning of the retinal nerve fiber layer (RNFL) and ganglion cell layer (GCL) compared to healthy controls were detected in adults with T2DM and clinically proven diabetic neuropathy.Citation34 Based on these findings, we sought to investigate retinal thickness in patients with CF with and without clinically proven CFRD or abnormal glucose tolerance and thus extended our routine annual examination accordingly.
Research design and methods
Study design
Approval of the Ethics Committee of the University of Rostock in accordance with applicable laws, rules, and regulations was obtained (A 2019-0049) and routine annual examinations were extended in accordance with the declaration of Helsinki. Informed consent was obtained from all subjects involved in the study. Thereby, this is a single-center prospective observational study.
Inclusion criteria
All patients suffering from CF, being at least 10 years old, being treated at our outpatient clinic and having their routine annual examination between February 2020 and June 2021 were eligible and invited to participate. The annual examination regularly comprises a physical examination and assessment of clinical status including a pulmonary function test, a psychological evaluation, a blood draw and an OGTT. This panel was extended by a 7-day period of rtCGM and an ophthalmological examination (see below).
Exclusion criteria
Chronic autoinflammatory/autoimmunological disease (e.g. Crohn’s disease, rheumatoid arthritis), hepatitis, HIV or other chronic-infectious diseases, systemic glucocorticoid treatment, oncological disease during the last 5 years, neurological or known ophthalmological disease (except myopia) secondary to non-diabetic conditions, panuveitis, epiretinal membrane, macular hole, high myopia (< −6.0 D and >26 mm) and age related macular degeneration ophthalmological surgery during 6 months prior to the enrollment or unwillingness to participate. All participants and/or their parents gave written and informed consent to use rtCGM for a 7-day period and to undergo ophthalmological examination.
Methods
Body weight, height, blood pressure (Dinamap 1846SX; Critikon, Tampa, USA) and pulmonary function (MasterScreen Body, JaegerTM, CareFusion, Germany) were assessed and individual age- and sex-related standard deviation scores (Z-scores) were calculated as recommended.Citation37,Citation38 Forced expiratory volume in 1s (FEV1) and forced vital capacity (FVC) values were calculated as percentage of the predicted (pp) values using the GLI reference equations of 2012.Citation39
History of disease, additional clinical and demographic data (e.g. genotype, duration of disease, current and previous medication) as well as the results of routine laboratory work-up including HbA1c levels were gathered by interview or chart review, respectively.
Glucose tolerance test and continuous glucose monitoring
As part of the regular annual examination patients without previously diagnosed CFRD underwent an OGTT according to the WHO recommendation. The first blood sample was drawn after a minimum of an 8 h fasting period. Subsequently, 250–300 ml water containing 1.75 g (9.7 mmol) glucose per kilogram body weight (maximum 75 g) were administered orally within 5 min. Blood samples for assessment of the glucose concentration were taken 60 and 120 min afterwards. Results of the test were deemed normal, when fasting blood glucose was below 7 mmol/l and the glucose concentration 60 and 120 min after glucose ingestion was below 11.1 and 7.8 mmol/l, respectively. In case of the glucose concentration at 60 min after ingestion exceeded a concentration of 11.1 mmol/l while the concentrations at baseline and after 120 min were as stated above, the result was labeled as “indeterminate glycemia.” An impaired glucose tolerance has to be considered in patients having blood glucose levels between 7.8 and 11.1 mmol/l, respectively, 120 min after the glucose challenge. For diagnosis of CFRD, either the fasting glucose has to be greater than 7 mmol/l and/or the concentration at 120 min equals to 11.1 mmol/l or above.Citation40
After all routine examinations including the OGTT were completed, patients were equipped with a rtCGM system consisting of sensor, transmitter and receiver (rtCGM Dexcom G6, Dexcom, Inc., USA) recording the glucose concentration every 5 min (288 times per day). None of the patients enrolled in this study had used rtCGM before. The sensor was placed subcutaneously by a trained physician and the rtCGM system was started during their stay at the outpatient clinic. After 7 days of rtCGM the sensor was removed by the patient. Hardware was sent back to our outpatient clinic. In house, data was transferred to Dexcom CLARITY® (Dexcom CLARITY Reporting Software v3.26.2 – v3.36.4, USA) to highlight glucose patterns.
Assessment of glycemic control
Data from the first and last day of rtCGM were excluded from the analyses to ensure comparable data acquisition for all patients i.e. data from 5 consecutive days was evaluated and (i) the overall mean of glucose concentration (cgluc) together with the standard deviation (SD) and coefficient of variation (CV), (ii) the mean of the daily differences (MODD), and (iii) the mean of glycemic excursion (MAGE) were calculated as described previously.Citation41
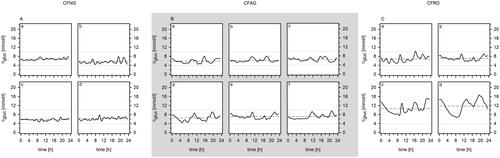
The results of the OGTT and rtCGM were used for categorizing the patients. In particular, we discriminated CF patients with normal glycemic control (CFNG), CF patients with abnormal glycemic control (CFAG) and CF patients with CF-related diabetes (CFRD) as recently suggested.Citation19 Briefly, CF patients with a physiological response to the OGTT and preserved glycemic control during rtCGM were classified as CFNG. Patients categorized as CFAG showed indeterminate glycemia, impaired glucose tolerance and/or an increased glycemic variability during rtCGM ().
Figure 1. Averaged glucose concentration trend over 5 days presented per patient and sorted by groups (A = CFNG, B = CFAG, C = CFRD). Overall mean glucose concentration (- - -) and the target range (3.9–10.0 mmol/l; …) are given as well.
Ophthalmological status and anterior as well posterior segment imaging
All patients received a complete ophthalmological examination of both eyes, i.e. determination of best corrected distance visual acuity (BCVA, measured in decimal and converted to the Logarithm of Minimum Angle of Resolution (logMAR)), intraocular pressure (ICare tonometer, Icare Finland Oy, Finland), slit-lamp examination including a funduscopy without mydriasis (BM 900 Haag Streit, Möller-Wedel Optical GmbH, Germany).
In particular, slit-lamp examination was used to check for morphological changes related to long-lasting hyperglycemia, e.g. diabetic corneal alterations, neovascularization of the iris (rubeosis iridis) and presenile cataract. Indirect ophthalmoscopy was applied to seek for any signs of non-proliferative or proliferative diabetic retinopathy, i.e. vascular abnormalities including microaneurysms, occluded vessels, and dilated or tortuous vessels, intraretinal hemorrhages, nerve-fiber layer infarcts (cotton wool spots), hard exudates, intraretinal microvascular anomalies (IRMA), preretinal hemorrhage, vitreous bleeding, neovascularization at disc or elsewhere, and diabetic maculopathy (retinal edema, hard exudates, microaneurysms and ischaemia in the macular area). The examination was performed by the same experienced ophthalmologist throughout the study.
Additionally, patients underwent corneal densitometry with a Scheimpflug system (Pentacam HD, Oculus Optikgeräte GmbH, Germany) and assessment of the autofluorescence of the lens (ClearPath DS-120® biomicroscope, Freedom Meditech, USA).Citation42,Citation43
Macular imaging (fundus imaging) was performed using a dedicated device combining OCT and scanning laser ophthalmoscopy (SPECTRALIS, Heidelberg Engineering GmbH, Germany). A high-quality 3D scan was selected by an experienced ophthalmologist and analyzed according to the previously described procedures.Citation34–36 Briefly, the volume scan was sized to cover a rectangular area, centered on the fovea and included at least 49 consecutive cross-sectional B-scans (512 A-scans each in at least a 20° × 20° field of view). For each examination it was taken care that the size of the volume covered approximately the area for the commonly used early treatment diabetic retinopathy study (ETDRS) grid.Citation44 The OCT device software (Heidelberg Eye Explorer®, HEYEX version 6.5, Heidelberg Engineering GmbH, Heidelberg, Germany) was used for automated retinal layer segmentation. Visible errors in the resulting segmentation lines were manually corrected on all scans where possible. All other areas in which layer segmentation failed were excluded from further data analysis. Image registration was then performed on the segmented volume data, and the thickness of retinal layers was analyzed by application of an in-house developed visual analysis software.Citation36,Citation45,Citation46 As a result, deviation maps were generated to visualize and quantify locally resolved thickness differences between selected data sets. ETDRS grids were overlaid on the deviation maps to locate anatomically distinct areas of the central retina, including three rings (central foveal ring (C), parafoveal ring, perifoveal ring) and corresponding cells in four quadrants (inferior parafoveal cell (II), inferior perifoveal cell (IO), nasal parafoveal cell (NI), nasal perifoveal cell (NO), superior parafoveal cell (SI), superior perifoveal cell (SO), temporal parafoveal cell (TI), temporal perifoveal cell (TO)).
Per patient OCT data was compared to each of three previously investigated cohorts.Citation34–36 In particular, a group of age-matched healthy controls (26 children (13 males) and 25 adults (8 males) aged 31.8 ± 17.9 years (mean ± SD), a group of 26 pediatric T1DM patients (16 males) aged 14.3 ± 2.43 years with a mean duration of T1DM of 5.6 ± 4.2 years and a group of 33 adult T2DM patients (21 males) aged 60.3 ± 11.9 years and a mean duration of T2DM of 13.3 ± 8.8 years. Beyond this, we did a groupwise comparison with these cohorts after categorizing CF-patients according to their glycemic control, i.e. CFNG, CFAG and CFRD.Citation19
Statistical analysis
Clinical data from all examinations was summarized and processed in a dedicated spreadsheet (Microsoft® Excel Version 16.6, Microsoft Corporation, USA) for visualization and statistical evaluation using Sigma Plot 13 (Systat Software GmbH, Germany) and SPSS Software package version 27 (SPSS GmbH, Germany).
From the 7-day period of CGM, 5 × 288 values were extracted and sorted by 24-hour intervals for calculating of individual mean glucose concentration, standard deviation, coefficient of variation as well as MODD and MAGE.Citation41 For ophthalmological evaluations data obtained from the patients’ right eyes were used in all cases.
Due to the low number of individuals all data is given in median and range. Non-parametric tests (Kruskal–Wallis test, Mann–Whitney U test) were applied for comparison between groups. Correlations between continuous variables were made using Spearman rank correlation coefficients. All p-values are two-sided and a p-value below 0.05 was considered significant.
Results
During the 18-months study period a total of 16 patients (7 males and 9 females) out of 26 CF patients fulfilling the inclusion criteria consented to underwent the additional rtCGM and ophthalmological examination. An overview of the anthropometric and clinical data of the participants is given in . At time of the study examinations, CFTR modulators were used by five patients, one patient paused CFTR modulators and 10 patients received conventional CF therapy.
Table 1. Clinical and demographic data of patients.
A subgroup of four patients had CFRD diagnosed two, six, eight and 17 years prior to enrollment in the study and therefore did not underwent an OGTT. All of these patients received insulin therapy. In contrast, rtCGM was used as intended by all except in two patients who reported intolerance to the sensor and terminated the observation period accordingly. Both of them had a normal OGTT.
Glucose tolerance test and real time continuous glucose monitoring
Results for OGTT and rtCGM are presented in and . In particular, rtCGM results of the 5-day investigation period were used to generate one graph per patient. Furthermore, we calculated the overall mean and standard deviation of the glucose concentration from the data recorded during the 5-day interval for every patient. While the OGTT revealed normal glycemic control in six out of 12 patients, results were inconclusive in four patients, i.e. the glucose concentration determined 60 and 120 min after glucose ingestion was below 11.1 mmol/l but well above 7.8 mmol/l. In these patients, rtCGM data revealed a considerably higher coefficient of variation compared to patients with preserved glycemic control. Thus, we feel confident, to categorize them as CFAG as well.
Table 2. Glucose data according to diabetic stage.
However, anthropometric and clinical characteristics including pulmonary function was fairly comparable between groups.
Ophthalmological examination
In all cases, differences regarding BCVA, intraocular pressure and morphological changes between right and left eye were not significant. The mean BCVA was 0 (range 0–0.1) logMAR. The median IOP was 15 (range 10–24) mmHg and none of the patients was previously diagnosed with glaucoma. Indirect ophthalmoscopy did not reveal any signs of non-proliferative or proliferative diabetic retinopathy in one hundred percent of eyes. Diabetic maculopathy could also not be detected by funduscopy in any one of the included eyes.
Corneal density measured by dedicated Scheimpflug imaging technique was almost the same in all participants (data not shown). The autofluorescence ratio of the lens tended to increase from CFNG to CFRD, respectively (CFNG: median 0.09; range 0.08–0.19), CFAG (median 0.15; range 0.12–0.24) and CFRD (median 0.21; range 0.13–0.28). However, autofluorescence of the lens was effectively not related to any of the parameters used to describe glycemic variability.
Thickness of retinal layers as investigated by OCT
The thickness of the retina as well as the one of the retinal nerve fiber layers (RNFL) and ganglion cell layer (GCL) were determined and deviation maps were calculated in order to visualize differences compared to age-matched healthy controls (), patients with T1DM () and patients with T2DM (). The total retinal thickness and the thickness of the RNFL and the GCL for the central foveal, parafoveal and perifoveal rings for CF-patients are given in , while corresponding data obtained in healthy controls and patients with either T1DM or T2DM are given in . Furthermore, the foveal thickness of both, the RNFL and the GCL each showed a significant negative association with MODD and MAGE, respectively ().
Figure 2. Deviation maps for visualization of total retinal thickness together with the thickness of the RNFL and GCL in CFNG, CFAG and CFRD patients relative to those in healthy controls (A), age-matched patients with T1DM (B), age-matched patients with T2DM (C) and the color scale (D). Deviation maps were computed to highlight thinning (blue) and thickening (red) of the retina the RNFL and the GCL. The brightness of the color encodes the degree of deviation, with the darkest colors representing values below or above the interval between the 2.5th and 97.5th percentiles of the respective reference group. Areas of statistically significant differences (p < 0.05) are highlighted (black outline). Maps with ETDRS grid cells covered by at least 10% of areas with significant difference are indicated (a–h).
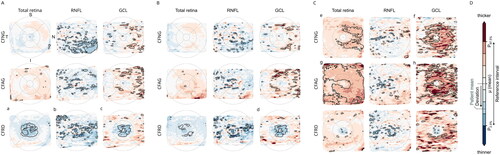
Table 3. OCT data according to diabetic stage.
Table 4. OCT data obtained in groups of healthy controls as well as in patients with T1DM or T2DM.
Table 5. Significant correlations between rtCGM and foveal thickness of RNFL and GCL.
The deviation map based on the comparison of CF patients and controls () revealed that for the retinal thickness the deviation from controls increases in parallel to the impairment of glycemic control, i.e. in patients with CFNG, CFAG and CFRD, respectively. This is illustrated by the greater number and size of colored areas (thickening: red, thinning: blue) representing statistically significant differences (p < 0.05, black outlines) between controls and either CFAG or CFRD, while the maps for CFNG have more neutrally colored areas (white) and fewer areas with statistically significant differences. The maps for the RNFL showed scattered areas of statistically significant thinning in all patient groups, which were slightly more pronounced in CFNG and CFRD. Deviations from healthy controls were most pronounced at the areas of the parafoveal ring in CFRD patients (, bottom row). For CFRD patients, the mean absolute deviation of the total retinal thickness (), the thickness of the RNFL () and the GCL () from healthy controls for the corresponding ETDRS grid cells covered by at least 10% with statistically significant differences are:
C (−25.42 µm), II (−14.47 µm), NI (−14.52 µm), SI (−14.87 µm), TI (−15.27 µm)
C (−3.57 µm)
C (−6.41 µm), II (−7.58 µm), NI (−8.12 µm)
The comparison of CF patients and T1DM patients () resulted in a pattern similar to the one presented above, i.e. retinal layers in CF patients are thinner in a statistically significant proportion of areas than those in healthy controls () or T1DM patients. However, the differences in retinal thickness between patients suffering from CF and T1DM were less pronounced. Again, the deviations were most prominent in the areas of the parafoveal ring (). Although, only the ganglion cell layer exhibited ETDRS grid cells covered with at least 10% significant differences. The corresponding mean absolute deviation values are:
C (−6.19 µm), II (−6.42 µm), NI (−7.87 µm)
The deviation map calculated with data from CF patients and those with T2DM revealed thickening rather than thinning of the retinal layers (). Especially, the total retinal thickness and GCL thickness were higher in patients categorized as CFNG or CFAG compared to those suffering from T2DM (see highlighted red areas in , e–h). The associated areas with statistically significant differences included both the parafoveal and perifoveal rings. In contrast, the thickness differences of the same layers were less pronounced in patients with CFRD. The maps for the retinal nerve fiber layer showed scattered areas of statistically significant thinning that were similar in all patient groups. The mean absolute deviation values of the ETDRS grid cells covered with at least 10% significant differences for this comparison are:
II (+17.09 µm), NO (+19.45 µm)
II (+7.45 µm), IO (+6.33 µm), NI (+7.93 µm), NO (+6.57 µm), SI (+6.68 µm), TI (+6.98 µm)
II (+21.63 µm), IO (+21.16µm), NI (+20.96µm), NO (+22.79 µm), SI (+17.75 µm), SO (+17.16µm), TI (+17.37µm), TO (+13.14µm)
II (+9.85 µm), NI (+8.76 µm), NO (+6.71 µm), SI (+8.57 µm), SO (+5.46 µm), TI (+9.6 µm)
Please consider the Supplementary Figure for further results of the comparison of the total retinal thickness in individual patients in the three groups CFNG, CFAG, and CFRD with the control group, the T1DM group, and the T2DM group.
Discussion
In this study we added rtCGM and macular OCT to the annual routine examination of CF patients with and without previously known CF related diabetes. Both, the results of the OGTT and the additional rtCGM enabled us to categorize the patients according to the individual glycemic control. Based on this, we compared the OCT findings per subgroup with those available from our previous studies, i.e. age-matched healthy controls, type 1 diabetes and type 2 diabetes patients.
It comes not as a surprise, that rtCGM provides more detailed information about glycemic control. Indeed, this tool enabled us to identify 6 out of 10 CF patients without known diabetic symptoms or abnormalities in previous OGTT suffering from CFAG. Thus, rtCGM might be considered as a useful tool to detect abnormal glycemic control at early stages, before diagnosis of clinically apparent CFRD.
Comparisons of OCT data between patients and controls showed deviations in each of the three subgroups and the deviation from the findings in healthy control increases with progression from CFNG to CFAG and finally CFRD. These findings point to an impact of CF on the retina even without funduscopic visible retinopathy or maculopathy, abnormalities in glycemic control and foster recent observations on aberrant neurological function in CF patients.Citation30–32 Apart from inadequately low absorption of micronutrients (e.g. vitamins E and B12, folic acid, copper) episodes of critical illness may contribute to the onset of peripheral neuropathy. Although we did not address these issues in depth, all patients enrolled in this study received adequate supplementation with micronutrients. Beyond this, our results point to the detrimental role of additional diabetes as the deviations from healthy controls were most pronounced in the CFRD group. Within this group, significant thinning at the areas of the parafoveal ring in deviation maps for RNFL, GCL and the total retinal thickness was noted. These results correspond with our recent reports on diabetes related changes in the retina.Citation35,Citation36 However and in-line with the current notion that CF related diabetes has features of both, an insulin deficiency like in T1DM and an intermittent insulin resistance like in T2DM retinal layers in CFRD patients are overall thinner than those in T1DM patients but thicker than those in T2DM patients.Citation40
Although the number of CFRD patients in our cohort is fairly small, we noticed at the parafoveal ring more pronounced deviations from normal controls and diabetic patients in those with longer duration of CFRD compared to those with shorter duration of CFRD. But clearly, further studies are needed to investigate these findings in more detail. A decrease in thickness of the retina may be due to more ischemic microvascular changes, whereas in case of a thickening one could suspect a blood-ocular barrier disruption supplemented by rather inflammatory conditions. Thus, it would be useful to include additional morphological criteria in a future study, for example intraretinal changes such as cystoid lesions, hyperreflective lesions or dots, and subretinal changes.
Few studies addressed the risk of microvascular disease in CFRD patients and point to a similar prevalence of diabetic retinopathy in CFRD and T1DM patients.Citation20,Citation23–29,Citation47,Citation48 Although screening for CFRD has been implemented into treatment guidelines instituted monitoring for diabetic microvascular complications is mostly an exception and even patients might not attend to such additional examinations.Citation20,Citation23,Citation24
While the use of deviation map-based analysis as a powerful tool for the detection and visualization of even subtle and early neurodegenerative changes in the intraretinal layers has to be considered as strength, the rather low number of patients might limit the impact of our results. Furthermore, deviations in retinal thickness between the groups were statistically significant, but differences in retinal thickness are most likely not clinically and functionally relevant. Especially since there was no difference in visual function. CFRD patients were older and retinal thickness also varies or decreases with age. Longer duration of the disease leads to overall longer duration of ischemia and associated changes and that means, above all retinal thinning. In a follow-up study diurnal fluctuations or measurement errors should be excluded by averaging several measurements per person per day to feel more confident that even the small changes are not falsified or artifact-related.
Although we cannot exclude the presence of outliers, we feel confident that our results justify an adequately powered prospective multicenter study including patients with and without CFRD. Apart from a careful assessment of glycemic control and an ophthalmological investigation like before, the micronutrient profile and state-of-the art electrophysiological studies should be added. Such an approach will help to figure out the effects of CF on retinal neurodegenerative changes in more detail.
Nevertheless, we obtained evidence, that intraretinal neurodegenerative changes do not only occur in patients with CFRD, even CF patients with normal glycemic control might be at risk to develop such changes. Indeed, the deviation maps highlight the differences between CF patients and either healthy controls, T1DM patients or T2DM patients.
Author contributions
LSS and MB were responsible for patient care, collection and analysis of data and preparation of the manuscript. Visualization of OCT data was done by MR; MB, FS, OS and DCF were responsible for the study concept, and design, supervised the study, participated in data analysis and interpretation, reviewed and edited the manuscript. All authors have read and agreed to the manuscript.
Ethical approval
Approval of the Ethics Committee of the University of Rostock in accordance with applicable laws, rules, and regulations was obtained (A 2019-0049) and routine annual examinations were extended in accordance with the declaration of Helsinki. Informed consent was obtained from all subjects involved in the study.
Supplemental Material
Download PDF (10.5 MB)Acknowledgments
The authors wish to thank Heidelberg Engineering GmbH, Germany for providing OCT device-specific software interfaces. We thank all patients who participated in this study and gratefully acknowledge the support of our colleagues. The outstanding technical assistance of Sandra Braunroth (Department of Paediatrics, Rostock) is highly appreciated.
Disclosure statement
No potential conflict of interest was reported by the author(s).
Data availability statement
The datasets during and/or analysed during the current study available from the corresponding author on reasonable request.
Additional information
Funding
References
- Elborn JS. Cystic fibrosis. Lancet. 2016;388(10059):2519–2531. doi: 10.1016/S0140-6736(16)00576-6.
- Ratjen F, Bell SC, Rowe SM, Goss CH, Quittner AL, Bush A. Cystic fibrosis. Nat Rev Dis Primers. 2015;1(1):15010. doi: 10.1038/nrdp.2015.10.
- McBennett KA, Davis PB, Konstan MW. Increasing life expectancy in cystic fibrosis: advances and challenges. Pediatr Pulmonol. 2022;57(Suppl 1):S5–S12. doi: 10.1002/ppul.25733.
- Bell SC, Mall MA, Gutierrez H, Macek M, Madge S, Davies JC, Burgel PR, Tullis E, Castaños C, Castellani C, et al. The future of cystic fibrosis care: a global perspective. Lancet Respir Med. 2020;8(1):65–124. doi: 10.1016/S2213-2600(19)30337-6.
- Moran A, Dunitz J, Nathan B, Saeed A, Holme B, Thomas W. Cystic fibrosis-related diabetes: current trends in prevalence, incidence, and mortality. Diabetes Care. 2009;32(9):1626–1631. doi: 10.2337/dc09-0586.
- Hameed S, Morton JR, Jaffé A, Field PI, Belessis Y, Yoong T, Katz T, Verge CF. Early glucose abnormalities in cystic fibrosis are preceded by poor weight gain. Diabetes Care. 2010;33(2):221–226. doi: 10.2337/dc09-1492.
- Lewis C, Blackman SM, Nelson A, Oberdorfer E, Wells D, Dunitz J, Thomas W, Moran A. Diabetes-related mortality in adults with cystic fibrosis. Role of genotype and sex. Am J Respir Crit Care Med. 2015;191(2):194–200. doi: 10.1164/rccm.201403-0576OC.
- Kayani K, Mohammed R, Mohiaddin H. Cystic fibrosis-related diabetes. Front Endocrinol. 2018;9:20. doi: 10.3389/fendo.2018.00020.
- Ballmann M, Hubert D, Assael BM, Kronfeld K, Honer M, Holl RW, CFRD Study Group. Open randomised prospective comparative multi-centre intervention study of patients with cystic fibrosis and early diagnosed diabetes mellitus. BMC Pediatr. 2014;14(1):70. doi: 10.1186/1471-2431-14-70.
- Ballmann M, Hubert D, Assael BM, Staab D, Hebestreit A, Naehrlich L, Nickolay T, Prinz N, Holl RW, CFRD Study Group. Repaglinide versus insulin for newly diagnosed diabetes in patients with cystic fibrosis: a multicentre, open-label, randomised trial. Lancet Diabetes Endocrinol. 2018;6(2):114–121. doi: 10.1016/S2213-8587(17)30400-X.
- Yi Y, Norris AW, Wang K, Sun X, Uc A, Moran A, Engelhardt JF, Ode KL. Abnormal glucose tolerance in infants and young children with cystic fibrosis. Am J Respir Crit Care Med. 2016;194(8):974–980. doi: 10.1164/rccm.201512-2518OC.
- Mackie AD, Thornton SJ, Edenborough FP. Cystic fibrosis-related diabetes. Diabet Med. 2003;20(6):425–436. doi: 10.1046/j.1464-5491.2003.00924.x.
- Milla CE, Warwick WJ, Moran A. Trends in pulmonary function in patients with cystic fibrosis correlate with the degree of glucose intolerance at baseline. Am J Respir Crit Care Med. 2000;162(3 Pt 1):891–895. doi: 10.1164/ajrccm.162.3.9904075.
- Leclercq A, Gauthier B, Rosner V, Weiss L, Moreau F, Constantinescu AA, Kessler R, Kessler L. Early assessment of glucose abnormalities during continuous glucose monitoring associated with lung function impairment in cystic fibrosis patients. J Cyst Fibros. 2014;13(4):478–484. doi: 10.1016/j.jcf.2013.11.005.
- Schiaffini R, Brufani C, Russo B, Fintini D, Migliaccio A, Pecorelli L, Bizzarri C, Lucidi V, Cappa M. Abnormal glucose tolerance in children with cystic fibrosis: the predictive role of continuous glucose monitoring system. Eur J Endocrinol. 2010;162(4):705–710. doi: 10.1530/EJE-09-1020.
- Franzese A, Valerio G, Buono P, Spagnuolo MI, Sepe A, Mozzillo E, De Simone I, Raia V. Continuous glucose monitoring system in the screening of early glucose derangements in children and adolescents with cystic fibrosis. J Pediatr Endocrinol Metab. 2008;21(2):109–116. doi: 10.1515/jpem.2008.21.2.109.
- Dobson L, Sheldon CD, Hattersley AT. Conventional measures underestimate glycaemia in cystic fibrosis patients. Diabet Med. 2004;21(7):691–696. doi: 10.1111/j.1464-5491.2004.01219.x.
- O’Riordan SMP, Hindmarsh P, Hill NR, Matthews DR, George S, Greally P, Canny G, Slattery D, Murphy N, Roche E, et al. Validation of continuous glucose monitoring in children and adolescents with cystic fibrosis: a prospective cohort study. Diabetes Care. 2009;32(6):1020–1022.,. doi: 10.2337/dc08-1925.
- Chan CL, Vigers T, Pyle L, Zeitler PS, Sagel SD, Nadeau KJ. Continuous glucose monitoring abnormalities in cystic fibrosis youth correlate with pulmonary function decline. J Cyst Fibros. 2018;17(6):783–790. doi: 10.1016/j.jcf.2018.03.008.
- Roberts R, Speight L, Lee J, George L, Ketchell RI, Lau D, Duckers J. Retinal screening of patients with cystic fibrosis-related diabetes in Wales – a real eye opener. J Cyst Fibros. 2015;14(2):282–284. doi: 10.1016/j.jcf.2014.07.014.
- van den Berg JM, Morton AM, Kok SW, Pijl H, Conway SP, Heijerman HG. Microvascular complications in patients with cystic fibrosis-related diabetes (CFRD). J Cyst Fibros. 2008;7(6):515–519. doi: 10.1016/j.jcf.2008.05.008.
- Nebbioso M, Quattrucci S, Leggieri E, Spadea L, Vingolo EM. Cystic fibrosis and new trends by ophthalmological evaluation: a pilot study. Biomed Res Int. 2014;2014:580373–580375. doi: 10.1155/2014/580373.
- Kempegowda P, Sunsoa H, Chandan JS, Quinn LM, Amrelia PM, Atta SN, Amir S, Teh YS, Chaudhry S, de Bray A, et al. Retinopathy and microalbuminuria are common microvascular complications in cystic fibrosis-related diabetes. Ther Adv Endocrinol Metab. 2020;11:2042018820966428. doi: 10.1177/2042018820966428.
- Schwarzenberg SJ, Thomas W, Olsen TW, Grover T, Walk D, Milla C, Moran A. Microvascular complications in cystic fibrosis-related diabetes. Diabetes Care. 2007;30(5):1056–1061. doi: 10.2337/dc06-1576.
- Lanng S, Thorsteinsson B, Lund-Andersen C, Nerup J, Schiøtz PO, Koch C. Diabetes mellitus in Danish cystic fibrosis patients: prevalence and late diabetic complications. Acta Paediatr. 1994;83(1):72–77. doi: 10.1111/j.1651-2227.1994.tb12956.x.
- Rodman HM, Doershuk CF, Roland JM. The interaction of 2 diseases: diabetes mellitus and cystic fibrosis. Medicine. 1986;65(6):389–397. doi: 10.1097/00005792-198611000-00004.
- Rosenecker J, Höfler R, Steinkamp G, Eichler I, Smaczny C, Ballmann M, Posselt HG, Bargon J, von der Hardt H. Diabetes mellitus in patients with cystic fibrosis: the impact of diabetes mellitus on pulmonary function and clinical outcome. Eur J Med Res. 2001;6(8):345–350.
- Scott AI, Clarke BE, Healy H, DE M, Bell SC. Microvascular complications in cystic fibrosis-related diabetes mellitus: a case report. JOP. 2000;1:208–210.
- Sullivan MM, Denning CR. Diabetic microangiopathy in patients with cystic fibrosis. Pediatrics. 1989;84(4):642–647.
- O’Riordan JI, Hayes J, Fitzgerald MX, Redmond J. Peripheral nerve dysfunction in adult patients with cystic fibrosis. Ir J Med Sci. 1995;164(3):207–208. doi: 10.1007/BF02967830.
- Chakrabarty B, Kabra SK, Gulati S, Toteja GS, Lodha R, Kabra M, Pandey RM, Srivastava A. Peripheral neuropathy in cystic fibrosis: a prevalence study. J Cyst Fibros. 2013;12(6):754–760. doi: 10.1016/j.jcf.2013.01.005.
- El-Salem K, Aburahma S, Rawashdeh M. Peripheral nerve dysfunction in patients with cystic fibrosis. J Clin Neurophysiol. 2010;27(3):216–218. doi: 10.1097/01.WNP.0b013e3181e0a9f9.
- Prakasam RK, Götze A, von Keyserlingk S, Jünemann A, Röhlig M, Stachs O, Fischer DC. Spectral-domain optical coherence tomography for determination of retinal thickness in pediatric patients with mild-to-moderate chronic kidney disease: a cross-sectional study. Curr Eye Res. 2019;44(2):206–211. doi: 10.1080/02713683.2018.1522649.
- Prakasam RK, Matuszewska-Iwanicka A, Fischer DC, Schumann H, Tschöpe D, Stratmann B, Hettlich HJ, Guthoff RF, Stachs O, Röhlig M. Thickness of intraretinal layers in patients with type 2 diabetes mellitus depending on a concomitant diabetic neuropathy: results of a cross-sectional study using deviation maps for OCT data analysis. Biomedicines. 2020;8(7):190. doi: 10.3390/biomedicines8070190.
- Götze A, von Keyserlingk S, Peschel S, Jacoby U, Schreiver C, Köhler B, Allgeier S, Winter K, Röhlig M, Jünemann A, et al. The corneal subbasal nerve plexus and thickness of the retinal layers in pediatric type 1 diabetes and matched controls. Sci Rep. 2018;8(1):14. doi: 10.1038/s41598-017-18284-z.
- Prakasam RK, Röhlig M, Fischer DC, Götze A, Jünemann A, Schumann H, Stachs O. Deviation maps for understanding thickness changes of inner retinal layers in children with type 1 diabetes mellitus. Curr Eye Res. 2019;44(7):746–752. doi: 10.1080/02713683.2019.1591463.
- Kromeyer-Hauschild K, Wabitsch M, Kunze D, Geller F, Geiß HC, Hesse V, von Hippel A, Jaeger U, Johnsen D, Korte W, et al. Perzentile für den Body-mass-Index für das Kindes- und Jugendalter unter Heranziehung verschiedener deutscher Stichproben. Monatsschr Kinderheilkd. 2001;149(8):807–818. doi: 10.1007/s001120170107.
- Neuhauser HK, Thamm M, Ellert U, Hense HW, Rosario AS. Blood pressure percentiles by age and height from nonoverweight children and adolescents in Germany. Pediatrics. 2011;127(4):e978-88–e988. doi: 10.1542/peds.2010-1290.
- Quanjer PH, Stanojevic S, Cole TJ, Baur X, Hall GL, Culver BH, Enright PL, Hankinson JL, Ip MS, Zheng J, et al. Multi-ethnic reference values for spirometry for the 3–95-yr age range: the global lung function 2012 equations. Eur Respir J. 2012;40(6):1324–1343. doi: 10.1183/09031936.00080312.
- Moran A, Pillay K, Becker D, Granados A, Hameed S, Acerini CL. ISPAD clinical practice consensus guidelines 2018: management of cystic fibrosis-related diabetes in children and adolescents. Pediatr Diabetes. 2018;19(Suppl 27):64–74. doi: 10.1111/pedi.12732.
- Schreiver C, Jacoby U, Watzer B, Thomas A, Haffner D, Fischer DC. Glycaemic variability in paediatric patients with type 1 diabetes on continuous subcutaneous insulin infusion (CSII) or multiple daily injections (MDI): a cross-sectional cohort study. Clin Endocrinol. 2013;79(5):641–647. doi: 10.1111/cen.12093.
- Ní Dhubhghaill S, Rozema JJ, Jongenelen S, Ruiz Hidalgo I, Zakaria N, Tassignon MJ. Normative values for corneal densitometry analysis by Scheimpflug optical assessment. Invest Ophthalmol Vis Sci. 2014;55(1):162–168. doi: 10.1167/iovs.13-13236.
- Cahn F, Burd J, Ignotz K, Mishra S. Measurement of lens autofluorescence can distinguish subjects with diabetes from those without. J Diabetes Sci Technol. 2014;8(1):43–49. doi: 10.1177/1932296813516955.
- Early Treat Diabetic Retinopathy Study Research Group. Grading diabetic retinopathy from stereoscopic color fundus photographs–an extension of the modified Airlie House classification. ETDRS report number 10. Ophthalmology. 1991;98:786–806.
- Röhlig M, Schmidt C, Prakasam RK, Rosenthal P, Schumann H, Stachs O. Visual analysis of retinal changes with optical coherence tomography. Vis Comput. 2018;34(9):1209–1224. doi: 10.1007/s00371-018-1486-x.
- Röhlig M, Prakasam RK, Stüwe J, Schmidt C, Stachs O, Schumann H. Enhanced grid-based visual analysis of retinal layer thickness with optical coherence tomography. Information. 2019;10(9):266. doi: 10.3390/info10090266.
- Andersen HU, Lanng S, Pressler T, Laugesen CS, Mathiesen ER. Cystic fibrosis-related diabetes: the presence of microvascular diabetes complications. Diabetes Care. 2006;29(12):2660–2663. doi: 10.2337/dc06-0654.
- Yung B, Landers A, Mathalone B, Gyi KM, Hodson ME. Diabetic retinopathy in adult patients with cystic fibrosis-related diabetes. Respir Med. 1998;92(6):871–872. doi: 10.1016/s0954-6111(98)90390-0.