ABSTRACT
This study aims to characterize urban spatial structure with respect to its multidimensionality. Using an encompassing data set of socioeconomic variables, as well as variables pertaining to the built environment, accessibility and land use, we suggest a quantitatively based urban (sub-) center typology. The fine-grained spatial scale of 1 km2 grid cells permits a higher spatial resolution than that used in most previous studies. Our suggested typology is two-layered: a “macro layer” based on cluster analyses sheds light on urban spatial configurations. A corresponding threshold-based “micro layer” identifies distinctive types of centers and subcenters at the local level. The application of this multi-scale and multivariate typology to four German city regions indicates both the core cities’ morphological dominance and the formation of subcenters with distinct profiles of regional economic importance, land use patterns and urban form. However, a substantial degree of spatial dispersion is observed because much activity is located in non-central locations.
1 Introduction
A fundamental change in the urban spatial structure has occurred in most countries of the Global North since the late 1970s. While scholars widely agree that the suburbanization of both population and employment has led to the emergence of spatially extended and morphologically unspecific patterns (e.g., Anas, Arnott, & Small, Citation1998, Hall & Pain, Citation2006), no consensus has been reached regarding the specific attributes that characterize these patterns. Many studies refer to the emergence of polynucleated urban structures and associated economic subcenter formation (Bontje & Burdack, Citation2005, Giuliano & Small, Citation1991, Riguelle, Thomas, & Verhetsel, Citation2007). Others claim that the “post-modern” urban form is rather characterized by the dispersion of residents and jobs over a spatially extended, “edgeless” and continuously “sprawling” territory (Fujii & Hartshorn, Citation1995, Gordon & Richardson, Citation1996, Lang & LeFurgy, Citation2003; Lee, Citation2007).
With the advent of “polycentricity” as both a theoretical and an analytical concept, an enormous body of literature has been concerned with the morphological and functional characteristics of employment densifications in central and decentral places (the latter are referred to as “subcenters”). Within these contributions, there is controversy regarding the attributes that qualify a certain spatial densification of employment as a “center” or “subcenter” (e.g., Knapp & Volgmann, Citation2011, McMillen & Smith, Citation2003, Meijers, Citation2007). Authors have proposed various methods to identify statistically significant economic centers and subcenters and obtained contrasting results regarding their number and size (e.g., Agarwal, Giuliano, & Redfearn, Citation2012, see Krehl, Citation2016 for an overview). Instead of a binary dichotomy, spatial restructuring processes could be considered as a continuum between employment subcentering and dispersion (see e.g., Anas et al., Citation1998, Duranton & Puga, Citation2015). Following this line of argumentation, any attempt to identify urban centers and subcenters must be subjective and is sensitive to the regional context.
Against that background, it is necessary to find further work that focuses on descriptive attributes of urban subcenters such as business profiles, land use patterns, locational characteristics or features of the urban form (e.g., Agarwal, Citation2015, Flores-Fillol, Garcia-López, & Nicolini, Citation2016, Romero, Solís, & Ureña, Citation2014). These contributions indicate that the empirical investigation of urban spatial structure requires more than just analyzing the spatial distribution of employees in metro areas. This requirement especially applies to attempts to explain – instead of solely describe – spatial patterns of economic activity. Based on recent studies, it can be concluded that any explanatory framework requires information on population (workforce) distribution, transport networks, land prices and public land use regulations (Agarwal, Citation2015, Garcia-López, Citation2010, Kantor, Rietveld, & van Ommeren, Citation2014, Parr, Citation2014). However, such a truly multidimensional conceptualization of urban spatial structure is still rare in the literature.
In the light of these findings, it is unsurprising that very few studies have proposed typologies that portray urban centers and subcenters as a specific, site dependent interplay of jobs and residents, land use patterns, building structures and infrastructure endowments (e.g., Hajrasouliha & Hamidi, Citation2017, Hall, Citation2001). An airport city, to give just one example, differs from a suburban office park in more respects than simply employee density (see Appold & Kasarda, Citation2013). Nevertheless, previous research has often undervalued the variegated nature of subcenter formation in terms of physical outcomes and the local context of development.
We take these shortcomings as our starting point: this study aims to characterize urban spatial structure focusing on its multidimensionality. More specifically, we seek to establish a typology of urban centers and subcenters using a multidimensional data set consisting of socioeconomic variables, variables pertaining to the built environment, accessibility and land use. This data set considers the multidimensionality of urban spatial structure not only based on its wide range of attributes but also based on its fine spatial grain. All empirical analyses are conducted on the spatial level of 1 km2 grid cells, which permits a spatially detailed typology.
The remainder of this paper is organized as follows: Section 2 provides an overview of theories of urban center and subcenter formation and current research efforts regarding subcenter typologies. Section 3 introduces the data, the study regions and the methodological approach. The typology is derived and interpreted in Sections 4 and 5. The paper closes with a discussion of the research strategy and the resulting two-layered typology of urban centers and subcenters (Section 6) and provides some avenues for future work (Section 7).
2 State of research
There is a rich body of literature regarding various aspects of urban spatial structure, as the topic has been addressed by different disciplines of spatial and regional sciences. Thus, there are several different notions of urban spatial structure in general and (sub-) center emergence in particular. We do not claim to provide a complete overview of these studies, but we attempt to show the broad strands of the discussion before locating our contribution – a typology of urban centers and subcenters – within this state of the art.
Urban regions are undoubtedly complex, which especially applies to urban spatial structure representing the distribution of human activities (e.g., Angel & Blei, Citation2016, Craig, Kohlhase, & Perdue, Citation2016, Parr, Citation2014, Scott & Storper, Citation2015, Spencer, Citation2015, Yang, French, Holt, & Zhang, Citation2012). Whereas several studies analyze metropolitan areas as two-dimensional geographic spaces, that is, in the sense of identifying urban and suburban densifications of economic activity (e.g., Arribas-Bel, Ramos, & Sanz-Gracia, Citation2015, Giuliano & Small, Citation1991, Krehl, Citation2018, McMillen, Citation2001, Riguelle et al., Citation2007), examining the multidimensionality of metropolitan areas’ urban spatial structure has mainly been done with theory-led, quantitative means of analysis (e.g., Adolphson, Citation2010, Appold, Citation2015, Arribas-Bel & Sanz-Gracia, Citation2014, Roca Cladera, Marmolejo Duarte, & Moix, Citation2009). Within these and similar contributions, much work has been devoted to theoretical and empirical aspects of the distribution of socioeconomic activity and land uses. This work comprises contributions addressing the distribution of employees and residents (e.g., Ahlfeldt, Citation2011, Small & Song, Citation1994), investigations of land use patterns (e.g., Kantor et al., Citation2014, McMillen & McDonald, Citation1999), studies regarding economic branches and their possibly excessive spatial clustering (e.g., Behrens & Bougna, Citation2015, Muñiz & Garcia-López, Citation2010, Spencer, Citation2015), and studies of path dependencies in the evolution of regional spatial patterns (e.g., Hohenberg, Citation2004, Percoco, Citation2014, Turok & Mykhnenko, Citation2007), among other topics.
As soon as suburban or non-central densifications of jobs or employees, so-called subcenters, appear within a study region, many scholars use the term polycentricity to characterize this spatial pattern. However, the concept of polycentricity, and implicitly that of (urban) subcenters, is fairly vague. Several contributions address this vagueness both in general (e.g., Davoudi, Citation2003, Green, Citation2007, Hall & Pain, Citation2006) and with meta-analyses of the current literature (Agarwal et al., Citation2012, Roca Cladera et al., Citation2009, van Meeteren, Poorthuis, Derudder, & Witlox, Citation2016). The least common denominator in this discussion is that a subcenter is characterized by a substantial endowment with jobs or job density (jobs per km2). This issue is tackled in a study by Agarwal et al. (Citation2012) showing that the number and size of urban subcenters varies greatly within the same study region because of the lack of a non-subjective definition of “subcenter”.
Considering this vagueness, it is not surprising that intense discussions are held regarding the methods of subcenter identification (overviews provide, e.g., Giuliano, Redfearn, Agarwal, Li, & Zhuang, Citation2007; Krehl, Citation2015; Roca Cladera et al., Citation2009), the theoretical foundations of the emergence and growth of urban and suburban densifications (e.g., Anas & Kim, Citation1996, Berliant & Wang, Citation2008), and the causes and effects that subcenters might have on the region they are located in (e.g., Carruthers, Lewis, Knaap, & Renner, Citation2010, Muñiz, Garcia-López, & Galindo, Citation2008). All of these contributions show that both the concept of polycentricity and the identification of subcenters suffer simultaneously from both fuzziness and complexity. Still, these contributions provide valuable hints to understanding the multifaceted reality of the morphology of urban systems.
Compared to the above-mentioned contributions regarding conceptual issues, further studies consider selected characteristics of urban centers and subcenters. These studies can be subdivided into studies that either discuss certain characteristics of subcenters, such as their location within a metro (e.g., Einig & Guth, Citation2005, Krehl, Citation2015; McMillen & Lester, Citation2003), or these subcenters’ region-wide relevance to population density, employee density or land prices (e.g., Arribas-Bel & Sanz-Gracia, Citation2014, Craig et al., Citation2016, Krehl, Citation2018, McMillen, Citation2001). Concerning the locations of subcenters, it can be concluded that they are often located in close proximity to the regional center and, in Germany at least, rarely in peripheral areas (Krehl, Citation2015, Citation2018). The functional profiles of subcenters have also been discussed, taking into account housing space, industrial branches, infrastructure facilities and land use types (e.g., Fujii & Hartshorn, Citation1995, Garreau, Citation1992, Giuliano & Small, Citation1991, Leslie, Citation2010, Shearmur & Coffey, Citation2002b). However, researchers have failed to achieve a thorough integration of the identification, analysis and functional description of urban centers and subcenters.
A third strand of contributions is oriented towards the derivation of typologies. Two different directions can be observed within this strand: on the one hand, few studies exist that actually define quantitative-analytical means of certain centers or subcenters (e.g., Baum, Haynes, van Gellecum, & Han, Citation2006, Hajrasouliha & Hamidi, Citation2017, Sarzynski, Hanson, Wolman, & McGuire, Citation2005, Shearmur & Coffey, Citation2002b). On the other hand, a set of partially qualitative studies intensively discusses one certain type of centers or subcenters, such as historical downtowns (e.g., Anas et al., Citation1998, Angel & Blei, Citation2016, Hohenberg, Citation2004), “edge cities” and so-called “new downtowns” (e.g., Bontje & Burdack, Citation2005, Garreau, Citation1992, Helbrecht & Dirksmeier, Citation2009, Phelps, Citation2012), “technology parks” and “technoburbs” (e.g., Fishman, Citation1987, Lang & LeFurgy, Citation2003, Spencer, Citation2015) and “airport cities” (e.g., Appold, Citation2015, Appold & Kasarda, Citation2013). Furthermore, we find studies generally agreeing that several distinct types of subcenters exist but that these subcenters are embedded in the continuity of the urban fabric (e.g., Lang & Knox, Citation2009, Shearmur & Coffey, Citation2002a).
Finally, it should be noted that no consensus exists regarding the “universality” of changing urban spatial structures and the importance of contextual factors that may lead to location specific patterns of urbanization. It could be argued that processes of economic deconcentration are somewhat universal, as they characterize spatial restructuring in most countries of the Global North (see also Bontje & Burdack, Citation2005, Glaeser & Gottlieb, Citation2006). Following this view, global forces of economic and social change manifest themselves as convergent trends of structural changes in urban systems. At the same time, cultural and economic variation, institutional differences, varying demographic patterns, or local policies and planning cultures may generate striking differences in urban form and land use patterns (Bourne, Citation2008, Shearmur & Coffey, Citation2002a).
This overview indicates that an impressive number of studies have discussed the formation, size and identification of urban centers and subcenters, whereas fewer papers have addressed these densifications’ characteristics in a multidimensional manner. This scarcity is our paper’s motivation: we suggest a typology of urban centers and subcenters that is based on the spatial level of grid cells and that (1) meets both quantitative and qualitative criteria and (2) is reflected in theoretical underpinnings regarding regional economics and spatial planning. Thus, our research objective is to evaluate urban and suburban densifications that may establish and/or reproduce a (central) business district. Based on this evaluation, we suggest an empirically verified typology of urban centers and subcenters.
3 Empirical setting
3.1 Methodology
We address urban spatial structure in its morphological respect, that is, we consider places not flows. Thus, we define urban spatial structure as “the way in which a metropolitan city is organized in a territory” (Garcia-López, Citation2010, p. 119). Within this framework, the notion of multidimensionality further implies that urban spatial structure is jointly characterized by human activity, represented by employment and residential use, and by corresponding physical structures, such as different types of land uses, buildings or infrastructure endowments. Finally, we aim to identify these multidimensional densifications and to differentiate them by their morphological features.
Our empirical procedure is based on three consecutive empirical steps: the first step provides a quantitative basis for our typology, and steps two and three provide a macro layer (step 2) and a subsequent micro layer (step 3). Thus, the idea is to first establish a macro layer that serves as a “search area” for the consecutive micro layer. visualizes this procedure.
Figure 1. Summary of the empirical procedure (Source: Own elaboration based on the data described above).
First, a principal component analysis (PCA) is used to summarize variables that measure the same underlying effect. From a content perspective, we aim to summarize overlapping variables while retaining as much dimensionality as possible (see Section 4.1 for details of the PCA). We chose our study regions in accordance with a most similar systems design (MSSD; see also Section 3.3), which is the reason why we expect the PCA to produce similar principal components for each study region (see also Shearmur & Coffey, Citation2002b).
Second, and based on these principal components, we perform a series of cluster analyses, which are expected to produce more than two significantly different clusters. These clusters are further qualified with descriptive statistics to evaluate their respective characteristics. We chose clustering in attribute space (i.e., standard cluster analysis) as opposed to clustering in geographical space (e.g., Local Moran’s I) because our objective is to develop a multidimensional typology of urban centers and subcenters instead of a typology that is only based on one variable, which the Local Moran’s I provides. Another aspect is that spatial clustering reveals spatial dependencies but hardly contributes to a deeper understanding of characterizing factors, apart from geographic location. Yet, we do consider spatiality: Although the specifications for both the PCA and the subsequent cluster analysis are identical in all study regions, we expect to identify both differences and similarities in the urban spatial structure of our four study regions.
We expect, for example, substantial differences between monocentric and polycentric city regions: if a region is polycentric, it will have more than one center. Whereas the cluster analysis will likely identify one “high-performance” cluster in each region, mapping this core cluster should prove that it is geographically spread in polycentric regions. Consequently, the spatial representation of the methodologically a-spatial cluster analysis should differ substantially between monocentric and polycentric regions. From a theoretical point of view, we argue with the help of spatially effective (urban) agglomeration economies, which are expected to be stronger in monocentric than in polycentric regions. The literature on the existence and efficiency of agglomeration economies is encompassing and provides a solid basis for explaining spatial clustering (see e.g., Glaeser, Kallal, Scheinkman, & Shleifer, Citation1992 for an overview). If spatial agglomeration economies exist, “high-performance” values will be clustered in space. At the same time, these high-performance values are likely to be sufficiently similar to be grouped into the same cluster by the cluster analysis. This theoretical consideration implies for our research objective to develop a (sub-) center typology that we especially rely on areas that show “adequate performance”. This means that we omit “low performance” clusters before we finally develop our typology (i.e., the micro layer). This omission will be based upon the results of the cluster analysis, which allows us to identify these “low performance” clusters as low-density, difficult-to-access, and sparsely populated areas. Thus, we first run the PCA on the complete data set and obtain a number of principal components. Second, we use these components in the cluster analysis and obtain a number of distinct clusters. Third, we eliminate the low-density cluster(s) and keep the others. As a result, we have these remaining denser clusters (i.e., areas consisting of several 1 km2 grid cells), which form the “macro layer” of our typology and thus establish the search area for different center and subcenter types.
The third step in developing our typology is to derive a micro layer that is based on the macro layer. The expectation is that regional similarities, which are captured by the clusters that establish the macro layer, are distorted by local peculiarities. It is well documented in the literature that historic events, region-specific institutions and traditions, as well as natural resources or topographic aspects have often been the triggers or framing conditions for certain location-specific developments (Krehl, Siedentop, Taubenböck, & Wurm, Citation2016, Sarzynski et al., Citation2005). These incidents manifest in path dependent trajectories of cities and city regions (Hohenberg, Citation2004, Martin, Citation2014).
We acknowledge some of these aspects in our typology’s micro layer. This layer is based on a numerical threshold approach. Nevertheless, we also use some non-quantifiable aspects to describe and interpret our results. Based on a literature survey, we collect and classify different types of centers and subcenters. Drawing on these typologies’ mostly qualitative attributes – few contributions establish quantitative criteria to characterize a site as a certain type – we establish z-score-based thresholds that any site must meet to be considered a certain center or subcenter type (for details, see Section 5). To meet the multidimensionality of urban spatial structure and to simultaneously consider locational specifics, we do not establish one single threshold but apply a set of combined thresholds for each (sub-) center type.
3.2 Data and spatial scale
We consider the multidimensionality of urban spatial structure in three respects: socioeconomics, measured by employee and residential densities; accessibilities, quantified by metric distances; and built environment, captured by built densities and land consumption (see also Agarwal, Citation2015, Garcia-López, Citation2010, Kantor et al., Citation2014. Sarzynski, Galster, & Stack, Citation2014). We chose these groups of variables because they are core ingredients of what makes a city: people in their role as both employees and residents, buildings where these people live and work, and land where buildings and infrastructure facilities are built. Furthermore, urban economic theory shows that accessibility and the distance to urban densifications is a crucial factor for agglomeration economies – which is among the main reasons why individuals gather in the same place (see e.g., Parr, Citation2002, p. 152 or Scott & Storper, Citation2015 for overviews). Finally, land consumption is an issue because our suggested typology is not only based on the status quo but also considers the site’s development trajectory.Footnote1 Previous studies have shown that a type is not only characterized by what is manifest today but also by its history (e.g., Sarzynski et al., Citation2014).
The socioeconomic part of the data set combines georeferenced information regarding employees at their places of work, as well as information on firms and residents. Employee and firm data are taken from the georeferenced Integrated Employment Biographies (georeferenced IEB), as of June 30th, 2009. These georeferenced IEB do not include self-employed persons and civil servants, which results in capturing only 75% of all employed persons on a Germany-wide average (Statistisches Bundesamt [Destatis], Citation2008a). The missing 25% are not available on the fine-grained spatial scale of 1 km2 grid cells. Additionally, the georeferenced IEB are subject to censoring due to German privacy laws. All grid cells with either fewer than three employees belonging to fewer than three firms (“minimum case”) or one firm accounting for more than 50% of all employees in a grid cell (“dominance case”) were censored (for details, see Bundesagentur für Arbeit [BA], Citation2014). One employee was manually assigned to each of these censored grid cells to avoid an even more severe downward bias due to completely excluding them from the analyses. This replacement applies to 21–37% of all grid cells regarding all employees, and it applies to 41–58% of all grid cells regarding a subset of all employees, namely those in service sectors. However, the affected grid cells only contain 0.5–1.0% of all employees and of 2.0–3.0% of the employees in service sectors. Service sector jobs are those registered in sections J–N and S according to the Classification of Economic Activities, issue 2008 (Statistisches Bundesamt [Destatis], Citation2008b).
The population data are taken from EUROSTAT and are based on the German census 2011 (Eurostat, Citation2014). These data are also subject to censoring once fewer than three people live in a grid cell. Thus, it can be expected that the censored grid cells do not characterize (sub-) urban densifications but represent a peripheral/rural area. The censoring is therefore considered negligible regarding the derivation of a typology of urban centers and subcenters.
Accessibility measures are distances, which are calculated in meters based on NAVTEQ street map data. Accessibility includes distances to the nearest central business district (CBD), the nearest main station of railway transportation, the nearest highway entrance ramp and the nearest international airport.
Information on the built environment originates from remote sensing. Built-up volumes were calculated for each grid cell based on large-area 3D building models. These models were generated by fusing information from building footprints and building heights. The building footprints were derived from topographic maps at a scale of 1:25000, and the building heights were derived from these footprints, with height measurements obtained from stereoscopic satellite imagery (for details, see Wurm, d’Angelo, Reinartz, & Taubenböck, Citation2014). Information regarding land use and land consumption between 1970 and 2010 has been extracted from publicly accessible data sources such as http://earthexplorer.usgs.gov/ or http://glovis.usgs.gov/. One representative cloud-free scene has been chosen for each decennial. The data quality varies between 79 × 79 m geometric resolution for the 1970s data (Landsat-MSS) and 30 × 30 m resolution for the other data (Landsat-TM).Footnote2 This information facilitates to distinguish older densifications that were developed before 1970 from newer sites developed since the 1970s.
All analyses are conducted on the spatial level of grid cells with a side length of 1 km, which are located in accordance with the European grid INSPIRE (Infrastructure for Spatial Information in the European Community). The data on residents and employees were recently made available for Germany on this spatial scale. The data regarding the built environment were originally even smaller in their spatial scale but were aggregated into the 1 km2 grid cells.
3.3 Study regions and a most similar systems design
The study regions are Frankfurt, Cologne, Munich and Stuttgart. All were delineated on the basis of regional labor markets and metropolitan areas, both defined by the Federal Institute for Research on Building, Urban Affairs and Spatial Development (Bundesinstitut für Bau-, Stadt- und Raumforschung [BBSR], Citation2012a, Citation2012b). Each region’s core city is defined in accordance with the definition of core cities provided by the BBSR: core cities have more than 100 000 inhabitants and a surplus of inbound commuters (BBSR, Citation2012b). Whereas the Munich and Stuttgart regions are characterized by one core city (the cities of Munich and Stuttgart), the Frankfurt region comprises four (Frankfurt, Darmstadt, Mainz and Wiesbaden), and the Cologne region comprises two core cities (Cologne and Bonn). Thus, the sample consists of a region that is expected to be monocentric (Munich), a region that is supposedly monocentric but where local knowledge suggests a polycentric or dispersed urban spatial structure (Stuttgart), and two regions implying inter-urban polycentricity, as they consist of multiple core cities (Cologne and Frankfurt).
The choice of regions was made in accordance with a most similar systems design (MSSD). The MSSD requires that the chosen regions should be similar in all but one characteristic (Yin, Citation2009). shows that the study regions used here are quite similar in most variables except for the number of core cities. That number serves as our a priori identifier for the region’s polycentricity. Furthermore, provides an overview of the study regions’ endowment with employees, residents, and built-up volume, as well as information on accessibility and land consumption. These numbers show that all regions have a substantial economic base with an employee-to-resident ratio of approximately 0.30. Moreover, considerable land consumption and building construction has occurred in all regions between 1970 and 2010: taking 1970 as reference year, the increase in built area was between 8.7% (Cologne region) and 19.8% (Stuttgart region). Finally, all regions are well-integrated into the national and transnational transportation infrastructure.
Table 1. Characterizing the study regions.
4 The macro layer: providing a ‘search area’
4.1 Principal component analysis
Correlation analyses revealed strong correlations between most socioeconomic variables, between accessibility measures and between information on the built environment. Thus, a PCA is necessary before a cluster analysis can be run. The list of included variables comprises the data summarized in . To establish comparability among the variables, they were standardized into z-scores. Next, the correlations among all variables were analyzed with respect to their feasibility for a PCA. The feasibility is reached by stepwise deletion of variables that do not score a measure of sampling adequacy greater than 0.7.Footnote3 The remaining variables enter the PCA with varimax rotation. Finally, those components that score an eigenvalue larger than 1.0 are extracted. These principal components’ values are predicted for each grid cell and thus form the basis for the subsequent cluster analysis.
Table 2. List of variables considered for the macro layer.
We identify four (Cologne and Munich regions) and five fairly similar principal components (Frankfurt, Stuttgart). These components were assigned common names that reflect the variable(s) that contribute most to the respective component, hence the common underlying factor. The results show that the first and second components, which are called “socioeconomic importance” (component 1) and “functional balance and grain” (component 2) jointly explain approximately 50% of the total variance in the data. “Accessibility”, which is the third component, is quite stable across the study regions, explaining approximately 15% of the data variance. The component capturing most variables regarding the built environment seems to be outweighed by the others because it only captures approximately 10% of the variance in the data (see ).
Thus, all regions are mainly characterized by socioeconomic drivers such as employees, firms and residents. This result was expected given that the database is strongly oriented towards socioeconomic factors. At the same time, second nature geography seems to play an important role, too. This finding is reflected in the “accessibility” and “built environment” components and it is consistent with theory and international research regarding accessibility means and their relation to economic growth (see also Melo, Graham, Levinson, & Aarabi, Citation2017).
4.2 Cluster analysis
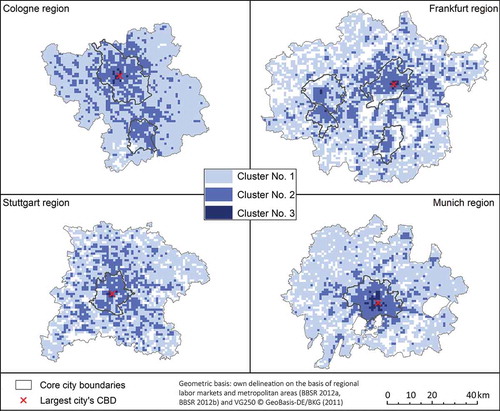
The cluster analysis is based on a hierarchic-agglomerative procedure with a Ward classification algorithm. Distances are measured by squared Euclidian distances. Though we did not decide on the number of clusters a priori, we excluded a two-cluster solution because we do not aim to describe core-periphery structures only. Our cut-off criterion for grouping the observations into clusters is based on both numeric (Calinski-Harabasz) and knowledge-driven criteria, but the aforementioned criteria count more. Conducting the cluster analysis reveals no clear-cut optimum solution that fits for all study regions. However, as this paper’s objective is a less technical but more knowledge-driven and exploratory typology of urban centers and subcenters, we believe that a three-cluster solution is most appropriate here. This decision is supported by the data, although it is not necessarily the numerically optimal solution. shows the geographical representation of the cluster analysis.
Figure 2. Macro layer based on the mapping of the 3-cluster solution (Source: Own elaboration based on the data described above).
Inspecting shows that a core-periphery pattern is especially prominent for the Cologne and Munich regions, whereas the regions of Frankfurt and Stuttgart are rather dispersed regarding the geographical representation of clusters. However, the Frankfurt region seems to still have a more concentrated structure than the Stuttgart region. displays the proportion of each cluster out of the region’s total for employees, residents and built area. The last column of indicates the respective shares in the case of a joint analysis.Footnote4
Table 3. Shares of region-wide totals captured by the clusters.
Cluster 3 represents areas with high densities of socioeconomic activity. For example, Munich’s Cluster 3 contains 17% of the built area and only 3% of the entire region’s area, but it contains 36% of the regional employment base and 33% of the regional population. In contrast, Cluster 1 contains 44% (73%) of the built (entire) area but is home to just 28% of the region’s residents and the workplaces of 26% of the region’s employees. These findings demonstrate the existence of a strong core-periphery divide in the Munich region (see ) and they are similar though not that pronounced in the other study regions.
These findings give rise to several useful aspects for our typology: (1) Separate considerations indicate that Cluster 3 “buzz” grid cells (i.e., those with a high score on almost all variables, see ) are predominantly located in the core cities’ central business districts. (2) Development tends to follow the regional axial system. Referring to the joint consideration (see Appendix B) provides support for these findings. However, we do not focus on the joint analysis because we would obtain consistent center and subcenter types for exactly these four study regions if we based the final typology on the joint analyses of all four study regions. Yet, these types would be sensitive to the regions included in the analysis and therefore not necessarily useful in other contexts, such as a sample consisting of more or other regions than those used here.
4.3 Discussing the macro layer
The first macro type is low-density areas as defined by Cluster 1. These areas are characterized by sparse populations in terms of employees, residents, firms and built-up volume. Moreover, they score below-average values for accessibility. The contrasting macro type is buzz areas, indicated by Cluster 3. These areas are densely populated, endowed with fairly large amounts of built-up volume, and they experienced comparatively little land consumption in the last decades. Although accessibilities are better in the buzz areas than in the low-density ones, accessibility differences between the clusters are much smaller than those between socioeconomics or the built environment in buzz vs. low-density areas. This finding indicates a comprehensively developed transportation network within each study region. A third macro type is derived from Cluster 2, which scores medium values in all variables considered. This type, thus, is called medium-density areas and is the linking element between buzz and low-density areas both in terms of activity and in terms of geography (see and ).
One possible explanation of these findings is that most buzz areas are the historical downtowns of core and medium-sized cities. Additionally, we assume that aspects of urban agglomeration economies, such as density and proximity, also contribute to these areas’ dominance. The data provided in support this assumption, showing that buzz areas are, compared to the area they cover (which is 1–7%), disproportionately endowed with employees (13–45%), residents (12–44%) or built-up volume (12–34%). Though the data do not facilitate a detailed analysis, we suspect that the functional specialization of buzz areas is oriented towards higher-order service sectors. This type of services has been shown in other contributions to gain the most from positive economies of urbanization (for an overview, see e.g., Romero et al., Citation2014, p. 894).
The macro type “medium-density areas” is less densely populated in terms of employees, residents and built-up volume and therefore represents suburban environments. Its accessibility measures are, however, fairly similar to those in the buzz areas. Thus, we presume that this type is characterized more by industries in need of good transportation facilities than by lower-density residential land use. Both of these aspects are supported by , which shows that this type’s locations are roughly following major transportation axes and capturing subcenters in polycentric regions. Medium-density areas in monocentric regions are spatially organized around the regions’ cores. Comparatively high land consumption between 1970 and 2010 further suggests that this macro type captures areas that have gained importance in the last decades.
5 The micro layer: enabling the typology
5.1 General remarks
A technical issue of the cluster analysis is that it groups similar objects. Thus, the clusters are homogeneous. A typology that distinguishes more and spatially more detailed types than those identified by the cluster analysis requires further information. Accordingly, we add a micro layer to derive site-specific center and subcenter types. Site-specific means that we do not amalgamate several grid cells into a cluster as we did in the macro layer, but we keep the level of individual 1 km2 grid cells. To accurately identify centers and subcenters, we only keep the buzz and medium-density areas obtained in the macro layer. Pre-selecting the macro types buzz and medium-density areas is thus the logical consequence. Otherwise, the micro layer would be distorted by many low-activity locations. These might be relevant to their immediate neighborhoods, but they are not relevant at a regional scale.
Still, the buzz and medium-density areas and the grid cells they consist of differ with respect to their economic specialization, their population density and employee density, and their urban form or land consumption. Yet, we argue that subcenters are not only characterized by a high employee density but more generally by marked “activity”: according to our multidimensional notion of urban spatial structure, it is not sufficient to only rely on one density measure to identify urban centers and subcenters. Rather, it is inevitable to consider a bundle of indicators consisting of socioeconomic variables, accessibility measures as well as the built environment (see also Angel & Blei, Citation2016, Craig et al., Citation2016, Scott & Storper, Citation2015, Spencer, Citation2015, Yang et al., Citation2012). To account for this multidimensionality on a site-specific level, we derived combined thresholds. Each threshold combination is assigned to a certain center or subcenter type, which we derived from the mostly descriptive literature. The precise thresholds are chosen in relation to both few theoretical and several descriptive contributions found in the literature (Anas et al., Citation1998, Angel & Blei, Citation2016, Bontje & Burdack, Citation2005, Garreau, Citation1992, Hohenberg, Citation2004, Lang & LeFurgy, Citation2007, Sarzynski et al., Citation2014). Yet, they are not the outcome of a numerical optimization approach.
5.2 Explaining the combined thresholds
The first micro type, called high-density core area, is characterized by outstanding employment and population densities as well as by substantially built environments. These areas turn out to be mainly located in or near the (historic) downtowns of older cities (see ); they are served by a radial public transportation network; and they benefit from accessibility advantages and strong economies of urbanization. Thus, type one represents the typical European inner city, with its high density and mixed use character.
Figure 3. Micro layer (source: Own elaboration based on the data described above).
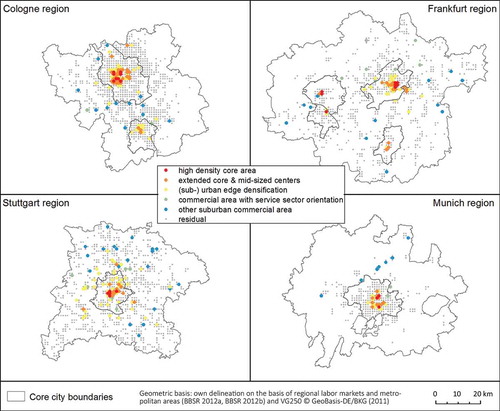
Likewise, we defined a second micro type, extended core & mid-sized centers, which is also highly densified but not as much as the “high density core area”. In monocentric regions, “extended core & mid-sized centers” are expected to be located in close proximity to the first type. In polycentric regions, by contrast, we expect to find this type in the centers of non-core areas, that is, in subcenters distant from the region’s core. We presume that the degree of economic specialization is rather weak in micro type two. Regarding its morphological and functional profile, type two sites could be described as mixed-use, vibrant and diverse urban neighborhoods of the pre-war era, with large numbers of jobs and high residential densities.
Contrary to these rather dense locations are the micro types three, four and five, which represent (sub-) urban edge densifications, rather decentral commercial areas with service sector orientation, and other suburban commercial areas. We expect these types to be located outside the historical downtowns of core and medium-sized cities. Micro type three represents larger office developments, such as “office parks”, “technology parks” or “internal edge cities” (see Hall, Citation2001), at strategic locations near motorways, suburban transportation hubs or airports. We anticipate that many of these developments date from the 1960s and 1970s, when a first wave of suburbanization transformed the regional employment geography. In some cases, they might be – the data do not tell, but local knowledge suggests – the direct outcome of public planning to reduce the economic pressure on the historical downtowns (e.g., Frankfurt Niederrad).
Compared to type three, the types four and five are newer low-density sites with a diffuse mix of office and manufacturing uses. Both types have mostly been developed since the 1970s. To capture this aspect, the threshold regarding land consumption is set above average (see ). The distinction within these two types is a rather functional one: type four is more oriented towards the service sector, implying that employee density in services must be above average, whereas the density of all employees should be below average; and vice versa. Thus, type four encompasses newly built commercial and industrial areas with “infiltrated”, that is, not originally intended but nowadays apparent office uses.
Table 4. Thresholds and descriptions of the micro layer’s types.
It is important to consider that all thresholds chosen above are normative, although they are grounded in expert knowledge and descriptive contributions. A theory-based or optimization-based justification for exactly these thresholds does not exist. However, we have performed a thorough literature review, and our derived thresholds have been evaluated regarding their sensitivity to changes. We found, for example, that the inclusion of accessibility measures disturbed most subcenter types, as the transportation network (especially the motorway network) is quite ubiquitous in the study regions. This seeming non-relevance of accessibilities was surprising, as we did not find “airport cities” in the sense that well above-average accessibilities to international airports would have led to a distinctive type. Applying both our local knowledge of the study regions and inspecting several choropleth maps regarding densities and accessibilities supports this finding. If we had data on an ever finer-grained spatial scale, we would not rule out identifying small densifications around international airports, which exist in all study regions.
6 Discussion
In summary, our empirical findings stress that historic inner cities are still “high performers” in both economic and residential terms. Downtown areas and their immediate surroundings have not been affected by deconcentration and urban sprawl at a rate comparable to that found in metro areas in the United States and other advanced land-rich countries. We find that both employee and residential densities of inner city areas are still considerably high (see ; for corresponding values from metro areas in the United States, see e.g., Giuliano et al., Citation2007, p. 2942).
Table 5. Region-wide averages for each micro type.
At the same time, the spatial pattern of German metro regions could be partly understood as polycentric, as a distinctive set of spatial clusters has emerged (i.e., Clusters 2 and 3 in ). These subcenters are mostly located near the central cities and play a substantial economic role as business concentrations. However, in some contrast to the concept of polycentricity, our micro typology based findings show that a majority of jobs and residents is located outside places that we consider “centers” and “subcenters”. Such “non-center sites” are those grid cells that are not assigned a micro type but are located in the search area obtained from the macro layer (i.e., gray dots in ). Still, they cover approximately 80% of all jobs and residents located in Clusters 2 and 3. In terms of urban form and functionality, we assume that mixed-use areas with moderate densities, smaller commercial areas at the urban fringe, or even residential areas with spatially diffuse employment structures (such as retail or close-to-home consumer services) are typical appearances of these non-center sites.
According to this finding and based on , which shows a map of the subcenter types in our study regions, the post-industrial employment pattern of German metro regions is not necessarily characterized by large scale subcentering and it is clearly not characterized by marked spatial segregation of urban functions. We did not find larger, spatially separated edge city-like structures. Typical is a dispersed and fragmented “belt” of employment locations around the core cities’ CBDs and along radial regional transportation axes. This belt contains both densifications (subcenters, indicated by colored dots in ) and non-center sites with spatially diffuse employment patterns (gray dots in ). It should be noted here that identical types may be located in direct neighborhood suggesting that these are not two or more separate (sub-) centers but rather one large densification of the given type.
Although we do not have the data to quantitatively set our empirical results in a broader international context, we believe that the German trajectory of metropolization and morphological restructuring can be clearly distinguished from trends observed in North America. Remarkable differences can be stated with respect to the intensity of economic deconcentration, the territorial outreach of job sprawl in favor of peripheral suburban and exurban locations, and the degree of functional separation of business and residential uses (e.g., Wassmer, Citation2008). Nevertheless, a tendency towards a dispersion of jobs over an extended urban field can be found in German metro areas, too.
Comparisons with other “typology” studies are challenging: contributions focus on the regional level (e.g., Hajrasouliha & Hamidi, Citation2017) or on particular types, such as airport or edge cities (e.g., Appold & Kasarda, Citation2013, Flores-Fillol et al., Citation2016). Yet, the comparisons are imperfect, as these typology studies have different objectives and/or different data sets. Moreover, they are not necessarily referring to a multidimensional notion of urban spatial structure.
One aspect that might explain cross-national differences of the urban spatial structure is the degree of restrictions on market forces induced by local and regional planning. In the German context, growth management through regional and local land use planning is an important factor in explaining regional employment patterns. As we have noted in earlier work, urban density is strictly regulated by local land use and development planning in Germany (see Siedentop, Fina, & Krehl, Citation2016).
However, the interpretation of our empirical findings must consider the shortcomings of a grid data set. In some cases, center territories might be distributed over the area of several adjacent grid cells, with the potential effect of underestimating the centers’ employee density. Although this issue is present in all analyses operating with spatial polygon data, the chances of dividing connected territories of activity increases with greater spatial granularity, and so do the quantitative and qualitative effects these incidental divisions have.
To summarize, our findings argue for the unchanged relevance of agglomeration economies as a driving force of urban spatial structure.Footnote5 However, a sophisticated transportation network and improved metro-wide accessibility might have reduced the need of businesses to cluster near the regional core. In other words, agglomeration economies are present in the clustering of businesses at a regional level but not necessarily in the form of clustering at the neighborhood level. However, even suburban densifications of services – represented by micro types 3 and 4 – can be largely found within relatively close distances of the regional core.
7 Conclusion
Most studies of polycentricity address centers and subcenters as mono-functional spatial entities consisting only of businesses and jobs. From our point of view, this limited conceptualization ignores the variegated nature of subcenter formation in terms of physical outcomes and the local context of development. In reality, centers and subcenters usually contain further urban functions and can take quite different physical shapes. The approach presented here considers the multidimensional nature of urban spatial structure and proposes a quantitatively based typology, which can also be used for comparative studies.
However, we are convinced that it is neither possible nor useful to aim to develop one typology with universal validity. Of course, many of the center types we described in our typology are expected to be found in other European or North American metro regions, too. Yet, in terms of the numbers and sizes of centers, or in terms of urban form and locational attributes, we assume strong context effects, leading to much diversity both within and across nations. More in-depth and international comparative research is needed to gain a deeper understanding of convergent and divergent patterns of urban restructuring and subcentering as well as of context-specific developments and the influence of (spatial planning) cultures on the particular urban configuration and the associated (sub-) center types.
Acknowledgments
This paper’s empirical work originates from the research project ‘The polycentricity of German metropolitan areas – development of a remote sensing-based approach for measuring morphological polycentricity’ funded by the German Research Foundation (DFG, Grant SI 932/4–1 and Grant TA 800/1–1) and conducted at ILS during 2014–2016. Furthermore, the authors would like to thank Dr. Michael Wurm from the German Remote Sensing Data Center (DFD) at the German Aerospace Center (DLR) for providing the data regarding the built environment and Theresa Scholz and Norbert Schanne from the Research Data Centre (FDZ) of the Federal Employment Agency (BA) at the Institute for Employment Research (IAB) for the compilation of the employment data.
Disclosure statement
No potential conflict of interest was reported by the authors.
Additional information
Funding
Notes
1. Unfortunately, time series have not been available on the spatial level of grid cells for employees, residents, and accessibility values. However, previous analyses have shown high correlations among built-up structures and the activity taking place there (e.g., Krehl, Citation2015).
2. All data regarding the built environment have been processed by Dr. Michael Wurm from the German Remote Sensing Data Center (DFD) at the German Aerospace Center (DLR).
3. Kaiser, Meyer and Olkin suggest not including variables below a measure of sampling adequacy of 0.8. This requirement was relaxed here to avoid losing too many variables (see Backhaus, Erichson, Plinke, & Weiber, Citation2011, p. 399).
4. We also made a joint consideration, i.e., we pooled all observations in one large data set (n = 12,054) and performed the same analyses as we did for each region separately (see Appendix B).
5. Although we do not have time series data for all variables to quantitatively “confirm” persistence, we base this persistence interpretation on our local expert knowledge of the study regions. Moreover, other contributions have proven path dependencies – as one form of persistence – to be relevant in other contexts.
References
- Adolphson, Marcus (2010). Kernel densities and mixed functionality in a multicentred urban region. Environment and Planning B: Planning and Design, 37(3), 550–566.
- Agarwal, Ajay (2015). An Examination of the Determinants of Employment Center Growth: Do Local Policies Play a Role? Journal of Urban Affairs, 37(2), 192–206.
- Agarwal, Ajay, Giuliano, Genevieve, & Redfearn, Christian L. (2012). Strangers in our midst: The usefulness of exploring polycentricity. The Annals of Regional Science, 48(2), 433–450.
- Ahlfeldt, Gabriel M. (2011). If Alonso was right: Modeling accessibility and explaining the residential land gradient. Journal of Regional Science, 51(2), 318–338.
- Anas, Alex, Arnott, Richard J., & Small, Kenneth A. (1998). Urban spatial structure. Journal of Economic Literature, 36(3), 1426–1464.
- Anas, Alex, & Kim, Ikki (1996). General Equilibrium Models of Polycentric Urban Land Use with Endogenous Congestion and Job Agglomeration. Journal of Urban Economics, 40(2), 232–256.
- Angel, Shlomo, & Blei, Alejandro M. (2016). The spatial structure of American cities: The great majority of workplaces are no longer in CBDs, employment sub-centers, or live-work communities. Cities, 51, 21–35.
- Appold, Stephen J. (2015). The impact of airports on US urban employment distribution. Environment and Planning A, 47(2), 412–429.
- Appold, Stephen J., & Kasarda, John D. (2013). The Airport City Phenomenon: Evidence from Large US Airports. Urban Studies, 50(6), 1239–1259.
- Arribas-Bel, Daniel, Ramos, Arturo, & Sanz-Gracia, Fernando (2015). The size distribution of employment centers within the US Metropolitan Areas. Environment and Planning B: Planning and Design, 42(1), 23–39.
- Arribas-Bel, Daniel, & Sanz-Gracia, Fernando (2014). The validity of the monocentric city model in a polycentric age: US metropolitan areas in 1990, 2000 and 2010. Urban Geography, 35(7), 980–997.
- Backhaus, Klaus, Erichson, Bernd, Plinke, Wulff, & Weiber, Rolf (2011). Springer-Lehrbuch. Multivariate Analysemethoden: Eine anwendungsorientierte Einführung (13th ed.). Berlin: Springer.
- Baum, Scott, Haynes, Michelle, van Gellecum, Yolanda, & Han, Jung H. (2006). Advantage and Disadvantage across Australia’s Extended Metropolitan Regions: A Typology of Socioeconomic Outcomes. Urban Studies, 43(9), 1549–1579.
- Behrens, Kristian, & Bougna, Théophile (2015). An anatomy of the geographical concentration of Canadian manufacturing industries. Regional Science and Urban Economics, 51, 47–69.
- Berliant, Marcus, & Wang, Ping (2008). Urban growth and subcenter formation: A trolley ride from the staples center to disneyland and the rose bowl. Journal of Urban Economics, 63(2), 679–693.
- Bontje, Marco, & Burdack, Joachim (2005). Edge Cities, European-style: Examples from Paris and the Randstad. Cities, 22(4), 317–330.
- Bourne, Larry S. (2008). On Schools of Thought, Comparative Research, and Inclusiveness: A Commentary. Urban Geography, 29(2), 177–186.
- Bundesagentur für Arbeit (BA). (2014). Statistische Geheimhaltung: Rechtliche Grundlagen und fachliche Regelungen der Statistik der Bundesagentur für Arbeit. Nürnberg: Bundesagentur für Arbeit Statistik.
- Bundesinstitut für Bau-, Stadt- und Raumforschung (BBSR). (2012a). Arbeitsmarktregionen. Retrieved from http://www.bbsr.bund.de/BBSR/DE/Raumbeobachtung/Raumabgrenzungen/AMR/Arbeitsmarktregionen.html?nn=443270
- Bundesinstitut für Bau-, Stadt- und Raumforschung (BBSR). (2012b). Großstadtregionen. Retrieved from http://www.bbsr.bund.de/BBSR/DE/Raumbeobachtung/Raumabgrenzungen/Grossstadtregionen/Grossstadtregionen.html?nn=443270
- Carruthers, John I., Lewis, Selma, Knaap, Gerrit-Jan, & Renner, Robert N. (2010). Coming undone: A spatial hazard analysis of urban form in American metropolitan areas. Papers in Regional Science, 89(1), 65–88.
- Craig, Steven G., Kohlhase, Janet E., & Perdue, Adam W. (2016). Empirical Polycentricity: The Complex Relationship between Employment Centers. Journal of Regional Science, 56(1), 25–52.
- Davoudi, Simin (2003). EUROPEAN BRIEFING: Polycentricity in European spatial planning: From an analytical tool to a normative agenda. European Planning Studies, 11(8), 979–999.
- Duranton, Gilles, & Puga, Diego (2015). Urban Land Use. In G. Duranton, J.V. Henderson, & W.C. Strange (Eds.), Handbook of Regional and Urban Economics (5A, pp. 467-560). Amsterdam: Elsevier..
- Einig, Klaus, & Guth, Dennis (2005). Neue Beschäftigtenzentren in deutschen Stadtregionen: Lage, Spezialisierung, Erreichbarkeit. Raumforschung und Raumordnung, 63(6), 444–458.
- Eurostat. (2014). GEOSTAT 2011 grid dataset. Retrieved from http://ec.europa.eu/eurostat/web/gisco/geodata/reference-data/population-distribution-demography
- Fishman, Robert (1987). Burgeois Utopias: The Rise and Fall of Suburbia. New York: Basic Books.
- Flores-Fillol, Ricardo, Garcia-López, Miquel-Àngel, & Nicolini, Rosella (2016). Organization of Land Surrounding Airports: The Case of the Aerotropolis. Land Economics, 92(1), 57–81.
- Fujii, Tadashi, & Hartshorn, Truman A. (1995). The Changing Metropolitan Structure of Atlanta, Gerogia: Locations of Functions and Regional Structure in a Multinucleated Urban Area. Urban Geography, 16(8), 680–707.
- Garcia-López, Miquel-Àngel (2010). Population suburbanization in Barcelona, 1991–2005: Is its spatial structure changing? Journal of Housing Economics, 19(2), 119–132.
- Garreau, Joel (1992). Edge city: Life on the new frontier (1st ed.). New York: Anchor Books.
- Giuliano, Genevieve, Redfearn, Christian L., Agarwal, Ajay, LiChen, & Zhuang, Duan (2007). Employment concentrations in Los Angeles, 1980–2000. Environment and Planning A, 39(12), 2935–2957.
- Giuliano, Genevieve, & Small, Kenneth A. (1991). Subcenters in the Los Angeles Region. Regional Science and Urban Economics, 21(2), 163–182.
- Glaeser, Edward L., & Gottlieb, Joshua D. (2006). Urban Resurgence and the Consumer City. Urban Studies, 43(8), 1275–1299.
- Glaeser, Edward L., Kallal, Hedi D., Scheinkman, José A., & Shleifer, Andrej (1992). Growth in Cities. Journal of Political Economy, 100(6), 1126–1152.
- Gordon, Peter, & Richardson, Harry W. (1996). Beyond Polycentricity: The Dispersed Metropolis, Los Angeles, 1970–1990. Journal of the American Planning Association, 62(3), 289–295.
- Green, Nick (2007). Functional Polycentricity: A Formal Definition in Terms of Social Network Analysis. Urban Studies, 44(11), 2077–2103.
- Hajrasouliha, Amir H., & Hamidi, Shima (2017). The typology of the American metropolis: monocentricity, polycentricity, or generalized dispersion?. Urban Geography, 38(3), 420–444.
- Hall, Peter G. (2001). Global City-Regions in the Twenty-first Century. In A.J. Scott (Ed.), Global city-regions: Trends, theory, policy (pp. 59–77). Cambridge, UK, New York: Oxford University Press.
- Hall, Peter G., & Pain, Kathy (2006). The Polycentric Metropolis: learning from mega-city regions in Europe. London: Earthscan.
- Helbrecht, Ilse, & Dirksmeier, Peter (2009). New Downtowns — Eine neue Form der Zentralität und Urbanität in der Weltgesellschaft. Geographische Zeitschrift, 97(2/3), 60–76.
- Hohenberg, Paul M. (2004). The historical geography of European cities: An interpretive essay. In J.V. Henderson & J.-F. Thisse (Eds.), Handbook of Regional and Urban Economics: Cities and Geography (Vol. 4, 1st ed., pp. 3021–3052). Amsterdam: Elsevier.
- Kantor, Yuval, Rietveld, Piet, & van Ommeren, Jos (2014). Towards a general theory of mixed zones: The role of congestion. Journal of Urban Economics, 83, 50–58.
- Knapp, Wolfgang, & Volgmann, Kati (2011). Neue ökonomische Kerne in nordrhein-westfälischen Stadtregionen: Postsuburbanisierung und Restrukturierung kernstädtischer Räume. Raumforschung und Raumordnung, 69(5), 303–317.
- Krehl, Angelika (2015). Urban Spatial Structure: An Interaction between Employment and Built-up Volumes. Regional Studies, Regional Science, 2(1), 290–308.
- Krehl, Angelika (2016). Analyzing Polycentricity: Conceptual Issues and Methodological Challenges ( Dissertation). Technische Universität Dortmund, Dortmund. http://hdl.handle.net/2003/36055
- Krehl, Angelika (2018). Urban subcentres in German city regions: Identification, understanding, comparison. Papers in Regional Science, 97(1), S79–S104.
- Krehl, Angelika, Siedentop, Stefan, Taubenböck, Hannes, & Wurm, Michael (2016). A Comprehensive View on Urban Spatial Structure: Urban Density Patterns of German City Regions. ISPRS. International Journal of Geo-Information, 5(6), 76.
- Lang, Robert, & Knox, Paul K. (2009). The New Metropolis: Rethinking Megalopolis. Regional Studies, 43(6), 789–802.
- Lang, Robert E., & LeFurgy, Jennifer B. (2003). Edgeless cities: Examining the Noncentered metropolis. Housing Policy Debate, 14(3), 427–460.
- Lang, Robert E., & LeFurgy, Jennifer B. (2007). James A. Johnson metro series. Boomburbs: The rise of America’s accidental cities. Washington, D.C.: Brookings Institution Press.
- Lee, Bumsoo (2007). “Edge” Or “Edgeless” Cities? Urban Spatial Structure in U.S. Metropolitan Areas, 1980 to 2000. Journal of Regional Science, 47(3), 479–515.
- Leslie, Timothy F. (2010). Identification and Differentiation of Urban Centers in Phoenix Through a Multi-Criteria Kernel-Density Approach. International Regional Science Review, 33(2), 205–235.
- Martin, Ron (2014). Path Dependence and the Spatial Economy: A Key Concept in Retrospect and Prospect. In M.M. Fischer & P. Nijkamp (Eds.), Handbook of Regional Science (pp. 609–629). Berlin Heidelberg: Springer.
- McMillen, Daniel P. (2001). Nonparametric Employment Subcenter Identification. Journal of Urban Economics, 50(3), 448–473.
- McMillen, Daniel P., & Lester, T. W. (2003). Evolving subcenters: Employment and population densities in Chicago, 1970–2020. Journal of Housing Economics, 12(1), 60–81.
- McMillen, Daniel P., & McDonald, John F. (1999). Land use before zoning: The case of 1920’s Chicago. Regional Science and Urban Economics, 29(4), 473–489.
- McMillen, Daniel P., & Smith, Stefani C. (2003). The number of subcenters in large urban areas. Journal of Urban Economics, 53(3), 321–338.
- Meijers, Evert J. (2007). Clones or Complements? The Division of Labour between the Main Cities of the Randstad, the Flemish Diamond and the RheinRuhr Area. Regional Studies, 41(7), 889–900.
- Melo, Patricia C., Graham, Daniel J., Levinson, David, & Aarabi, Sarah (2017). Agglomeration, accessibility and productivity: Evidence for large metropolitan areas in the US. Urban Studies, 54(1), 179–195.
- Muñiz, Ivan, & Garcia-López, Miquel-Àngel (2010). The Polycentric Knowledge Economy in Barcelona. Urban Geography, 31(6), 774–799.
- Muñiz, Ivan, Garcia-López, Miquel-Àngel, & Galindo, Anna (2008). The Effect of Employment Sub-centres on Population Density in Barcelona. Urban Studies, 45(3), 627–649.
- Parr, John B. (2002). Missing elements in the analysis of agglomeration economies. International Regional Science Review, 25(2), 151–168.
- Parr, John B. (2014). The Regional Economy, Spatial Structure and Regional Urban Systems. Regional Studies, 48(12), 1926–1938.
- Percoco, Marco (2014). Path dependence, institutions and the density of economic activities: Evidence from Italian cities. Papers in Regional Science, 93(1), 53–76.
- Phelps, Nicholas A. (2012). The Growth Machine Stops? Urban Politics and the Making and Remaking of an Edge City. Urban Affairs Review, 48(5), 670–700.
- Riguelle, François, Thomas, Isabelle, & Verhetsel, Ann (2007). Measuring urban polycentrism: A European case study and its implications. Journal of Economic Geography, 7(2), 193–215.
- Roca Cladera, Josep, Marmolejo Duarte, Carlos R., & Moix, Montserrat (2009). Urban Structure and Polycentrism: Towards a Redefinition of the Sub-centre Concept. Urban Studies, 46(13), 2841–2868.
- Romero, Vicente, Solís, Eloy, & Ureña, José M. De (2014). Beyond the metropolis: New employment centers and historic administrative cities in the Madrid global city region. Urban Geography, 35(6), 889–915.
- Sarzynski, Andrea, Galster, George, & Stack, Lisa (2014). Typologies of sprawl: Investigating United States metropolitan land use patterns. Urban Geography, 35(1), 48–70.
- Sarzynski, Andrea, Hanson, Royce, Wolman, Harold, & McGuire, Michael (2005). All centers are not equal: an exploration of the polycentric metropolis (GWIPP WORKING PAPER SERIES No. 015). Washington, D.C. Retrieved from George Washington Institute of Public Policy website: http://www.gwu.edu/%7Egwipp/papers/wp015.pdf
- Scott, Allen J., & Storper, Michael (2015). The Nature of Cities: The Scope and Limits of Urban Theory. International Journal of Urban and Regional Research, 39(1), 1–15.
- Shearmur, Richard G., & Coffey, William J. (2002a). A Tale of Four Cities: Intrametropolitan Employment Distribution in Toronto, Montreal, Vancouver, and Ottawa – Hull, 1981 – 1996. Environment and Planning A, 34(4), 575–598.
- Shearmur, Richard G., & Coffey, William J. (2002b). Urban Employment Subcenters and Sectoral Clustering in Montreal: Complementary Approaches to the Study of Urban Form. Urban Geography, 23(2), 103–130.
- Siedentop, Stefan, Fina, Stefan, & Krehl, Angelika (2016). Greenbelts in Germany’s regional plans—an effective growth management policy? Landscape and Urban Planning, 145, 71–82.
- Small, Kenneth A., & Song, Shunfeng (1994). Population and Employment Densities: Structure and Change. Journal of Urban Economics, 36(3), 292–313.
- Spencer, Gregory M. (2015). Knowledge Neighbourhoods: Urban Form and Evolutionary Economic Geography. Regional Studies, 49(5), 883–898.
- Statistisches Bundesamt (Destatis). (2008a). Bevölkerung und Erwerbstätigkeit: Struktur der sozialversicherungspflichtig Beschäftigten (Fachserie 1 Reihe 4.2.1). Wiesbaden: Statistisches Bundesamt.
- Statistisches Bundesamt (Destatis). (2008b). Structure of the Classification of Economic Activities, Edition 2008 (WZ 2008). Wiesbaden: Statistisches Bundesamt.
- Turok, Ivan, & Mykhnenko, Vlad (2007). The trajectories of European cities, 1960–2005. Cities, 24(3), 165–182.
- van Meeteren, Michiel, Poorthuis, Ate, Derudder, Ben, & Witlox, Frank (2016). Pacifying Babel’s Tower: A scientometric analysis of polycentricity in urban research. Urban Studies, 53(6), 1278–1298.
- Wassmer, Robert W. (2008). Causes of urban sprawl in the United States: Auto reliance as compared to natural evolution, flight from blight, and local revenue reliance. Journal of Policy Analysis and Management, 27(3), 536–555.
- Wurm, Michael, d’Angelo, Pablo, Reinartz, Peter, & Taubenböck, Hannes (2014). Investigating the applicability of Cartosat-1 DEMs and topographic maps to localize large-area urban mass concentration. IEEE Journal of Selected Topics in Applied Earth Observations and Remote Sensing (J-STARS), 7(10), 4138–4152.
- Yang, Jiawen, French, Steven, Holt, James, & Zhang, Xingyou (2012). Measuring the Structure of U.S. Metropolitan Areas, 1970–2000. Journal of the American Planning Association, 78(2), 197–209.
- Yin, Robert K. (2009). Applied social research methods series: Vol. 5. Case study research: Design and methods (4th ed.). Los Angeles: Sage.
Appendix A
Appendix B
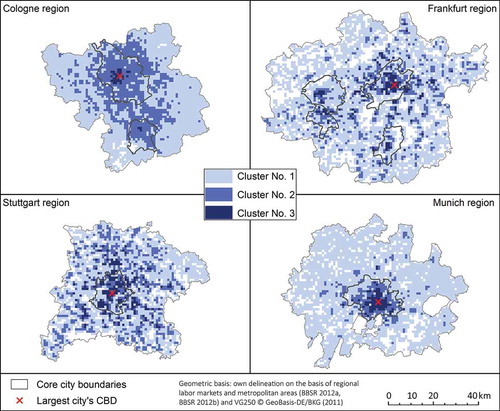
We use the joint consideration to support the macro layer of our typology. Additionally, this consideration provides valuable information regarding comparative issues among the four study regions, such as the “strength” of the core clusters. Looking at the joint cluster solution indicates a core-periphery pattern for all regions (Fig B). While Cluster 3 is very small and geographically concentrated, the remaining clusters are much larger and more dispersed. Cluster 2 seems to follow axes such as highways or river valleys in both mono- and polycentric regions. Cluster 1, in contrast, represents rather rural parts of the regions with low job and population densities. Thus, comparing and underlines that few very densely built-up and economically strong grid cells exist in each region. These grid cells are those in Cluster 3 in the joint consideration. Their number is much smaller than the sum of the Cluster 3 grid cells of each single region.
Figure B. Mapping of the 3-cluster solution after a joint analysis of all study regions (Source: Own elaboration based on the data described above).