
 ?Mathematical formulae have been encoded as MathML and are displayed in this HTML version using MathJax in order to improve their display. Uncheck the box to turn MathJax off. This feature requires Javascript. Click on a formula to zoom.
ABSTRACT
In this contribution, we analyze residential segregation not just on the basis of dimenions of migration background and income but also according to educational level, class fractions, labor market status, and the employment sector . We use individual-level geocoded data for the entire population of the Metropolitan Area of Amsterdam to analyze residential orientations of households at eight different neighborhood types based on different levels of social mix, taking into account their employment sector, their age, educational attainment, income, type of contract, and migration background. We find that segregation based on income is relatively moderate but segregation on the basis of migration background and educational attainment level is relatively high. Multinomial regression models show that different class fractions are oriented to very different residential milieus. We conclude that a combination of dimensions of social positions yields a more nuanced and better conceptual framework for understanding the social geographies of urban areas.
Introduction
In the international literature, we see persistent attention for the study of (spatial) segregation and fragmentation of urban societies. Segregation seems to be increasing and deepening spatial inequality is giving rise to social marginality (Agier, Citation2009; Musterd, Citation2008; Wacquant, Citation2008). Studies show processes of upper-class disaffiliation from those who do not have the required resources (Atkinson, Citation2006; Atkinson & Flint, Citation2004). Disaffiliation manifests in the residential domain (Tammaru, Marcinczak, van Ham, & Musterd, Citation2016), but affects other domains as well, such as schooling, work, public space, leisure, and even the mode of transport people choose (Åslund & Skans, Citation2010; Boterman & Musterd, Citation2016; Moretti, Citation2012; Valentine, Citation2008; Wang, Li, & Chai, Citation2012; Van Ham & Tammaru, Citation2016). In this paper, we will focus the attention on the residential domain and aim to expand the knowledge of residential segregation through inclusion of other (sub) dimensions. Classic and still important dimensions to deal with comprise “race and class” distinctions, including differences in terms of ethnicity and socioeconomic class. However, due to the shift of urban economies from post-industrial to knowledge-based in most cities of the Global North, other sub-dimensions have gained weight. In the socioeconomic sphere, the professional background is playing a bigger role (Préteceille, Citation2003; Préteceille & Cardoso, Citation2020), while there is also more discussion on the potential impact of cultural distinction based on education (for example, Boterman, Manting, & Musterd, Citation2018). In this paper, we also will address these professional and cultural dimensions, without leaving the others out. We therefore will discuss residential segregation based on migration background, income, educational level, labor market status, and the employment sector one is active in, and some combinations of those dimensions.
In the Netherlands, spatial inequality – although moderate – is growing. The Dutch welfare state still provides a rather strong buffer against social inequality, especially income-inequality, but this buffer is eroding. Income redistribution policies are still in place via a progressive income tax system, while the educational system guarantees equal access opportunities to all pupils. But there are also policies in other domains that result in increasing inequality. Some housing market regulations, such as the mortgage rent tax deduction system, are particularly benefitting the better off. Other regulations, such as individual rent subsidies are benefitting lower income households. However, the reduction of the relatively large Dutch social housing sector and neoliberal policies aimed at implementing stricter allocation rules for social housing, more rigorously only targeting the poorest households, resulted in increasing inequality. Spatial inequality is also directly addressed by other policies such as anti-segregation and pro-social mix policies. They are still in place in cities, although gradually declining. However, critical voices argue that such social mixing is stimulating spatial gentrification processes instead of diminishing segregation. Ultimately such policies would widen social gaps instead of diminishing them (Bridge, Butler, & Lees, Citation2011). Policies in the educational system promote inequality indirectly as well, both in the Netherlands and Europe (see a recent Urban Studies special issue on school segregation in contemporary cities (Boterman, Musterd, Pacchi, & Ranci, Citation2019)). Finally, structural path dependencies, such as the recent growth of larger cities – like Amsterdam – have a strong impact on spatial segregation patterns as well. In theory, these impacts can go either way: decreasing or increasing spatial inequality. Because it is difficult to increase housing supply in the short run as a reaction to rising demands vast inner-city areas will experience much higher real estate prices, which are only accessible for higher income households. Lower- and middle-income groups run the risk to be forced moving out to less attractive locations (Buitelaar, Weterings, & Ponds, Citation2017).
In this article, we will analyze segregation patterns in the metropolitan area of Amsterdam, focusing on different social dimensions. We believe it is important to raise the question how efforts to reduce spatial inequality relate to cleavages and differentiation beyond well-studied dimensions (race/ethnicity; social economic status), most pertinently cultural dimensions of social class. Post-industrial societies are increasingly fragmenting and polarizing socially and politically not necessarily by income, but rather by level of education and other forms of cultural capital (Bourdieu & Passeron, Citation1990; Savage et al., Citation2013). This has also been observed in the Netherlands (SCP, Citation2014). Higher educated professionals who participate in and take advantage of the internationalization of the labor market, of consumption, and of mobility are the “winners” of globalization, while lower educated are increasingly faced with uncertainties in their lives and are also politically mobilizing to voice their concerns. The main fault lines of post-industrial societies are increasingly associated with social and particularly cultural forms of capital. Cultural capital, however, exists in institutionalized and more embodied forms, which are closely related to taste and the valorizing and recognizing of specific practices (Bourdieu & Passeron, Citation1990). Any “redistribution” of cultural capital, if possible at all, concerns those forms of cultural capital that are institutionalized, which are primarily accumulated through the educational system. “Redistribution” of cultural capital, understood here as a highly democratized and egalitarian educational system, however, may be at odds with meritocratic principles in education. The Dutch educational system, for instance, is based on testing of cognitive skills and early selection and on the very idea of stratification of educational levels (Van de Werfhorst & Mijs, Citation2010). Although educational systems based on meritocracy have played a key part in facilitating the social mobility of working-class groups (Boudon, Citation1974) educational attainment now seems in many respects a more dominant source of social stratification than income by favoring social reproduction of the upper and middle classes (Bourdieu & Passeron, Citation1990). In this contribution, we will thus also highlight the spatial dimension of inequality by education. Secondly, because of the transition from a manufacturing-based economy to a post-industrial economy characterized by a knowledge-based economy, the composition of the employed population changed; new professions emerged in central cities due to new economic activities. Several scholars showed how post-industrial economies in global cities go together with a concentration of high-paid and low paid workers. And thus, there is growing evidence that occupation is another important dimension of human capital with consequences for social and spatial inequality (Boterman et al., Citation2018; Boterman & Musterd, Citation2017; Florida & Mellander, Citation2018). In short, spatial inequality is increasingly based on other combinations of different forms of human capital besides income and ethnicity. It is therefore important to study the relationship between social and spatial inequalities from a multi-dimensional perspective, with a special focus on the dimensions of educational attainment and employment. We pose the following research questions:
How is the Metropolitan Area of Amsterdam (MRA) segregated along different social dimensions (educational attainment, profession, income, and ethnicity)?
What is the probability of living in neighborhoods with different class compositions and how is this differentiated across educational attainment, profession, income, and ethnicity?
In the next section, we start with a discussion of the dimensions of distinction between classes based on income, education, and occupation and how these are conditioned by various mechanisms and are translated in spatial patterns in metropolitan contexts. The research questions will be the basis for an empirical investigation of the spatial inequality of different, possibly related, social categories in Amsterdam and in its metropolitan area. After an introduction of the data and methods applied, we will present essential empirical findings, followed by conclusion and discussion.
Dimensions of (spatial) inequality
Inequalities between population categories as well as spatial inequalities may have significant impacts on people’s lives and opportunities. There are important reasons for paying attention to such inequalities. Classic (spatial) inequality studies frequently include socio-economic variations, ethnic-cultural difference, and demographic factors (cf. Robson, Citation1975). Although these dimensions are not unrelated, they are not seen as equally problematic or relevant or a reason to intervene.
Notably, demographic transformations have spatial consequences and produce highly visible specific spatial patterns, but they are seldom regarded as a reason to intervene. Dynamic variations in demographic terms are mostly due to changes in the life course and usually seen as common, inevitable, a matter of own choice, and not an issue for politics. Across western welfare states, there is also a large degree of similarity in which life courses unfold. For instance, postponement of childbirth and lower fertility, declining marriage rates and rising divorce rates as well as aging are demographic trends that are observed across the developed world.
In most of the debates on inequality and segregation, the focus has been on racial and ethnic dimensions. Ample attention has been given to the (spatial) segregation of migrant and non-migrant population categories, often referred to as “ethnic” segregation. In several European countries like the Netherlands, this type of segregation associated with immigration has dominated the public and political discourses on spatial inequality. Even though the attention has frequently been directed to ethnic segregation, it is uncommon to develop official policies directly aiming at reducing that type of segregation. In the Netherlands, this would even be in conflict with the Constitution, which is forbidding discrimination based on race or country of origin. Nevertheless, there are policy efforts indirectly aiming at a reduction of ethnic spatial segregation, for example, by including the share of “non-western” migrants as a “negative” in indices of the “quality” of neighborhoods (Van Gent & Musterd, Citation2016). Since neighborhood income in the Dutch context is strongly correlated with the ethnic composition, ethnic segregation is often addressed through income-based interventions (Van Gent & Musterd, Citation2016).
Income segregation is often also seen as a problematic in its own right, as is described in contemporary literature on the role of upper- and middle-class groups in urban transformations (Atkinson, Citation2006; Boterman & Musterd, Citation2017; Musterd & Van Gent, Citation2016). In the Netherlands, much income redistribution policies aim at diminishing (spatial) income inequality (in)directly, as was described above. Moretti (Citation2012) and Sassen (Citation1991, Citation2014) postulated that post-industrial economies in global cities go together with a concentration of the high-paid and low paid workers. Because of the transition from a manufacturing-based economy to a post-industrial economy characterized by a knowledge-based economy, the composition of the employed population changed (Burgers & Musterd, Citation2002; Florida, Citation2002; Hamnett, Citation2003; Van der Waal & Burgers, Citation2009) and spatial segregation of the employed population increased (Boterman et al., Citation2018; Florida & Mellander, Citation2018). Economic activities requiring face-to-face contact, such as in the financial, creative, and public sectors, have increased in the core of larger cities, whereas labor-intensive manufacturing in smaller towns and cities has declined over the years. The newly emerging economic geography of cities in turn seems to translate into a different social make-up, given that it also leads to residential segregation of certain types of employees. This has often been linked to the different residential preferences of new types of employees, referred to as the “new middle class” (Butler, Citation2007; Ley, Citation1996) or the “creative class” (Florida, Citation2002). Boterman and Musterd (Citation2017), (Citation2018) demonstrated that urban orientation differs substantially between economically orientated class fractions in several Dutch cities. Employees in cultural sectors working in the new economies have a stronger urban orientation than those working in the old economies who prefer the suburbs. Irrespective of income, they showed substantial variegated residential orientations in six urban regions in the Netherlands. Also in other contexts social (spatial) inequality is now investigated with more detail and rigor than before (Andersson & Kährik, Citation2016; Musterd & Van Gent, Citation2016; Wessel, Citation2016). In this paper, we continue this research including ethnic, socio-economic dimension(s) and the (social) cultural dimension(s) simultaneously. We will address the ethnic dimension by country of origin, the socio-economic dimension(s) mainly through an analysis of individual gross-incomes and the (social) cultural dimension(s) by the level of education and the employment sector people are working in. These dimensions are obviously closely related, but we argue that they nonetheless should be considered separately from each other. Income is a good indication for economic forms of capital, while level of education and employment sector may be an important precondition for the accumulation of economic capital but should also and maybe even predominantly be an indicator of social and cultural capital.
As social cultural fragmentation seems to rise and higher and lower educated are drifting apart in terms of value systems, political attitudes, and life styles, spatial segregation based on these cleavages is likely to be on the rise. Residents increasingly sort themselves across urban space and distinguish themselves based on (social) cultural attributes. On the other hand, income and wealth are important conditions for making private choices. Although this trend has been signaled at the national level (Savage, Citation2015), less is known about urban segregation on such grounds. Based on much qualitative work, primarily from studies on the urban middle classes, it has been suggested that different residential milieus are attractive for different subgroups within the middle classes (Boterman, Citation2012; Bridge, Citation2006; Butler & Robson, Citation2003; Rose, Citation1984; Van Criekingen & Decroly, Citation2003). These class fractions, distinguished by the relative sums of cultural economic and social capital, are sorting out into different residential areas of the city (Butler & Robson, Citation2001). This process by which these middle-class fractions reflexively select neighborhoods that befit their habitus is referred to as elective belonging, which is contrasted with the nostalgic perspective on home and neighborhood of less mobile, often working class, groups (Savage, Citation2010; Savage, Barlow, & Longhurst, Citation2005). Although this work on social-cultural difference, through Bourdieu’s concepts of habitus and field, shows increasingly sensitivity to the role of space, knowledge about the geography, the places, of these emerging social-cultural inequalities and how they are connected to other dimensions of inequality is limited (see Boterman & Musterd, Citation2017). As we already mentioned, recent studies show that occupational fractions are also clustered into certain residential metropolitan areas. In this paper, we want to analyze both old (income, ethnicity) as well as newly emerging dimensions of inequality (professions, education, labor market status, and class fractions).
Data and key variables
The basis for the analysis is an individual level data set with information for each of the 17 million registeredFootnote1 residents of the Netherlands: The System of Social Statistical Databases (SSD) of Statistics Netherlands. This data set makes it possible to analyze the entire population of the metropolitan area of Amsterdam, instead of a sample. We made some selections. First, we selected all registered residents in the metropolitan area of Amsterdam (MRAFootnote2). We focus on the situation in 2016, but also did the analyses for 2006. This offered the opportunity to analyze patterns before and after the economic crisis. We thus selected residents who lived in the MRA in 2006 or in 2016. We wanted to exclude students. This is why we selected only residents older than 24 years. From this group, we worked with a sub-selection of the employed population. This is a sample of 948,000. The final data set – in which records with missings are excluded – used for the multinomial models contains 892,000 employed residents of the MRA in 2016.
We used the dataset of 1.7 million individuals in 2016 and the dataset of 1.6 million individuals in 2006 to calculate segregation indices (SI) along different dimensions of social class: income; ethnicity, educational attainment; class fraction; type of contract; and for employment sector. In doing so, we give attention both to classical dimensions of segregation (income, ethnicity) and new dimensions of segregation (education, class fraction, employment sector). Although further refinement is possible we consider these dimensions good proxies for economic capital and cultural capital.
Income is defined as gross yearly household income, based on percentiles of the national income level distribution. We defined four categories: low income (up till the 30th percentile); lower middle (30–60); upper middle (60–80); and high (top 20%). We added the top 10% for additional comparison (not used in the models).
Educational attainment is divided into five categories: just primary school (low), secondary vocational education, higher administrative and secondary education (vocational), bachelor level (higher vocational); university masters (university) and University degree and -if applicable- a partner also with a University degree.
Since combinations of capital are associated with different class fractions (Bourdieu, Citation1984; Savage, Citation2015) we combine educational attainment and income to so-called class fractions. We defined them according to the matrix below ().
Table 1. Typology of social class status by income and education
Labor market status is defined by a combination of income and labor market status (temporary or permanent position). This leads to the following categories; lower paid work with a temporary or permanent contract, middle income with a temporary contract, high incomes with a temporary contract and middle or high incomes with a permanent contract.
We classified employees into 19 economic sectors based on the International Standard Industrial Classification of All Economic Activities (SBI2008). Most of the categories are based on the general one-digit international classification (such as agriculture), but since earlier research reveals significant differences within the larger categories, other employment sectors such as lawyers and creative workers were based on the more detailed standardized 5-digit SBI codes. These different levels of detail are driven by the expectation that more specific residential orientations would be connected to these specific sectors.
Moreover, we constructed a neighborhood typology based on a mix of income and education because we intend to analyze the neighborhood type orientations of individual households within the MRA. Eight neighborhoods were constructed, ranking from very high to low social class neighborhoods. This is based on the degree of social mix in terms of income and educational attainment. A ratio of low income and high income was used to define three types of neighborhoods: homogenously poor (low income outnumbered high/middle income by a factor two or more), homogeneously affluent (high income outnumbered high income by a factor two or more) and a remaining mixed category. A similar dimension was made for educational attainment: homogenously high education (if highly educated outnumbered lower educated by a factor two or more), lower educated (low education outnumbered the share of highly educated by a factor two or more) and a remaining mixed category. These two categories were combined to one. Because of very low number for the homogeneously low income, homogeneously highly educated combination, this category was merged with low income, and mixed education. The eight resulting neighborhoods’ types were then used as the dependent variable of multinomial logistic regression models.
Methods
We estimated two multinomial logistic regression models to analyze the sorting of different class fractions into the eight neighborhood types. Other independent variables included individual attributes such as age, migration background, and labor market status. In the first model sector, income and educational attainment were included separately (see Model 1 Appendix). The second model did not include income and educational attainment but included the combination variable class fraction (Model 2 in the Appendix). The outcomes of these models were used to calculate the margins by income, ethnicity, educational attainment, class fraction, and employment sector. The empirical section uses the resulting predicted probabilities for the different neighborhood outcomes extracted from the multinomial logistic regressions. The probabilities of living in the eight specific neighborhood types add up to 100% (everybody lives in either of the eight). The probabilities we present in the figures are thus corrected for all other individual characteristics. In this section five different sets of probabilities are presented via these figures: first, for income classes; second, for educational attainment; third, for ethnicity, fourth for the combination of these two (“class fractions”); and fifth, for employments sectors. The full models are in the Appendix.
Also, we calculated the segregation index (SIFootnote3) for the economic and cultural dimensions. This measure is widely used as an indicator for how strong the spatial distribution of a group deviates from the average size of the group in the entire area. It runs from 0 to 1, where 1 indicates total segregation from the rest and 0 a completely balanced distribution. As a rule of thumb below 20 is low; 20–40 is moderate and above 40 is high (Massey & Denton, Citation1988). These indications are somewhat lower than for the dissimilarity index, which compares two more specific groups simultaneously and thus is more likely to have higher scores. We used the SI mainly to compare the different dimensions with each other, in which the size of the compared groups should not matter. To gauge the degree of spatial sorting along different dimensions, we calculated the SI for the metropolitan area of Amsterdam, in 2006 and 2016, based on 850 neighborhoods, which have at least 100 inhabitants per neighborhood ().Footnote4 We calculated the indices for individual income; ethnicity; educational attainment; class fractions; type of contract; and employment sector of the employee.
Empirical findings: segregation levels
The frequencies give a picture of the dataset and the distribution of the population. In , the distribution of the residents of the metropolitan area of Amsterdam for the relevant variables in 2006 and 2016 is shown, in percentages.
Table 2. Employees, aged 24 and above, living in the metropolitan area of Amsterdam in 2016, in percentages
Table 3. Segregation Indices (SI) 2006–2016 Amsterdam metropolitan area
The total number of people older than 24, living in the metropolitan area of Amsterdam in 2016 in our selection is 1,716,434. About 28% of this population has a gross personal income that belongs to the top 20% of the highest income population in the Netherlands. The combination of high education and low income is small. It should be noted that we have excluded all those who are younger than 24 years. The proportion of residents working in construction or law or child care is relatively low, whereas the proportion of working in the business service, the lower services, or health care is somewhat higher. About two-thirds are native Dutch, whereas the number of western migrants among the non-Dutch natives is the highest with 13%.
The segregation indices are presented for 2006 and 2016 for the metropolitan area of Amsterdam. The indices changed a bit between these two years but remain rather stable (income segregation varied from .12 to .30 in 2006). Ten years later, it ranges from .13 to .31. Income segregation turns out to be moderate to low in the metropolitan area of Amsterdam. Educational attainment gives a fairly similar picture, but the variation is somewhat larger. The least segregated are those with a vocational education level, the most segregated are couples both having a university degree.
We expected that a combination of income and educational level would lead to higher segregation indices. However, it does not yield more distinct patterns. Upper- and lower-class fractions are similarly segregated. Individuals with a lower educational level and a middle income appear the least segregated. Finally, those with a low income and highly educated combination have a more distinct spatial pattern. If we look at the labor market status, segregation indices are again moderate. In this case, segregation indices declined a bit between 2006 and 2016. If we look at the sector residents of the MRA are employed in, we see that those employed in health care, retail or in primary and general education are the least segregated, whereas those working in construction, law or in the higher educational system have the highest segregation levels. Finally, the segregation indices among those with a Moroccan, Turkish, Surinamese, or Antillean migration background show that ethnic segregation is relatively high compared to the other forms of segregation. Especially people with a Moroccan, Turkish, or Surinamese background, representing the largest ethnic groups in Amsterdam, are highly concentrated in (parts of) the urban core and highly underrepresented in other, more suburban, neighborhoods. This classical segregation dimension thus cannot be ignored when studying segregation in the metropolitan area of Amsterdam. However, since our focus is to understand the importance of new dimensions in segregation, we will focus hereafter on the other new dimensions. Given the small differences between 2006 and 2016, we present figures for 2016 only.
Regarding the spatial segregation by employment sector, shows the location quotients of a selection of eight employment sectors for the metropolitan area in Amsterdam in 2016. This figure is derived from the sub-selection of the employed population, containing 948,000 employed residents of the MRA in 2016 (see also ). It becomes clear that the employees of different sectors are concentrated in different parts of the region. Employees working in the construction sector live more often in the suburbs of the region, whereas employees working in the higher educational system or working in the creative sector tend to cluster in the core of the city.
Figure 1. Over- and underrepresentation (location quotient) of people working in a selection of employment sectors in the metropolitan area Amsterdam 2016
Boterman et al. (Citation2018) showed that those who are employed in the construction sector are living more often in suburbs, not only in Amsterdam but in other large cities of the Netherlands as well. It is clear from that employees in ICT are not overrepresented in specific neighborhoods. The same goes for employees in lower service jobs and primary education.
Spatial sorting
The spatial orientation of individual and households is based on multinomial regression analysis and subsequent calculation of predicted probabilities of living in one of the eight neighborhood types that were distinguished in the metropolitan area of Amsterdam in 2016 (see Appendix for full model outcomes). The probabilities are corrected for a set of individual characteristics that may also impact the orientations. Five figures are presented, using outcomes of five different models: first, for income classes; second, for ethnicity, third, for educational attainment; fourth, for the combination of these income and education (“class fractions”); and fifth, for employments sectors. The probabilities of living in the eight specific neighborhood types add up to 100% (everybody lives in one of the eight).
shows the probabilities of living in a type of neighborhood for different income groups.
Figure 2. Predicted probability of living in neighborhood types in the MRA, by income class, 2016
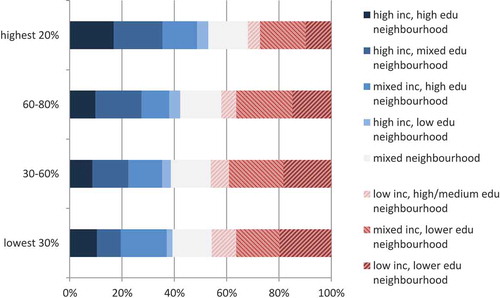
It shows that differences between the various income groups are moderate but substantial. For instance, individuals in high-income households have a higher probability to live in the most upper-class milieus (high inc/high edu neighborhoods) than lower income groups, but the difference is only seven percent points. Also, higher incomes live less in lower status areas (low inc/low edu) than lower income groups, but only about ten percent points less. Generally, most people live in areas that are mixed. So, in terms of income spatial differentiation is not very strong.
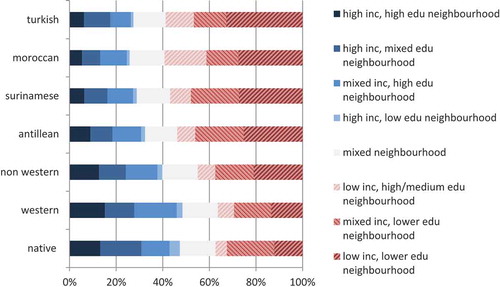
The migration background is far more important. shows that those with a native Dutch background cluster in the more affluent neighborhoods, whereas those with a Moroccan, Turkish, or non-Western background more often live in lower status areas (low income, low education areas).
Figure 3. Predicted probability of living in neighborhood types in the MRA, by level of education, 2016
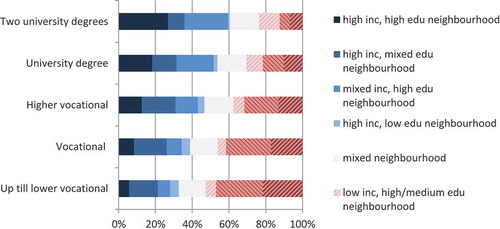
When the probabilities are calculated (based on the same model; see Appendix) for educational attainment, the differences appear to be bigger () relative to income but lower relative to migration background.
Figure 4. Predicted probability of living in neighborhood types in the MRA, by ethnicity, 2016
Individuals with a lower educational level have the highest probabilities to live in the lowest status neighborhoods (21%) and in neighborhoods that are mixed in terms of income, but homogeneously lower educated (26%). The former is about three times as likely as for two-university graduates (7%) and the latter even five times more likely (5%). Correspondingly, double-university graduates are much more likely to live-in upper-class areas (high/high) (27%) than lower educated (6%). Also, for mixed income, but homogenously highly educated areas the probability is much higher (24%) than any other group.
Apart from that, there are some other new findings (higher) vocationally trained people are the group most likely to live in homogenously high-income and educationally mixed areas (17%), which is more likely than among university graduates. Also, higher vocationally trained (that is, bachelor’s level) are most likely to live in areas that are mixed in terms of income, but homogenously lower educated areas.
Based on the second model (see Appendix, Model 2) the probabilities are calculated for the class fractions, using a combination of income and education. We again controlled for the same background variables, but of course left the separate income and educational attainment variables out. Results are more complex ().
Figure 5. Predicted probability of living in neighborhood types in the MRA, by class fraction, 2016
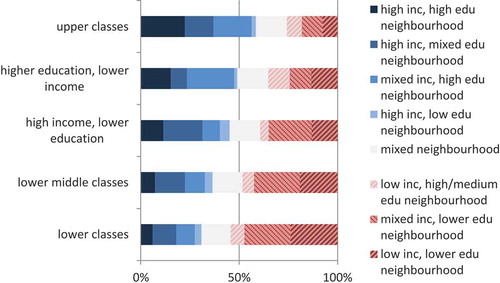
Although individuals with the highest social position are the most overrepresented in homogeneously high-status areas, and lower classes reveal the opposite, there is some relevant variation in terms of the other class fractions. For instance, individuals that have a university degree, but a low income are surprisingly likely to live in mixed areas. It is perhaps also remarkable that even individuals with high levels of economic and cultural capital are still often living in mixed areas. Finally, affluent groups with lower levels of educational attainment are also often living in mixed areas, despite having relatively much opportunities in the housing market.
Finally, we discuss the odds of living in the different neighborhood types of individuals working in different employment sectors. For this step, we refrain from discussing all 19 sectors but rather zoom in onto five sectors that demonstrate the clearest and most contrasting spatial patterns (Law; Higher education; Creative industries; and Lower services; Finance, Insurance and Real Estate (FIRE); Construction) and two sectors that are expected to have less distinct patterns: primary education and ICT.
We first show the maps revealing the location quotients of these eight sectors in the municipalities of the metropolitan region (). The maps confirm the descriptive insights from the segregation indices that higher-education employees and those working in law are most concentrated in specific areas, while those in ICT and primary education are indeed quite ubiquitous.
Figure 6. Predicted probability of living in neighborhood types in the MRA, by employment sector, in 2016
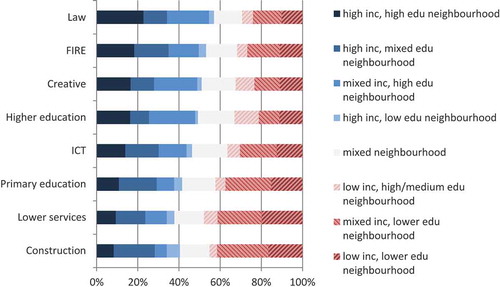
When the potential effects of income, educational attainment, and other control variables are considered we calculated the probabilities of individuals in different sectors. Employees in law and finance, insurance, and real estate (FIRE) are most likely to live in the elite milieus (23-18% respectively), while those working in construction and lower service jobs are least likely (8-9% respectively). The differences between the different employment sectors are smaller when it concerns the lower status neighborhoods. It appears that those working in higher education have the highest odds of living in mixed neighborhoods (18%).
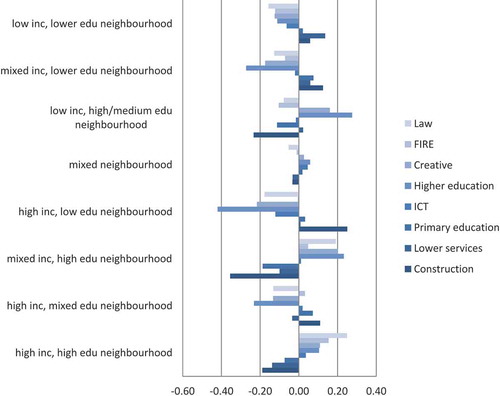
To facilitate interpretation organized by residential milieu, the final figure () demonstrates the relative over- and underrepresentation of the specific neighborhood types compared to the whole population. It immediately shows that some employment groups are more likely to live in specific types of neighborhoods than others. People working in construction, higher education, creative industries, and law have most distinct probabilities as indicated by the large spread of probabilities. For instance, construction workers are overrepresented in high-income areas, with fewer highly educated. People working in ICT and primary education reveal least distinct patterns. This fits with previous findings that these types of public workers can be found in any residential milieu.
Figure 7. Under- and overrepresentation of predicted probabilities; logarithms of the quotient of the probability
Conclusion and discussion
In this paper, we aimed to widen the discussion on segregation through the inclusion of several dimensions of spatial sorting. Drawing on the case of the Amsterdam metropolitan area and studying employed residents aged 24 years or above of this region only, we find that while income and especially ethnicity are relevant “classical” dimensions along which people sort spatially, dimensions of cultural capital, measured through educational attainment, class fractions, employment sector, or labor market status, reveals important segregation patterns too. A combination of different dimensions of social position yields a more nuanced and better conceptual framework for understanding the social geographies of urban areas. The figures presented for the metropolitan area of Amsterdam – an area which is more segregated than other parts of the Netherlands – show a low to moderate segregation pattern. This is in line with previous work that also argued that income segregation in the Netherlands, and in Amsterdam is moderate (Musterd & Ostendorf, Citation1998; Tammaru et al., Citation2016). The fact that income segregation is relatively moderate and that the lower classes are not disconnected from the middle class is jointly shaped by firm state interventions in several domains, including the tax domain, social security, pensions systems, housing systems, and disability spheres. These directly impact on incomes. Also, through a range of housing subsidies, such as the individual rent subsidy and regulations, income inequality is also buffered. Moreover, local government policies of mixing social rental housing and private ownership contribute to the mixing of low- and high-income households in neighborhoods. Especially low-income categories benefit from these interventions. On the other hand, we assumed that recently, other policies tend to increase income segregation. For instance, national policies stimulating homeownership tend to increase income segregation. Our findings point however to a confirmation that the redistribution of economic capital and the buffering of its workings are still working against income segregation in the Netherlands.
However, both descriptive analyses and the individual-level models reveal that segregation by migration background is still relatively high, even after controlling for other relevant variables (age, income, education, labor status). Given that we only investigated the working population we perhaps even underestimate the degree of segregation. We expect segregation to be higher if for instance the unemployed were included because unemployment rates are much higher among non-western migrants than among Dutch natives.
Despite the continued relevance of income and ethnicity, in this article, we primarily focussed on new cultural forms of segregation and how cultural dimensions of class are emerging as more important socio-spatial cleavages in post-industrial societies (Savage, Citation2015). In the Dutch context of substantial income redistribution, other forms of capital may assume a more central role in processes of distinction and social reproduction. Redistribution of institutional forms of cultural capital should be facilitated by a well-functioning educational system catering specifically for the lower end of the tail, such as the Finnish system (OECD, Citation2012). A strong focus on the children from non-middle-class backgrounds and non-native backgrounds could reduce educational inequalities. However, in many contexts, the educational system increasingly emerges as an important vehicle for the reproduction of middle-class advantage (Bourdieu & Passeron, Citation1990). Although the Dutch educational system has been successful in facilitating social mobility in the immediate postwar decades, in more recent decade’s educational inequalities are increasing. This is also partly the result of educational policies. Early tracking and large school differences have made educational attainment in the Netherlands the most important dimension of social inequality (SCP, Citation2014). This seems to be reflected in spatial sorting as well. This paper demonstrated that university graduates are more segregated than the highest incomes. Especially when the partner also has a university degree, segregation levels at the metropolitan level are much higher. This also reflects a broader pattern. At the metropolitan level, segregation is higher. This may be due to the booming character of the city in economic terms, attracting large numbers of highly educated people from everywhere, who have to find a place in the city while the housing market experiences over-demand and lack of supply. The highly educated will try to find accommodation almost everywhere in the city, spurring gentrification in areas that used to be rather homogeneously lower-classes (Boterman & Van Gent, Citation2014; Hochstenbach & Van Gent, Citation2015). In contrast, lower educated residents are relatively strongly segregated. This is due to similar problems in the housing market but also due to the educational system. They will be increasingly forced to accept the offers at the bottom end of the market, as is also visible in the rapid residualisation of the social rented sector (Musterd, Citation2014) or to move to more affordable parts of the region, spurring a suburbanization of poverty (Hochstenbach & Musterd, Citation2018).
In the second part of the empirical analysis, we investigated the drivers of living in specific areas, specifically neighborhoods with a homogeneous character in terms of the combination of income and educational attainment. We distinguished eight types of neighborhood that represent a different mix in terms of the social class population in the area. Through multinomial logistic models, we estimated the probability of living in these areas, controlling for other individual characteristics. We ran models to assess the same four dimensions are for the segregation: income, educational attainment, class fractions (income*attainment), and employment sector. These analyses confirm the findings from the description of the segregation levels across different dimensions: income is a predictor for neighborhood type, but differences between income classes are relatively moderate. For educational attainment, differences are more substantial. It appears that lower educated and highly educated are indeed living in very different areas. Especially homogenously highly educated, but mixed in terms of income areas, are very unlikely to be inhabited by lower educated and very likely to harbor university graduates. The combination of economic and cultural capital results in a more complex pattern. It appears that highly educated with low incomes are overrepresented in mixed areas. This seems to confirm the idea of marginal or early gentrification where specific class fractions are the early adopters of relatively low status areas (which might change in status in due course) (Rose, Citation1984; Van Criekingen & Decroly, Citation2003). Correspondingly, the high income, but lower educational attainment group is much less prone to mix but are relatively likely to live in lower status areas.
Finally, employment sector is an interesting predictor for the residential neighborhood type. Of course, the employment sector is also pre-structured by education and has repercussions for income. But independent of those factors, the residential locations of employees in different sectors are quite differentiated. It appears that people working in professional business services such as law, and finance and real estate gravitate to homogeneous elite areas. Higher education and creative industries are most likely to live in more mixed areas, with many highly educated. Construction workers and to a lesser extent also other employment sectors associated with less symbolic capital are overrepresented in high-income areas, with fewer highly educated. These findings demonstrate that spatial sorting is also strongly informed by cultural/symbolic dimensions as well identified here by employment sector. This therefore confirms other research that argues that the orientation of capital strongly correlates with specific social practices (Bourdieu, Citation1984; Butler & Robson, Citation2003). We provide large scale, quantitative evidence for the fact that different forms of capital are also associated with spatial distinction. This is in line with the work of Savage and others (Bacqué et al., Citation2015; Savage, Citation2010; Savage et al., Citation2005) who have successfully argued for a spatialization of Bourdieu’s concepts.
What are the policy implications of our findings? Dutch policies on (spatial) inequality try to control the income distribution, but on balance this appears to be unsuccessful, social inequality is increasing. In the housing sphere, the aim is to provide housing for all, but the neo-liberalization of the market creates more instead of less spatial inequalities. Segregation based on “ethnicity”, or actually on country of origin, cannot be addressed directly because that would be illegal, and thus governments use the association with income and housing tenure, and develop social mixing policies through the housing market. These, however, also may have counter-productive effects, as we have shown. The State does not intervene in segregation based on educational attainment or based on the type of profession one has. Professions and employment sector one is working in, are related with cultural class distinctions, and are not unrelated to economic or other forms of capital. Intervention in the cultural domain is, however, highly unlikely. Governments may intervene directly in the sphere of socio-economic spatial inequality, but more often they affect inequality indirectly, for example, through housing allocation and housing financing policies, and through rent regulation policies. Currently, mortgage tax reduction leads to higher income segregation between rich and poor whereas individual rent subsidies – aimed at providing financially acceptable shelter – may be reducing income segregation somewhat. The central government has traditionally had two main policy instruments to guarantee the affordability of rental housing: rent regulation and housing allowance. The new Housing Act 2015 added the so-called “appropriate assignment” of social housing as an instrument, forcing housing associations to ensure lower income households to be reassigned to rental houses at a governmentally determined appropriate rent level (Schilder & Scherpenisse, Citation2018). In some contexts, the case of Amsterdam is an example, local governments own much of the land of the city and in such circumstances, they have the final and most important say over the development of the land. The City of Amsterdam used that position to ensure that in every new development a certain share of social housing was included; they also used their position to develop plans in which they required social mix, sometimes even at micro level, thereby significantly reducing segregation.
So, whereas governments may develop policies to reduce income inequality, and whereas they may support people to attain higher levels of education and provide equal access to education, they are unable and moreover unwilling to intervene in the lifestyles and to really reduce the spatial cultural gap between people. Social-cultural practices in the field of consumption, education, and housing are associated with individual choice. Such choice is traditionally understood to be private choice and lying outside the realm of government. Neoliberalism, stressing individual choice and individual responsibility in combination with the commodification of housing, and ever-expanding consumption have made government intervention in these domains most unlikely. It is therefore that inequalities can manifest themselves more easily through social networks and cultural forms of capital than through economic capital. This implies that, because nowadays we more often distinguish ourselves from others based on cultural capital, we also have to face more inequality in the future, and higher levels of segregation overall.
Disclosure statement
No potential conflict of interest was reported by the authors.
Notes
1. This includes all residents, citizens, and foreigners on a residence permit, but excluded illegal immigrants.
2. The MRA consists of Amsterdam + 32 surrounding municipalities (metropoolregioamsterdam.nl).
3. Formula for SI =
4. Neighborhoods are defined according to the categories Statistic Netherlands has defined. These are the primary administrative spatial units. On average the 850 neighborhoods in the Metropolitan region Amsterdam have 28,000 inhabitants, ranging from the lower limit of 100 inhabitants to the biggest area of 27,000 inhabitants. Most neighborhoods (about 60%) have between 1500 and 4000 inhabitants.
References
- Agier, M. (2009). The Ghetto, the hyperghetto and the fragmentation of the world. International Journal of Urban and Regional Research, 33(3), 854–857.
- Andersson, R., & Kährik, A. (2016). Widening gaps: Segregation dynamics during two decades of economic and institutional change in Stockholm. In T. Tammaru, S. Marcińczak, M. van Ham, & S. Musterd (Eds.), Socio-economic segregation in european capital cities. East meets west (pp. 110–131). London: Routledge.
- Åslund, O., & Skans, O.N. (2010). Will I see you at work? Ethnic workplace segregation in Sweden, 1985–2002. Industrial and Labor Relations Review, 63(3), 471–493.
- Atkinson, R. (2006). Padding the bunker: Strategies of middle-class disaffiliation and colonisation in the city. Urban Studies, 43(4), 819–832.
- Atkinson, R., & Flint, J. (2004). Fortress UK? Gated communities, the spatial revolt of the elites and time-space trajectories of segregation. Housing Studies, 19(6), 875–892.
- Bacqué, M., Bridge, G., Benson, M., Butler, T., Charmes, E., Fijalkow, Y., & Vermeersch, S. (2015). The middle classes and the city: A study of Paris and London. Basinstoke: Palgrave.
- Boterman, W.R. (2012). Residential mobility of urban middle class parents in the field of parenthood. Environment and Planning A, 44(10), 2397–2412.
- Boterman, W.R., Manting, D., & Musterd, S. (2018). Understanding the social geographies of urban regions through the socio-economic and cultural dimension of class. Population Space and Place, 24(5), 5.
- Boterman, W.R., & Musterd, S. (2016). Cocooning urban life: Exposure to diversity in neighbourhoods, workplaces and transport. Cities, 59, 139–147.
- Boterman, W.R., & Musterd, S. (2017). Differentiated residential orientations of class fractions. In John Hannigan & Greg Richards (Eds.), The SAGE Handbook of new urban studies (pp. 388–407). Los Angeles: SAGE.
- Boterman, W.R., Musterd, S., Pacchi, C., & Ranci, C. (2019). School segregation in contemporary cities: Socio-spatial dynamics, institutional context, and urban outcomes. Urban Studies, 56, 3055–3073. forthcoming.
- Boterman, W.R., & Van Gent, W.P.C. (2014). Housing liberalization and gentrification. The social effects of tenure conversions in Amsterdam. Tijdschrift Voor Economische En Sociale Geografie, 105(2), 140–160.
- Boudon, R. (1974). Education opportunity and social inequality; changing prospects in western society. New York, NY: Wiley & Sons.
- Bourdieu, P. (1984). Distinction. A social critique of the judgement of taste. London: Routledge.
- Bourdieu, P., & Passeron, J. C. (1990). Reproduction in education, society and culture (Vol. 4). London: Sage.
- Bridge, G. (2006). It’s not just a question of taste: Gentrification, the neighbourhood, and cultural capital. Environment and Planning A, 38(10), 1965–1978.
- Bridge, G., Butler, T., & Lees, L. (Eds.). (2011). Mixed communities: Gentrification by stealth? Bristol: Policy Press.
- Buitelaar, E., Weterings, A., & Ponds, R. (2017). Cities, economic inequality and justice. Reflections and alternative perspectives (pp. 116). Routledge Focus. ISBN 987-1-13-828399-2.
- Burgers, J., & Musterd, S. (2002). Understanding urban inequality A model based on existing theories and an empirical illustration. International Journal of Urban and Regional Research, 26(2), 403–413.
- Butler, T. (2007). For gentrification? Environment and Planning A, 39(1), 162–181.
- Butler, T., & Robson, G. (2001). Social capital, gentrification and neighbourhood change in London: A comparison of three south London neighbourhoods. Urban Studies, 38(12), 2145–2162.
- Butler, T., & Robson, G. (2003). London calling: The middle classes and the remaking of the city. Oxford: Berg.
- Florida, R. (2002). The rise of the creative class: And how it’s transforming work, leisure, community and everyday life. New York, NY: Basic Books.
- Florida, R., & Mellander, C. (2018). The geography of economic segregation. Social Sciences, 7(8), 123.
- Hamnett, C. (2003). Gentrification and the middle-class remaking of inner London, 1961-2001. Urban Studies, 40(12), 2401–2426.
- Hochstenbach, C., & Musterd, S. (2018). Gentrification and the suburbanization of poverty: Changing urban geographies through boom and bust periods. Urban Geography, 39(1), 26–53.
- Hochstenbach, C., & Van Gent, W.P.C. (2015). An anatomy of gentrification processes; Variegating causes of neighbourhood chance. Environment and Planning A, 47(7), 1480–1501.
- Ley, D. (1996). The new middle class and the remaking of the central city. Oxford: Oxford University Press.
- Massey, D. S., & Denton, N. A. (1988). The dimensions of residential segregation. Social Forces, 67(2), 281–315.
- Moretti, E. (2012). The new geography of jobs (pp. 294). Boston: Houghton Mifflin Harcourt. ISBN: 978-0-547-75011-8.
- Musterd, S. (2008). Banlieues, the hyperghetto and advanced marginality: A symposium on loïc wacquant’s urban outcasts; diverse poverty neighbourhoods; reflections on ‘urban outcasts’. City, 12(1), 107–114.
- Musterd, S. (2014). Public housing in an era of neo-liberalism. Housing Studies, 29(4), 467–484.
- Musterd, S., & Ostendorf, W. (eds). (1998). Urban segregation and the welfare state: Inequality and exclusion in western cities. London: Routledge.
- Musterd, S., & Van Gent, W. (2016). Changing welfare context and income segregation in Amsterdam and its metropolitan area. In T. Tammaru, S. Marcińczak, M. van Ham, & S. Musterd (Eds.), Socio-economic segregation in european capital cities. East meets west (pp. 55–79). London: Routledge.
- OECD. (2012). Equity and quality in education. Paris: Author.
- Préteceille, E. (2003). La division sociale de l’espace francilien. In Typologie socioprofessionnelle 1999 et transformations de l’espace résidentiel 1990-99. Paris: Observatoire Sociologique du Changement FNSP-CNRS.
- Préteceille, E., & Cardoso, A. (2020). Socioeconomic segregation and the middle classes in Paris, Rio de Janeiro and São Paulo: A comparative perspective. In S. Musterd (Ed.), pp.270-288, Handbook of urban segregation. Cheltenham, UK: Edward Elgar.
- Robson, B. (1975). Urban social areas. Oxford: Oxford University Press.
- Rose, D. (1984). Rethinking gentrification: Beyond the uneven development of Marxist urban theory. Environment and Planning D, 2(1), 47–74.
- Sassen, S. (1991). The global city: New York, London, Tokyo. Princeton, NJ: Princeton University Press.
- Sassen, S. (2014). Expulsions. Cambridge, MA: Harvard University Press.
- Savage, M. (2010). The politics of elective belonging. Housing, Theory and Society, 27(2), 115–161.
- Savage, M. (2015). Social class in the 21st century. London: Penguin UK.
- Savage, M., Devine, F., Cunningham, N., Taylor, M., Li, Y., Hjellbrekke, J., & Miles, A. (2013). A new model of social class? Findings from the BBC’s great British class survey experiment. Sociology, 47(2), 219–250.
- Savage, M.J., Barlow, M., & Longhurst, B. (2005). Globalization and belonging. London: Sage.
- Schilder, F, & Scherpenisse, R. (2018). Policy and practice, affordable housing in The Netherlands. Information zur Raumentwicklung, Heft, 4(1028), 81–91.
- SCP. (2014). “Gescheiden werelden.” Een verkenning van sociaal-culturele tegenstellingen in Nederland. Den Haag: Sociaal en Cultureel Planbureau en Wetenschappelijke Raad voor het Regeringsbeleid.
- Tammaru, T., Marcinczak, S., van Ham, M., & Musterd, S. (Eds.). (2016). East meets west: New perspectives on socio-economic segregation in European capital cities. London: Routledge.
- Valentine, G. (2008). Living with difference: Reflections on geographies of encounter. Progress in Human Geography, 32(3), 323–337.
- Van Criekingen, M., & Decroly, J. M. (2003). Revisiting the diversity of gentrification: Neighbourhood renewal processes in Brussels and Montreal. Urban Studies, 40(12), 2451–2468.
- Van de Werfhorst, H. G., & Mijs, J. J. (2010). Achievement inequality and the institutional structure of educational systems: A comparative perspective. Annual Review of Sociology, 36(1), 407–428.
- Van der Waal, J., & Burgers, J. (2009). Unravelling the global city debate on social inequality: A firm-level analysis of wage inequality in Amsterdam and Rotterdam. Urban Studies, 46(13), 2715–2729.
- Van Gent, W., & Musterd, S. (2016). Class, migrants, and the European city: Spatial impacts of structural changes in early twenty-first century Amsterdam. Journal of Ethnic and Migration Studies, 42(6), 893–912.
- van Ham, M., & Tammaru, T. (2016). New perspectives on ethnic segregation over time and space. A domains approach. Urban Geography, 37(7), 953–962.
- Wacquant, L. (2008). Urban outcasts: A Comparative sociology of advanced marginality. Cambridge: Polity Press.
- Wang, D., Li, F., & Chai, Y. (2012). Activity spaces and sociospatial segregation in Beijing. Urban Geography, 33(2), 256–277.
- Wessel, T. (2016). Economic segregation in Oslo: Polarisation as a contingent outcome. In T. Tammaru, S. Marcińczak, M. van Ham, & S. Musterd (Eds.), Socio-economic segregation in European capital cities. East meets West (pp. 132–155). London: Routledge.
Appendix
Model 1. Multinomial logistic regression estimates for employees, aged 24 and above, living in neighborhood types in Metropolitan Region Amsterdam, 2016 N = 892,429
Model 2. Multinomial logistic regression estimates for employees, aged 24 and above, living in neighborhood types in Metropolitan Region Amsterdam 2016
N = 892,429