
ABSTRACT
Through the Choice Neighborhoods Initiative (CNI), private investors and developers replace distressed US public housing with new mixed-income and mixed-use developments. Although these projects promote community involvement and are purported to prioritize community input and to benefit residents, private investors have disproportionate power and often modify redevelopment to favor the market-rate units while receiving tax incentives, extremely low-cost and long-term land-leases, and government funds for demolition, construction, maintenance, and management. Through a CNI program in Denver (US) we identify and examine the hardships experienced by its residents. CNI transitioned residents toward modern living amenities and mixed-income arrangements but with a loss of community and negatively impacted residents’ mental and physical health. Our initial findings highlight how this regeneration process can lead to degeneration, displacement, fragmented communities, and poor health outcomes for residents. Federal and local agencies should commit to programs that ensures collaborative community-centred planning from beginning to end.
Introduction
Decades of public housing disinvestment in the United States have resulted in a dilapidated and aging public housing stock (Dreier, Citation2018; Popkin et al., Citation2020). As cities becoming increasingly more expensive, much of this housing stock is now sitting on valuable urban core land which is being infiltrated by private investors under the guise of providing current residents with new, better-quality homes and the promise of improved life outcomes through social and economic integration. Public housing agencies in the United States are also involved in this process, through contracts with private investors and developers to replace distressed public housing and to develop new mixed-income (mixed-tenure) mixed-use developments (US Department of Housing and Urban Development, Citation2022a). These partnerships are currently being promoted through the Choice Neighborhoods Initiative (CNI) model, which was created to redevelop and promote mixed-income and mixed-use housing (such as parks, retail and markets) through redevelopments of traditional public housing communities (Pendall & Hendey, Citation2013). Yet, it is often not an equal partnership, with private investors often having disproportionate decision-making power to modify redevelopment projects in favor of market-rate units, while continuing to receive tax incentives, extremely low-cost long-term land-leases, and government funds for demolition, construction, maintenance, and management. As a result, although public housing residents are a central part of the project in its initial stages, as stake-holders in the redevelopment process, their needs are increasingly marginalized throughout the process.
We provide a case study to shed light on the hardships experienced by public housing residents during an ongoing CNI redevelopment of the Sun Valley public housing neighborhood in Denver, Colorado. Within the process of demolition and construction CNI transitioned Sun Valley residents toward modern living amenities and mixed-income arrangements – enforced through stricter economic barriers and divisions – leading to a loss of community and negatively impacting residents’ mental and physical health. Although state-sanctioned programs like CNI and Hope VI claim to promote social and economic opportunity and integration of public housing residents, our initial findings highlight how this regeneration process does not guarantee integration and higher quality of life, but rather, promotes state-led gentrification that can produce degeneration, displacement, fragmented communities, and poor health outcomes among residents (similar to Watt, Citation2009; Chaskin & Joseph, Citation2017; Coley et al., Citation2022; Orum & López-Morales, Citation2023; Watt, Citation2021). Instead of relying on private financing, which often gives private developers excessive power to change community plans for their own economic interests, we argue that federal and local agencies should commit to identifying funding that prioritizes and ensures collaborative community-centered plans throughout the entirety of the project.
US public housing
US public housing programs are designed to provide affordable housing options for eligible low-income families, the elderly, and people with disabilities. These public housing units are owned by the US Department of Housing and Urban Development (HUD) and managed by local public housing agencies (PHAs). As of 2016, there were a total of 1.1 million public housing units located in all 50 states, housing approximately 2.1 million low-income residents (Center on Budget and Policy Priorities, Citation2021). Nearly all the nation’s public housing developments were originally constructed before 1974,Footnote1 and since then the focus and funding of HUD has shifted to maintaining this ageing public housing stock and federal housing voucher programsFootnote2 (). The largest of these programs is the Housing Choice Voucher Program Section 8 (HCV), through which HUD provides funds to PHAs to administer vouchers that low-income individuals can use to obtain housing on the private market (US Department of Housing and Urban Development, Citation2022b).Footnote3 This neoliberal policy has created conditions in which public housing residents must compete for an ever dwindling supply of housing, as they face declining affordable housing options, or private landlords who will not accept vouchers, or who do not renew contracts (Ellen, Citation2020). When residents do find housing, they are often of very poor quality. (Poverty & Race Research Action Council, Citation2022).
Figure 1. Funding trends for public housing repairs and housing choice voucher programs since 2000 (Congressional Research Service, Citation2019; Public Domain).
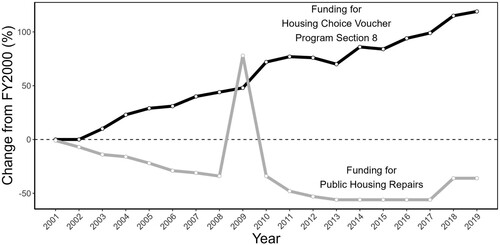
This lack of investment in existing US public housing has resulted in a steady decline in public housing availability as well as in the quality of available units. The US loses approximately 125,000 affordable rental units each year, and many existing units require badly needed maintenance. Similarly, many of these public housing neighborhoods are located in physically, racially, and economically segregated neighborhoods that lack basic resources and services such as supermarkets, parks, and public transportation (Dreier, Citation2018). To address the lack of funding to fix these crumbling neighborhoods, HUD has resorted to privatizing US public housing through the Rental Assistance Demonstration (RAD) program, HOPE VI, and most recently, the CNI program. HUD’s Rental Assistance Demonstration (RAD) program converts public housing to Section 8 private housing, shifting ownership of the formerly public units over to the private sector (Jones & Popke, Citation2010; Pendall & Hendey, Citation2013).Footnote4 The HOPE VI (Housing Opportunities for People Everywhere) program replaces distressed public housing with redesigned mixed-income housing, while also providing some vouchers for private off-site housing (Urban Institute, Citation2004). Although these programs led to some renovations, they also produced a net loss in affordable housing units since demolition of distressed housing happened quickly, but rebuilding has lagged (Urban Institute, Citation2004). Although these programs are designed to support low-income families’ ability to access affordable housing, they must be considered inside the context of broader neoliberal processes of urbanization that have promoted and celebrated the deregulation of the housing market, urban investment and gentrification in low-income neighborhoods and other development processes, all of which have led to rising real-estate and rental prices (Watt, Citation2009).This is a form of state-led gentrification: “the prescription or direct application of social displacement policies on originally low income residential areas or public spaces now zoned for upgrading redevelopment” (Orum & López-Morales, Citation2023). CNI displaces residents, albeit so that the housing can be renewed, but nonetheless the communities become fragmented, some residents do not return, and market-rates units become the dominate housing (as we expose in this paper).
Choice neighborhoods initiative (CNI)
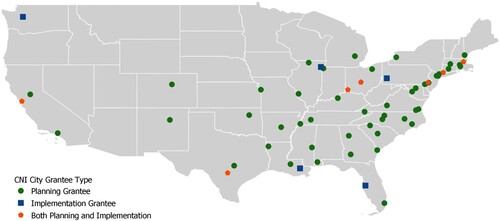
Like the above privatization programs, CNI directs funds to PHAs and other local organizations to redevelop distressed public housing into mixed income housing (US Department of Housing and Urban Development, Citation2022a). In addition to housing, CNI focuses on investments in people (aiming to improve employment, education, and health outcomes) and neighborhoods (through investments in local amenities and assets) (US Department of Housing and Urban Development, Citation2022a). This whole-neighborhood investment was based on the initial results of the Moving to Opportunity experiment (MTO),Footnote5 which relocated public housing residents out of distressed public housing and into “higher opportunity” private housing neighborhoods (Gennetian et al., Citation2011). Initial results from MTO initially showed improved health, income, and education outcomes, yet later longitudinal studies and those using advanced statistical methods have found worse outcomes for the participating public housing residents (DeVoss et al., Citation2022).Footnote6 These whole-neighborhood redevelopments also require more funding for the necessary infrastructure (e.g. new utilities and new street grids), which then prioritizes the construction of the market rate units to ensure that private developers receive profit/income. The profitability of this state-led gentrification may help explain why a US federal program like CNI was able to expand to nearly every major city in the United States in only five years ().
Figure 2. Map showing the locations of Choice Neighborhoods Initiative planning grantee sites (green circles), implementation grantee sites (blue square), and sites with both types of grantees (orange pentagon) (US Department of Housing and Urban Development, Citation2015, Public Domain).
Data and methods
Our transdisciplinary team has been evaluating the impacts of the CNI Sun Valley public housing redevelopment (Denver, US) on its residents (with IRB Approval from the University of Tennessee and the Colorado Multiple Institutional Review Board). During 2020, we began conducting participatory photography and in-person semi-structured interviews with families living under the CNI redevelopment to document their experiences during the pandemic, described elsewhere (Auerbach et al., Citation2021; Clark et al., Citation2022). As of January 2022 and building off the pandemic study, we conducted repeated semi-structured interviews (by phone, video, and in-person) with 23 adult residents about the redevelopment process. Snowball sampling was used to identify participants with assistance from CNI staff and participants were compensated for their time. Participants include those who were displaced when their housing was demolished and relocated out of Sun Valley, and those who have remained in the neighborhood during construction. We also conducted many informal conversations with CNI staff about the redevelopment project between 2020 and 2022.
The managing SV CNI office has also been conducting annual household surveys since 2015, as part of the redevelopment process, to collect data on changes in income, family structure, community connectedness, access to services, academic achievement, and mental and physical health, before, during, and after relocation.Footnote7 The study sample included all SV residents who participated in the CNI annual survey for the years 2017 (n = 319), 2018 (n = 252), 2019 (n = 154), and 2020 (n = 128). For 2017, surveys were mailed to every adult resident. For 2018 and 2019 data, surveys were mailed to heads of household. In 2020, the survey was administered to residents through Qualtrics. Written in English, the CNI team had translators to help administer the survey when needed. Descriptive statistics were conducted for this analysis.
Choice neighborhoods initiative case study – Sun Valley neighborhood
Despite its proximity, Sun Valley neighborhood is not directly connected to downtown Denver (), as it sits walled in by the Denver Broncos’ football Stadium and Interstate 70/Colfax to the North, Interstate 25 to the East and South, and the Platte River to the Northeast, restricting residents’ access to opportunities in other parts of the city and limiting economic growth potential within the community (Jackson, Citation2018). Sun Valley is an economically impoverished yet diverse community that includes refugees and immigrants, Black and Hispanic/Latinx families, single-parent households, and those who suffer from chronic health conditions or who are permanently disabled, and where more than 30 languages are spoken (). Sitting next to high density motor vehicle traffic and industrial sites, SV’s census block group ranks between the 60th and 98th percentiles compared to all block groups in Colorado regarding inequitable environmental health risks, including proximity to traffic, hazardous waste, Superfund sites, and lead (US Environmental Protection Agency, Citation2019).
Figure 3. The location of the Sun Valley public housing neighborhood within Denver (map from Clark et al., Citation2022).
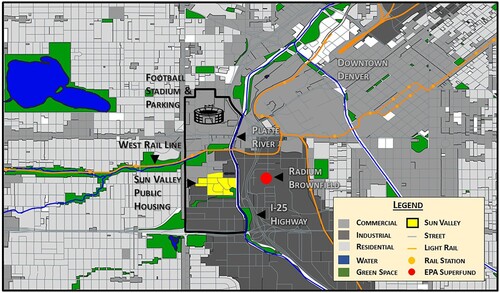
Table 1. The demographics of Sun Valley compared to greater Denver.
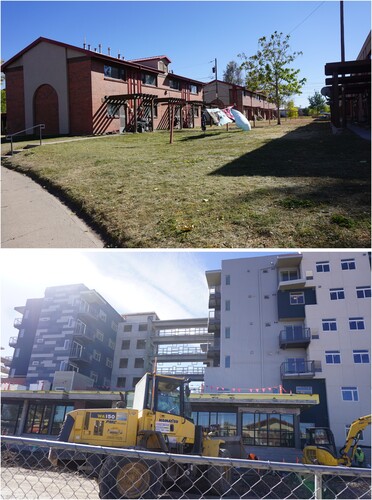
Prior to CNI, the SV neighborhood was composed of 300 dark, damp, and pest-infested terrace homes built in the 1950s (). Starting in 2015, SV has been in the process of a CNI redevelopment under the management of the Denver Housing Authority (DHA), the local PHA, to replace the old housing stock with new energy-efficient apartments that have modern appliances, more natural light, and open interior spaces (EcoDistricts, Citation2022b). The city of Denver has experienced significant gentrification, housing commodification, and an affordable housing crisis: at the time of this writing, there were over 5,000 households on the DHA voucher waitlist while there have been reported issues with landlords discriminating against families and individuals using voucher assistance (Choice Neighborhoods Initiative, personal communication, 2020). Despite the isolated geography of SV, the neighborhood has been increasingly attractive for private investment and redevelopment due to its close proximity to downtown Denver, the river and stadium-entertainment district, and a nearby light rail station (built in 2010).
Figure 4. Example of the Sun Valley public housing (built in the 1950s) and a Sun Valley replacement apartment building (photographs taken by the authors).
The original SV redevelopment plan called for several phases of staggered demolition and construction so that the public housing residents could remain in the neighborhood throughout the process, offering some semblance of stability and continuity. In other words, SV residents would not be displaced while they waited to move into the redevelopment. The original plans were for 1,183 units composed of 333 HCV units to replace the public housing along with 750 market rate units and 200 K square feet of office space with a reduction of green space () (EcoDistricts, Citation2022a). Although DHA will continue to own the property of the current development, the market-rate units are being privately managed as DHA felt there would be a stigma of renting from a public housing agency by the market-rate renters. Additionally, 10 acres of DHA land are being sold off to private developers and the number of public housing units to be built on this land has not been publicized.
Figure 5. The number of public housing and market-rate units during different stages of the Sun Valley CNI development.
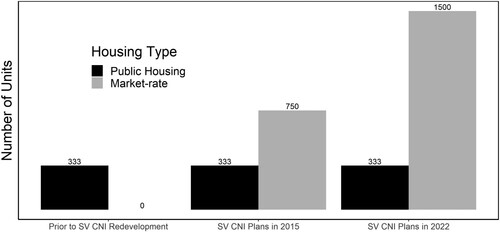
There have been significant delays in the construction of the buildings, in part due to the COVID-19 pandemic. The first stage of apartments and retail space for an international market were completed six months late, while a planned youth center and community space have yet to be developed (EcoDistricts, Citation2022b). As development and construction costs have increased,Footnote8 more private investors have become involved, resulting in a decrease in the number of units reserved for residents with vouchers, and leading to a doubling of the number of market rate units – now at 1,500 (a five-to-one market to public ratio). The increase of private funding has also modified some of the affordable unit income thresholds, creating stricter income thresholds for some of the units and additional application paperwork (Choice Neighborhoods Initiative, personal communication, 2020). Furthermore, these additional private actors have modified the redevelopment planning. These changes, coming late in the redevelopment process, have only created a more difficult application experience for the relocated SV residents; many were led to believe they would qualify for a new unit, and it would be an easy process through DHA, not a private developer. Coupled with government bureaucracy, the changes in the redevelopment process were not communicated to residents thoroughly, as DHA employees on the ground were unaware of the policy changes; this created distrust with the residents when these changes were later exposed (Choice Neighborhoods Initiative, personal communication, 2020).
Results and discussion
Demolition and construction
The publicized intention of staggered construction was to ensure that the SV community would remain during the construction period of the redevelopment, but for those who did stay, the construction and demolition was extremely disruptive. After the displacement of the first 50 families from the first stage of demolition, the sense of community became fragmented due to the dissolution of the community:
… before this relocation thing started. The playgrounds were always full of kids playing … I could hear them out there playing … and they’d be playing on the swings … I talked to some residents and some residents would be sitting on their porches … I can’t walk very good anymore, so I would just have to wave at them and maybe they would come over and we talk … But all that is gone because everybody, all the residents, all my neighbors that I got to know … they’re all gone. Everybody’s gone. All the houses are boarded up. It looks like a war zone … Everything’s all boarded up … except for my apartment. I’m the only one here. – An elderly SV resident
Figure 6. Photographs of the redevelopment demolition (photographs taken by the authors).
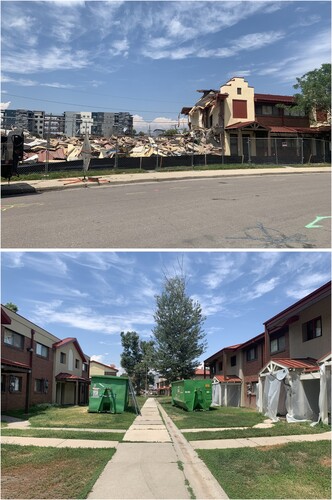
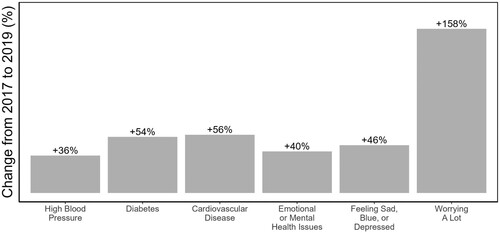
Figure 7. Changes in mental and physical health outcomes for SV residents during redevelopment (Data from the CNI Sun Valley annual resident surveys).
New apartment living
The move from having yards and street-access front doors to apartment hallways has also been profound. The new apartments lack outdoor community space and individual gardens, and it is against regulations for tenants to have BBQ grills on their balconies. SV residents explained that they could no longer randomly see their neighbors or watch their children play:
When you’re on the ground level … You have more of a chance of being burglarized. You have more of a chance of peeping toms and looking through your windows. You have more chance of people showing up to your door and asking for somebody that is not there. [Now] all the gates are locked … Our mail is secure now … Everything’s a lot more secure now. [But] the old [housing] had its pluses because … I could open up the window and I could let my son play outside with his brothers and I could listen to them and know if anything’s going on … Now, a year at the new apartment, [my son] has been bugging me. Dad, I want to go play outside, Dad. I want to go play outside. And it’s really hard for me because there’s times when I can’t go outside. – A middle-aged father of three
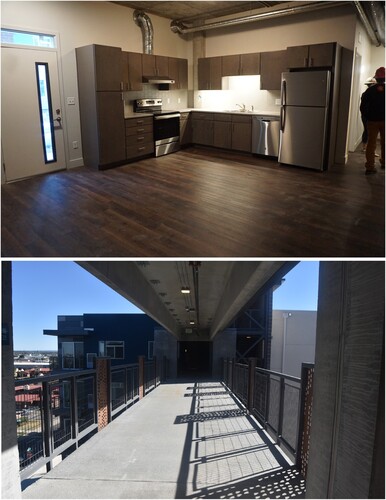
Figure 8. Photographs of the SV mixed-income apartment (photographs taken by the authors).
The new SV apartments contain modern appliances, including in-unit washers and dryers, central heating and air, pest-free environments, and quieter living:
In the old apartment … I would be woken up in the middle of the night when people would drive up and park their cars to go play, to go purchase drugs. So I would hear all of this stuff and I would get up … So when I would be asleep and I would hear a car that I didn’t recognize pull up, it would wake me up. And then I [would] have to investigate … I’m prone to high paranoia. Now that I’m here in the new apartment … It’s a lot quieter. – A middle-aged father of three
Conclusion: CNI as another tool for state-led gentrification
State-led gentrification through displacement from redevelopment has been well documented, such as through rising home values adjacent to state-sponsored redeveloped parks and recreational infrastructure, and now through the privatization of public housing (Auerbach et al., Citation2020; Jones & Popke, Citation2010). For the future of public housing in the United States to be for the residents it must be more collaborative and community-centered (Hamlin & Oberle, Citation2022), through practices and policies that directly involve the residents, community organizations, and community scholars in the design and planning, and creative financing with community benefits. When DHA’s implementation funding was not enough to build the community-centered development envisioned during the planning phase, the project changed without another community process or strong commitments to the original goals. Without significant changes in the way these redevelopments are funded, in which the economic interests and demands of private sector actors are prioritized over the housing needs and access of urban communities to affordable housing communities, cities will continue to fail and marginalize their most vulnerable residents.
Acknowledgements
We would like to thank the residents of Sun Valley and the Sun Valley CNI management for sharing their experiences.
Disclosure statement
No potential conflict of interest was reported by the author(s).
Additional information
Funding
Notes
1 In 1973, US President Nixon issued a moratorium on new public housing construction.
2 As of 2016, less than 4% of the US housing stock was publicly owned, compared to 15–40% in Western Europe (OECD, Citation2020).
3 The PHA pays a subsidy directly to the landlord, and the resident pays the difference between the subsidy and the total rent. Eligibility for vouchers is based on a household’s total income and family size, while undocumented immigrants and family members with a criminal record are not eligible (HUD website).
4 RAD has been the largest source of non-public housing funds to address public housing infrastructure needs, but this funding has been insignificant compared the total backlog of unmet public housing renovation needs. Much of this funding for RAD has been provided through the federal Low-Income Housing Tax Credit (LIHTC). The LIHTC provides tax breaks to create subsidized affordable housing units managed and owned by private and non-profit property managers. These affordable housing units have an expiration data, depending on the amount awarded and generally within 15–30 years, they often have stricter requirements for tenant eligibility and “behavior,” and they don’t usually provide units for very low-income residents (<30% AMI), though some do. LIHTC is used for many purposes other than public housing revitalization, involves complex transactions that can add costs and delays and can be challenging for small agencies or those with limited experience developing affordable housing, and requires agencies to transfer ownership of a project to a private investor. Through RAD, LIHTC has provided $3.28 billion for public housing units renovated and converted to affordable privately owned rentals from September 2013 to September 2017 (Schwartz & McClure, Citation2021).
5 Moving to Opportunity was a HUD-funded housing mobility experiment beginning in 1994, randomly assigning eligible families living in distressed public housing to receive either a standard Section 8 voucher or a voucher that was specifically for relocation to a low-poverty neighborhood.
6 Analysis of the qualitative interviews from MTO have found that some of the positive claims from the quantitative studies were negated when you disaggregated family members. For instance, Black moms and Black girls did worse (mom’s health and girls in school) than when they were in the city (DeLuca & Dayton, Citation2009).
7 Many of the questions on this survey are related to the mixed-outcomes of MTO residents in other studies, after moving to a so-called “area of opportunity.” It has been well-documented that some of the moves have led to declines in many of these areas, i.e., academic achievement, and mental and physical health (DeVoss et al., Citation2022).
8 The growing commodification of housing has led to increased construction costs, labor costs, and supply chain issues in the US and these have been exacerbated by the COVID-19 pandemic impact on inequities and logistics.
References
- US Department of Housing and Urban Development. (2015). Choice neighborhoods 2015 grantee report. https://www.hud.gov/sites/documents/CNGRANTEEREPORT2015.PDF
- US Environmental Protection Agency. (2019). EJ screen. https://ejscreen.epa.gov/mapper
- OECD Directorate of Employment, Labour and Social Affairs. (2020). Social rental housing stock. https://www.oecd.org/els/family/PH4-2-Social-rental-housing-stock.pdf
- US Department of Housing and Urban Development. (2022a). Choice neighborhoods. https://www.hud.gov/cn
- US Department of Housing and Urban Development. (2022b). Housing choice vouchers fact sheet. https://www.hud.gov/topics/housing_choice_voucher_program_section_8
- Auerbach, J., Blackburn, C., Barton, H., Meng, A., & Zegura, E. (2020). Coupling data science with community crowdsourcing for urban renewal policy analysis: An evaluation of Atlanta’s anti-displacement tax fund. Environment and Planning B: Urban Analytics and City Science, 47(6), 1081–1097. https://doi.org/10.1177/2399808318819847
- Auerbach, J., Clark, J., & Muñoz, S. (2021). Under quarantine in a city project: Stories of food, family, fear and confusion. In B. Doucet, R. van Melik, & P. Filion (Eds.), Global reflections on COVID-19 and cities: Urban inequalities in the age of pandemic, volume 1: Community and society (pp. 117–128). Bristol University Press. https://doi.org/10.2307/j.ctv1t4m1nq.17
- Center on Budget and Policy Priorities. (2021). Policy basics: Public housing 2017. https://www.cbpp.org/research/public-housing
- Chaskin, R. J., & Joseph, M. L. (2017). Integrating the inner city: The promise and perils of mixed-income public housing transformation. University of Chicago Press.
- Clark, J., Muñoz, S., & Auerbach, J. (2022). When top-down infrastructures fail: Spaces and practices of care and community under COVID-19. Social & Cultural Geography, 1–21. https://doi.org/10.1080/14649365.2022.2115119
- Coley, R. L., Spielvogel, B., Hwang, D., Lown, J., & Teixeira, S. (2022). Did HOPE VI move communities to opportunity? How public housing redevelopment affected neighborhood poverty, racial composition, and resources 1990–2016. Housing Policy Debate, 1–32. https://doi.org/10.1080/10511482.2022.2121614
- Congressional Research Service. (2019). Department of housing and urban development (HUD): Funding trends since FY2002. https://www.everycrsreport.com/reports/R42542.html
- DeLuca, S., & Dayton, E. (2009). Switching social contexts: The effects of housing mobility and school choice programs on youth outcomes. Annual Review of Sociology, 35(1), 457–491. https://doi.org/10.1146/annurev-soc-070308-120032
- DeVoss, R., Auerbach, J., Banacos, N., Burnett, A., Oke, O., Pease, S., Welton-Mitchell, C., Westbrook, M., & Dickinson, K. L. (2022). What is known about mental health and US federal housing subsidy programs? A scoping review. SSM – Mental Health, 2, https://doi.org/10.1016/j.ssmmh.2022.100155
- Dreier, P. (2018). Why America needs more social housing. The American Prospect, https://prospect.org/infrastructure/america-needs-social-housing/
- EcoDistricts. (2022a). Sun Valley EcoDistrict. https://ecodistricts.org/district-profile/sun-valley-ecodistrict/
- EcoDistricts. (2022b). Sun Valley EcoDistrict project summaries. https://ecodistricts.org/district-profile/sun-valley-ecodistrict/
- Ellen, I. G. (2020). What do we know about housing choice vouchers? Regional Science and Urban Economics, 80), https://doi.org/10.1016/j.regsciurbeco.2018.07.003
- Evans, G., Wells, N., & Moch, A. (2003). Housing and mental health: A review of the evidence and a methodological and conceptual critique. Journal of Social Issues, 59(3), 475–500. https://doi.org/10.1111/1540-4560.00074
- Gennetian, L. A., Sanbonmatsu, L., & Ludwig, J. (2011). An overview of moving to opportunity a random assignment housing mobility study in five U.S. cities. In H. B. Newburger, E. L. Birch, & S. M. Wachter (Eds.), Neighborhood and life chances: How place matters in modern America (pp. 163–178). University of Pennsylvania Press. https://doi.org/10.9783/9780812200089
- Hamlin, M., & Oberle, P. (2022). Seeing like the shadow state: Philanthropy, memory, and public housing redevelopment in Syracuse, NY. Urban Geography, https://doi.org/10.1080/02723638.2022.2054624
- Jackson, M. (2018). Sun Valley could be Denver’s next big thing. Westworld. https://www.westword.com/news/sun-valley-one-of-denvers-oldest-and-poorest-areas-could-be-the-next-big-thing-9981911
- Jones, K. T., & Popke, J. (2010). Re-envisioning the city: Lefebvre, HOPE VI, and the neoliberalization of urban space. Urban Geography, 31(1), 114–133. https://doi.org/10.2747/0272-3638.31.1.114
- Orum, A. M., & López-Morales, E. (2023). State-led gentrification. In A. M. Orum (Ed.), The Wiley Blackwell encyclopedia of urban and regional studies. https://doi.org/10.1002/9781118568446.eurs0321
- Pendall, R., & Hendey, L. (2013). A brief look at the early implementation of choice neighborhoods. The Urban Institute. https://www.urban.org/sites/default/files/publication/24126/412940-a-brief-look-at-the-early-implementation-of-choice-neighborhoods_1.pdf
- Popkin, S., Docter, B., O’Brien, M., Galvez, M., Levy, D., Brennan, M., & Fischer, W. (2020). The future of public housing: Confronting the challenges facing the public housing program. Urban Institute. https://www.urban.org/sites/default/files/publication/102188/the-future-of-public-housing-confronting-the-challenges-facing-the-public-housing-program_0.pdf
- Poverty & Race Research Action Council. (2022). Expanding choice: Practical strategies for building a successful housing mobility program. Appendix B: State, local, and federal laws barring source of income discrimination. https://www.prrac.org/pdf/AppendixB.pdf
- Schwartz, A., & McClure, K. (2021). The rental assistance demonstration program and its current and projected consumption of low-income housing tax credits. Cityscape, 23(2), 9–26. https://www.jstor.org/stable/27039948
- Urban Institute. (2004). A decade of HOPE VI: Research findings and policy challenges. https://www.urban.org/sites/default/files/alfresco/publication-pdfs/411002-A-Decade-of-HOPE-VI.PDF
- US Census Bureau. (2020). 2015–2019 American community survey 5-year estimates. https://factfinder.census.gov
- Watt, P. (2009). Housing stock transfers, regeneration and state-led gentrification in London. Urban Policy and Research, 27(3), 229–242. https://doi.org/10.1080/08111140903154147
- Watt, P. (2021). Estate regeneration and its discontents: Public housing, place and inequality in London. Policy Press. https://doi.org/10.2307/j.ctv1k03g3p