
 ?Mathematical formulae have been encoded as MathML and are displayed in this HTML version using MathJax in order to improve their display. Uncheck the box to turn MathJax off. This feature requires Javascript. Click on a formula to zoom.
Abstract
Flow occurs in most powder-based processes, opposed by various cohesive forces. Magnetism is often overlooked for metal powders. Here, flowability and magnetization were measured for a dual-phase steel powder in size fractions from to > 200 µm. The finest fraction did not flow through a Hall flowmeter, then flow time increased continuously with particle size from 12 ± 1 s for the next fraction (
) to > 28 ± 0.5 s for > 200 µm. Drying had little effect. Key metrics derived from shear tests gave no overall relationship between flow behavior and particle size. Magnetism was considered the most likely reason for this behavior. Magnetometry showed a remanent magnetization of
which causes ∼ 5 µN cohesion between 200 µm diameter particles. X-ray diffractometry showed that the powder contained 77 wt%-80 wt% of (magnetic) martensite. Liquid bridging, van der Waals forces and friction (in the Hall flowmeter geometry) contribute 50 µN, 0.08 µN and 4 µN, respectively, to cohesion in 200 µm particles. These results can be used to help explain flow behavior in other magnetic powders and allow optimization of powders and/or powder-based processes.
1. Introduction
Metal powder flow is critical for many processes. From the filling of containers for storage to filling of molds for sintering, flow has a profound effect on the performance or suitability of a metal powder for a given application. There are several studies that consider the flow behavior of metal powders in terms of cohesive forces, but many of these do not consider magnetism as they deal with nonmetallic powders (Rumpf Citation1958; Turner and Balasubramanian Citation1974). Some studies do mention magnetism, although it is often neglected due to the particular materials being studied not being magnetic (Visser, Citation1989). However, there are materials that are often processed as powders that contain magnetic phases, such as martensitic or ferritic stainless steels (Jerrard, Hao, and Evans Citation2009; Murr et al. Citation2012; Liu et al. Citation2016; Hengsbach et al. Citation2017; Ponnusamy et al. Citation2017; Zhukov, Barakhtin, and Kuznetsov Citation2017; Alnajjar et al. Citation2019; Chang et al. Citation2020). It is plausible that magnetism has a significant effect on the powder behavior and relevant standards recommend that magnetism is considered (International Standards Organisation Citation2020). Many studies that consider powder flow or fluidization assume that cohesion is a single quantity rather than a combination of separate contributions (Mutsers and Rietema Citation1977; Chaudhuri et al. Citation2006; Mukherjee et al. Citation2018). This is done either because the origin of cohesion is not of direct interest to the study, or because no data are available to quantify the individual contributions. The current study aims to estimate the relative importance of various cohesive forces including magnetism to explain the flow behavior of a martensitic stainless steel (AISI 420) under both unconfined flow and during shear under a compressive load. First, it is necessary to consider the possible origins of cohesive forces and quantify any that may be significant. To simplify analysis, it is assumed that the cohesive forces act between two spherical particles of identical size that are either touching or sitting some short distance apart.
1.1. Liquid bridging
Liquid bridging can oppose the relative motion of particles by cohesive effects that arise due to surface tension of the liquid or through viscous effects that dissipate energy (Rietema Citation1991; Mikami, Kamiya, and Horio Citation1998). For water at room temperature, the force is dominated by surface tension (Ennis, Tardos, and Pfeffer Citation1991). In metal powder at ambient humidity, the level of moisture is likely to be low so that any moisture forms with thin necks at contact points, possibly with thin films elsewhere (Wright and Raper Citation1998; Boyce Citation2018). For two spheres of equal radius with a symmetrical liquid bridge, the force may be estimated using a simple expression (EquationEquation 1(1)
(1) , where
is the cohesive force due to the liquid bridge with a surface tension,
that forms a neck with a wetting angle,
acting on two spheres of diameter, D, that are very close together) (Maugis Citation1987; Pitois, Moucheront, and Chateau Citation2000). Water in air has a surface tension,
(Pérez-Díaz, Álvarez-Valenzuela, and García-Prada Citation2012). The wetting angle,
can exist over a range of
to
It is difficult to measure the contact angle of water on such small particles, but a small contact angle (
) may be assumed to give an upper bound of force (EquationEquation 2
(2)
(2) ) (Boyce Citation2018). It is also possible to include liquid bridging quantitatively in discrete element modeling simulations of particle interactions (Mikami, Kamiya, and Horio Citation1998).
(1)
(1)
(2)
(2)
1.2. Adsorbed water film
At low relative humidity, there is unlikely to be sufficient water present to form liquid bridges everywhere in the powder ensemble. Water will always bind strongly to the particle surfaces to form a thin layer that covers the individual particles. These films are too thin to form necks, but will exert a cohesive force as they join together when two particles approach each other: which depends on the thickness of the films,
surface tension,
and particle diameter, D (Turner and Balasubramanian Citation1974). The adsorbed layer can be up to 3 nm thick (Rumpf Citation1958), which gives an upper bound of
(EquationEquation 4
(4)
(4) ).
(3)
(3)
(4)
(4)
1.3. Electrostatic forces
The peak force between two oppositely-charged insulating particles depends on the particle diameter, D, and the strength of the electric field induced by the particles, (EquationEquation 5
(5)
(5) ) (Lapple and Adhesion Citation1970; Feng and Hays Citation2003). The electrostatic field could have a maximum intensity of the breakdown voltage of air,
which would result in a force of
N for a 20 µm diameter particle.
(5)
(5)
However, the current material is an electronic conductor, which greatly diminishes the electrostatic attraction, as charge can occupy the whole volume, not just the surface, and can leak away easily (Lapple and Adhesion Citation1970; Feng and Hays Citation2003). Furthermore, previous work has shown that electrostatic forces provide a relatively minor contribution to overall cohesion (Turner and Balasubramanian Citation1974; Rietema Citation1991). Therefore, electrostatic forces will not be considered further in this study.
1.4. Friction
The force that arises due friction is well known to depend on the normal contact force between the particles and the coefficient of friction, One example in literature gives the value of
for a hypothetical particle that was intended to be representative of many materials and was not taken for a specific case (Mikami, Kamiya, and Horio Citation1998). Measurements on powder friction are often performed using a die and gives the effective coefficient of friction of the ensemble. However, this will depend on the friction between adjacent particles and such measurements give coefficient of friction similar to the value suggested previously (Solimanjad Citation2003): a study of the compaction of iron powder showed a coefficient of friction between 0.4 and 0.5 (Olsson and Bexell Citation2011). A value of 0.5 will be used in this study to provide an upper bound of the frictional force.
The normal contact force is difficult to estimate, as is the frictional force itself (Turner and Balasubramanian Citation1974), but a first approximation may be made by assuming a close-packed array of particles with horizontal close-packed layers. Each particle then effectively occupies a cross-sectional area of and each particle makes contact with three particles in the next layer, with a normal contact force orientated at
to the vertical. Thus, the normal force may be estimated in terms of a normal compressive stress,
(EquationEquation 6
(6)
(6) ), which is used to derive a frictional force (EquationEquation 7
(7)
(7) ).
(6)
(6)
(7)
(7)
The compressive stress may arise due to an externally applied force, which will be the case in shear cell tests, or due to the weight of the powder itself, as in Hall flow. The stress caused by the weight of powder may be estimated from the apparent density of the powder, the height of the powder above a point of interest, h and acceleration due to gravity, g (EquationEquation 8
(8)
(8) ). The height of the powder in a Hall flowmeter may be derived from the geometry of the funnel (approximated as a ‘right circular cone’ with an aperture angle,
), the mass of the sample,
50 g at the start of the test, and the apparent density (EquationEquation 9
(9)
(9) ).
(8)
(8)
(9)
(9)
1.5. Van der Waals forces
Van der Waals forces are routinely considered during calculations of cohesion in metal powders and are known to be significant in the adhesion of fine particles (Zimon and Corn Citation1969; Turner and Balasubramanian Citation1974). Using the simplification of smooth spheres of identical chemistry, the magnitude of the van der Waals force, is given by a simple equation that depends on D, their separation, R and a materials property known as the Hamaker constant,
J (EquationEquation 10
(10)
(10) ) (Turner and Balasubramanian Citation1974; Tomas and Kleinschmidt Citation2009; Tolias Citation2020). It is expected that van der Waals’ forces can affect flow if they are at least comparable with gravity and can cause adhesion if they are on hundred times stronger than the gravitational force acting on one particle (Tomas and Kleinschmidt Citation2009).
(10)
(10)
Particle separation, R, is a key parameter when quantifying the strength of van der Waals forces. In smooth, spherical particles, R will tend to be very small, which is usually the condition assumed in literature. However, various phenomena such as surface roughness, irregular particle shapes and the presence of small particles can disrupt contact between large particles. This will increase the effective particle separation and decrease the effective strength of van der Waals forces (Visser Citation1989; Zhu et al. Citation2017). It is also possible for forces to increase if particles deform and the contact area between the particles increases (Molerus Citation1975). Measurements of the forces required to separate a pair of powder particles under conditions in which van der Waals forces were believed to be dominant have found that this cohesive force is approximately N (Jones et al. Citation2003).
1.6. Magnetic forces
Two bodies that are magnetized can rotate to minimize the energy of the total magnetic field around them and this leads to an attractive force between them. This could occur in powder particles (). Considering the case of two touching spheres of the same material and radius, the magnitude of this attractive force may be expressed relatively simply (EquationEquation 11
(11)
(11) , where
is the permeability of free space and M is the volumetric magnetization of the particles) (Edwards et al. Citation2017). EquationEquation 11
(11)
(11) is consistent with the expression presented by Visser in a previous study of powder cohesion (Visser Citation1989). This represents an upper bound of the cohesive force between two particles due to magnetization, as the force will diminish for non-spherical particles (Osborn Citation1945), for scenarios in which the magnetic dipoles do not completely align and if there is any gap between the particles. Particles also influence the magnetization of neighboring particles (Bjørk and Bahl Citation2013; Oxley, Goodell, and Molt Citation2009). The magnetic properties of a moving powder ensemble represents an interesting and detailed problem that must be studied in great detail to understand the behavior of magnetic powders fully. Such a study is beyond the scope of the current study, which will seek to quantify the magnetic force in a static powder in the simplified case of touching, smooth, spherical particles.
(11)
(11)
Figure 1. Schematic of a simplified case, in which the displacement vector between the and
spheres and the magnetic dipole moments of both spheres align — an upper bound for the magnitude of the magnetic force.
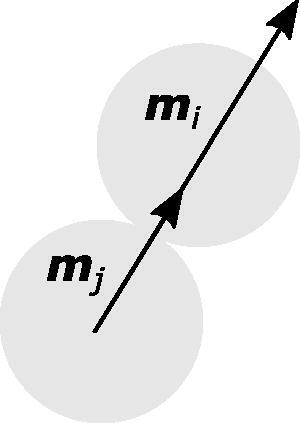
If there is constant magnetization, the magnetic force increases as the radius of the spheres increases. Therefore, it is reasonable to expect that magnetic cohesion within a flowing magnetic powder will increase with particle size. The only rational explanations as to why this may not have an effect are if the magnetic forces are negligible compared to other cohesive forces, if the magnetization becomes weaker as the spheres get larger, such that the product DM is constant or decreases with increasing particle size, or if the particles become so non-spherical that the effective magnetization decreases due to the demagnetization factor (which quantifies the effect of non-isotropic shapes on magnetic fields) (Osborn Citation1945).
1.7. Gravity
Unlike the other forces, which only oppose flow, gravity can cause flow. In uncompressed powders, it also provides the origin of frictional forces. The gravitational force is proportional to the particle mass, which is determined by D, the bulk density, and the acceleration due to gravity, g following the well-known Newton’s law of gravitation (EquationEquation 12
(12)
(12) ).
(12)
(12)
This study aims to characterize the powders to study the relative importance of magnetic attraction and other cohesive forces. This will then be compared to measured flow behavior to test if the calculations are applicable to the powder tested.
2. Materials and methods
2.1. Metal powder
All tests in this study were performed on gas atomized AISI420 martensitic stainless steel (Erasteel Kloster AB, Söderfors, Sweden). The powder was provided in the as-atomized state, without any sieving or classification. The powder was sieved for 15 min using a Retsch AS200 Control automated sieve stack. The fractions were selected from available mesh sizes to provide the narrowest possible size range while maintaining sufficient mass to allow standard analysis techniques. The sieves used were: 20 µm, 40 µm, 45 µm, 50 µm, 56 µm, 71 µm, 80 µm, 90 µm, 100 µm, 125 µm, 140 µm, 160 µm, 180 µm, 200 µm. The mass of powder below 20 µm was very small and could not be tested.
2.2. Hall flowmeter
The sieved powder was subjected to Hall flow testing in accordance with the relevant international standard: ISO 4490:2018 (International Standards Organisation Citation2018) using a Hall funnel (Qualtech Products, Industry, Denver, CO, USA). In accordance with the ISO standard, all flow times are reported to the nearest second. All tests were performed a minimum of three times. Uncertainties are presented as either ± 0.5 s or the standard deviation of the measurements, whichever is greater.
2.3. Angle of repose
The powder was tested in an angle of repose meter (Qualtech Products, Industry, Denver, CO, USA). The method was in compliance with the active standard: ISO 4324:1977 (International Standards Organisation Citation1977, Citation2020). The equipment used in this study deviates slightly from the standard as the distance that the powder will drop is 105 mm instead of the required 75 mm. It is not expected that this will impact the results significantly, although this assumption has not been tested explicitly for the current equipment. All angles were measured three times for each pile, at intervals and each powder was tested three times. The uncertainty is assessed to be dominated by the scatter in the data and so the standard deviation of the data is used to calculate the size of the error bars.
2.4. Shear cell testing
Shear cell testing was performed using a FT4 powder rheometer (Freeman Technology Ltd., Tewksbury, UK; now part of Micrometrics, Norcross, GA, USA). Due to a lack of mass in each fraction, it was not possible to perform a flowability test in this study. However, sear cell testing, which requires less powder, was performed on fractions across the size distribution. Shear cell tests find the stress required to cause motion under various compressive stresses and a Mohr’s circle diagram is constructed to derive various metrics. The software provided by the manufacturer (Freeman Technology Data Analysis v4.0.17 for Windows) was used to analyze the shear cell testing data. Both ‘cohesion’, which gives the effective shear strength under zero applied compressive stress and ‘unconfined yield stress’, which gives the effective yield strength under zero shear stress, can be used to infer information about the cohesive forces in the ensemble. Before testing, compressive pre-stress of 9 kPa was applied to compact the powder, in accordance with the relevant standard: ASTM D7891 (ASTM International Citation2015). Cohesion is believed to be similar to the stress required to pull apart particles in the powder ensemble and compression is expected to lead to a higher cohesion (Jones et al. Citation2003). Each test was performed three times per size fraction.
2.5. Metallography
A small mass of selected fractions from across the size distribution was mounted in phenolic mounting resin and prepared using standard metallographic procedures to a 1 µm finish for examination in an optical microscope. The open source image analysis software ImageJ was used to measure particle sizes within each fraction and to derive shape metrics (Schneider, Rasband, and Eliceiri Citation2012). A stereological correction factor of was used to calculate the expected mean particle sizes from the micrographs (Underwood Citation1984). Statistics were derived in accordance with the international standard for static image analysis: ISO 13322-1:2014, including the area of each particle, A, the perimeter, P the equivalent diameter,
(EquationEquation 13
(13)
(13) ) (International Standards Organisation Citation2014). Applying the stereological correction factor to the circular equivalent diameter provides an estimation for the particle size distribution from micrographs,
(EquationEquation 14
(14)
(14) ). A measure of the shape of the particles, circularity, C is also calculated (EquationEquation 15
(15)
(15) ). C = 1 for a circle and is lower otherwise.
(13)
(13)
(14)
(14)
(15)
(15)
2.6. X-ray diffractometry
Samples of selected fractions from across the size distribution were tested using X-ray diffractometry to determine the phases present and their relative abundance. Tests were performed using a Bruker Panalytical D8 Discovery X-ray diffractometer with a copper source, no filter and a LynxEye detector with a detection range. During the test, an angular range of
was used with a step size of
and a dwell time of 1.0 s. Two further experiments were conducted for each size fraction to ensure repeatability. Due to limitations in equipment availability, the repeats were performed using a dwell time of 0.8 s. A constant illumination length of 10 mm was used in all experiments.
The data were processed using a built-in algorithm in the software Diffrac.Suite Eva to convert the data to emulate a constant illumination angle (rather than constant illumination length), which allows easier analysis. Data were analyzed by Rietveld refinement using the program MAUD (Lutterotti, Matthies, and Wenk Citation1999). A calibration dataset of powdered silicon was used to calibrate broadening caused by the diffractometer in accordance with recommended practice (McCusker et al. Citation1999). Results are presented as the mean and standard deviation of the three experiments conducted for each size fraction.
2.7. Magnetometry
10 mg samples of each size class were tested in a EG&G model 155 vibrating sample magnetometer (Princeton Applied search Corporation, now part of AMETEK Inc., Berwyn, PA, USA) to measure the magnetization of the powder. All samples were first degaussed to remove any magnetic history. A field was then applied up to a maximum of The field was then reduced to
and then increased back to
to give a complete hysteresis loop. Since the powder is used in the absence of any applied field, it is the magnetic moment under zero applied field (the remanent moment) that is of interest in the current study. This was measured in both halves of the hysteresis curve and the absolute values of the two measurements were averaged.
3. Results
All raw data are available from a permanent online repository for further analysis (Hulme-Smith Citation2021).
3.1. Hall flowmeter and angle of repose
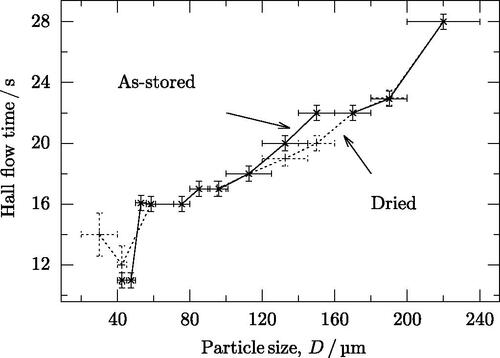
The finest fraction () did not flow without drying, and required continual tapping to encourage flow, even after drying. The next finest fraction (
) required a single tap to initiate flow in both the as-stored and dried conditions. Other fractions flowed without tapping, but below 50 µm, the powder exhibited ratholing during flow; above this, the flow was free. With the exception of enabling flow in the finest fraction, drying had no significant effect on flow time in the powder ().
Figure 2. Hall flow times for 50 g of powder. The powder did not flow through the Hall funnel without drying for the size fraction Error bars in the y axes are the standard deviation of the repeated measurements; error bars in the x axis are the range of particle sizes in each fraction.
3.2. Angle of repose
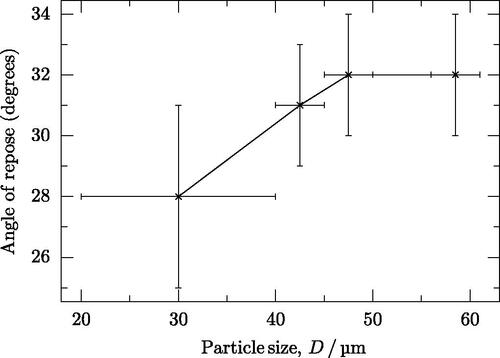
The angle of repose increased with particle size (). However, it was only possible to record the angle of repose for the four finest particle fractions. All fractions above this failed to form any pile and all powder particles fell off the flat surface. In these cases, powder did not flow preferentially in any direction and there was a similar amount of powder at all locations around the machine after the tests were complete.
Figure 3. Angle of repose results in the as-stored (non-dried) condition. Angles of repose could not be measured for particles larger than the data shown here, as the powder did not form a pile. Error bars in the y axes are the standard deviation of the repeated measurements; error bars in the x axis are the range of particle sizes in each fraction.
3.3. Shear cell
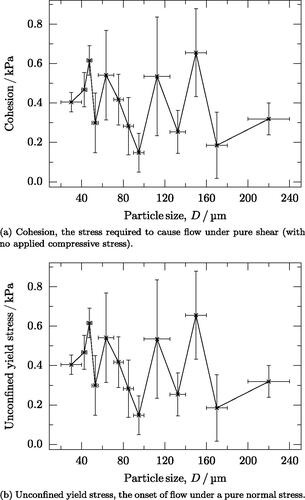
Neither the cohesion nor the unconfined yield stress show any overall dependence on particle size (). However, both are greatest for the finest particles.
Figure 4. Two metrics from shear test data that represent the resistance to flow under various stress states. Larger values imply more resistance to flow. (a) Cohesion, the stress required to cause flow under pure shear (with no applied compressive stress). (b) Unconfined yield stress, the onset of flow under a pure normal stress.
3.4. Metallography
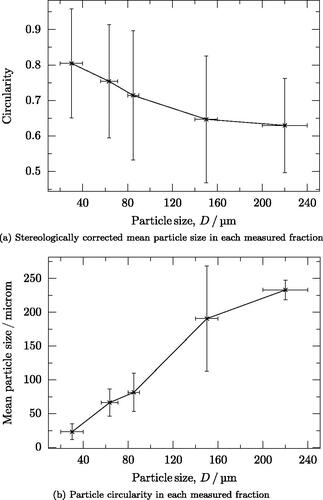
Optical micrographs show that both spherical and irregular particles form in all size classes, including the smallest () and the largest (). The stereologically-corrected particle size of each fraction is similar to the assumed fraction with the exception of the fraction of (). The circularity generally decreases as the particles get bigger ().
Figure 5. Optical micrographs of the powder studied. (a) (b)
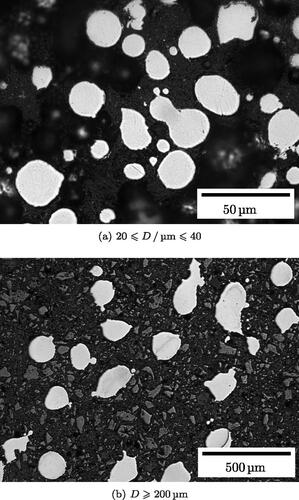
Figure 6. Optical microscopy and static image analysis of particle fractions. Error bars in the y axes are the standard deviation of the data for the particles sampled and those in the x axis are the ranges of the particle size fraction, except the fraction over 200 µm, which is assumed to be 20 µm. (a) Stereologically corrected mean particle size in each measured fraction. (b) Particle circularity in each measured fraction.
3.5. X-ray diffractometry
X-ray diffractometry shows that all fractions contain only two phases, well-described by a face-centred cubic phase (austenite) and body-centred tetragonal phase (martensite). Ferrite will be avoided due to the rapid cooling during gas atomization (Abbasi-khazaei and Mollaahmadi Citation2017). All samples showed a similar volume fraction of martensite, 77–80 wt%, with a maximum standard deviation for the repeats of any size fraction of 0.4 wt%. The most significant uncertainty in the phase fraction is the uncertainty in the Rietveld refinement of each size fraction, the largest of which is 1.1 wt%.
3.6. Magnetometry
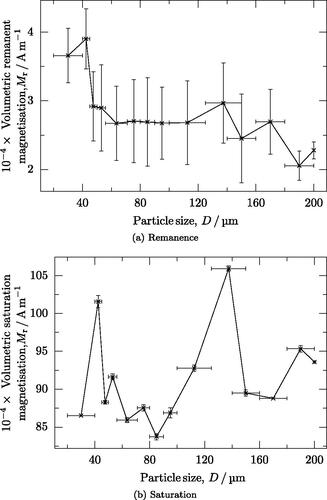
During testing, the samples were found to be magnetically soft with a significant remanence. One example of the data obtained during this study is given in , which is representative of all datasets. The magnetometry data show that all samples retain a similar remanence and saturation (). The smallest particles seem to exhibit a slightly stronger remanence than larger particles, although the remanence is of a similar magnitude in all samples () The saturation magnetization of all samples is similar ().
Figure 7. Magnetization hysteresis curve for powder with particles in the size range The inset shows an enlarged versions of the curve about zero applied field. The dashed lines indicate zero applied field and the remanent magnetization in the powder sample.
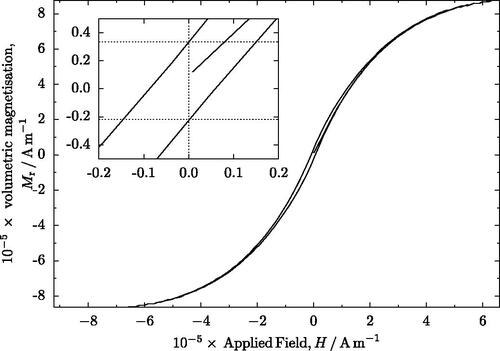
Figure 8. Volumetric magnetization in the powder fractions. Error bars in the y axes are the standard deviation of the measurements in the positive and negative branches of the hysteresis loop; error bars in the x axis are the range of particle sizes in each fraction. (a) Remanence. (b) Saturation.
4. Discussion
4.1. Overview of forces
A summary of all forces acting on the particles is given in . All forces are calculated for smooth spheres either in contact with each other (friction, magnetism), at an appropriate separation for any adsorbed liquids to be in contact (for liquid bridging, adsorbed films), or at 1 nm separation (van der Waals forces). Magnetic force is calculated assuming a magnetization equal to the larger spheres in this study (30000 Am−1). Friction was calculated using a compressive stress of 5 kPa (representative of the normal stress during shear strength measurements in the shear cell) or caused by the weight of the powder at the start of a flowmeter test. Mutual gravitational forces between particles are negligible. Particle interlocking has not been considered as it is impossible to quantify using algebra and is unlikely to be significant for spherical or near-spherical particles. While there are significant uncertainties in the calculations of each force, which shall be considered, the relative magnitude of each force is likely to be correct.
Figure 9. Magnitude of forces that could act on particles during flow in a flowmeter or in a shear cell, based on the equations outlined in this article.
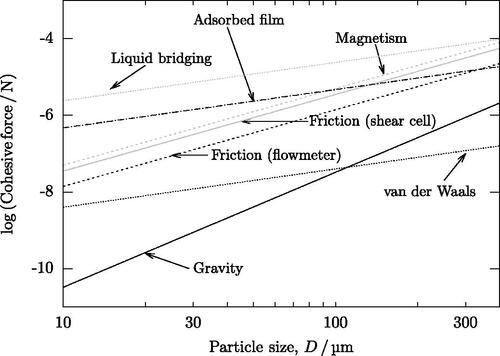
4.1.1. Gravity
Gravity is weak compared to most cohesive forces, although it exceeds van der Waals forces for particles over 100 µm. The gravitational force is proportional to the density and volume of the particles (EquationEquation 12(12)
(12) ). The density of individual particles is usually assumed to be close to the density of bulk material, as gaps between particles do not need to be accounted for (which is done in other powder density measurements, such as apparent density). However, the magnitude of the gravitational force is likely to be dominated by the effects of size and shape, so these must be known to a good degree of accuracy to ensure a realistic prediction of gravitational force. If particles are non-spherical, this will significantly impact the form of EquationEquation 12
(12)
(12) , with the D3 term replaced by another term appropriate for the geometry of the particle. In the current study, all particles are assumed to be spheres with a single diameter. Both of these assumptions represent potential sources of inaccuracy. In the widest particle fraction, the width has a range of 25 µm. However, the uncertainty in the finest size fraction (
) is more significant. This leads to a variation in gravitational force of a factor of eight within the size fraction. However, the relatively low value of gravitational force acting on each particle renders such inaccuracies fairly insignificant on the overall behavior of particles. Nevertheless, this may be significant in some studies where gravity is comparable to other forces.
4.1.2. Van der Waals forces
Van der Waals forces are predicted to be approximately one hundred times stronger than gravity for the finest particles, at which point such forces are able to impede flow, but not prevent it. Although van der Waals forces do become stronger as particle size increases, they do so more slowly than other forces. The relative strength of van der Waals forces decreases until they are similar to gravity for particles of 100 µm and then become smaller. Compared to other cohesive forces, van der Waals forces are the least significant considered in the current study ().
The van der Waals force is proportional to the Hamaker constant, H, particle diameter, D and inversely proportional to the separation between particles (EquationEquation 10(10)
(10) ). The value of the Hamaker constant is affected by the surface condition of the powders, such as the presence of oxides. Literature also presents values of the Hamaker constant for iron particles that cover two orders of magnitude. Deviation from spherical particles will also affect the effective separation of the particles. It is difficult to know any of the parameters accurately. Using estimates of the parameters allow the van der Waals forces to be calculated to an order of magnitude, which is significantly smaller than other cohesive forces. Such a calculation shows that a highly accurate determination of the van der Waals force is not essential to understand the behavior of the power ensemble in the current study.
4.1.3. Magnetism
For large particles, magnetism is as significant as liquid bridging and stronger than all other forces. Similarly, for fine particles, it is more significant than other forces, with the exception of liquid-based forces. If liquid-based forces are absent, magnetic forces are the most significant cohesive force, subject to the assumptions in the current study.
The magnetic cohesive force is proportional to the square of the particle diameter. The force is also proportional to the volumetric magnetization (EquationEquation 11(11)
(11) ). The latter was measured for the current powder, while the former is known to a reasonable accuracy as the powder has been sieved. However, as has already been mentioned, each size fraction is assumed to consist of one size only, which is a simplification and the largest error this leads to is a factor of four in the magnetic cohesive force, which is unlikely to alter the conclusions of this study. Based on the measurements performed in the current study, the particle magnetization is constant to within a factor of two and is, therefore, unlikely to contribute significantly to uncertainty in the strength of the magnetic force.
Deviations from a spherical shape or any surface roughness will cause most cohesive forces to decrease in strength, as the effective separation between the particles will increase. The only exceptions to this are gravity, which depends only on the volume of the particle, not its shape or roughness and magnetism, where self-demagnetization or the effects of neighboring particles could cause stronger fields to develop at some regions of non-spherical particles and weaker fields at others (Osborn Citation1945; Bjørk and Bahl Citation2013). This is likely to be more significant than uncertainties in particle size and magnetization. Further work is recommended to understand these effects better and to derive an expression by which these effects can be accounted for in modeling of powder ensembles.
4.1.4. Moisture effects
Liquid bridging is expected to be dominant in the particle sizes studied here, with adsorbed water films next most important below particle sizes of 90 µm and magnetism above this (). It appears as though gravity will not be sufficient to overcome cohesive forces in a flowmeter until the particles are 10 µm in diameter.
In the case of liquid bridging, the upper bound of the force is proportional to the particle size and the surface energy (EquationEquation 2(2)
(2) ). The force is, therefore, relatively insensitive to estimations. The surface energies of water on many metals are well known and the particle diameter is known within the limits of the sieving. Therefore, there is unlikely to be more than a 50% uncertainty in the liquid bridging force, which is a result of the width of the smallest size class. Beyond this, the liquid bridging force could be significantly smaller if the wetting angle of the liquid bridge is large (EquationEquation 1
(1)
(1) ). These data are not reported for articles of the size considered here, so the angle has been assumed to be small to give an upper bound of the force. Further research is required to measure or otherwise derive the wetting angle on small particles and apply this to calculate the liquid bridging force.
Film adhesion depends on film thickness, particle size and surface tension of the liquid on the particle. As for liquid bridging, the surface energies and particle size are well known. In addition, the adsorbed film thickness is usually in the nanometer range — a film will never form with a thickness above 3 nm and thinner films will lead to weaker forces. A film must have a thickness of at least one water molecule, plus the distance between the particle surface and the molecule itself. A water molecule is approximately m wide, which is a reasonable lower bound for the layer thickness. This means the layer thickness is known to within one order of magnitude and since the resulting force is proportional to layer thickness, it cannot change by more than this amount.
4.1.5. Friction
Friction is larger in shear cell tests, where the applied compressive load gives rise to larger frictional forces, while in other cases only the weight of the powder itself contributes to friction. The magnitude of friction is approximately three orders of magnitude larger than gravity for the finest particles (). This is consistent with the strength required to make the powder ‘adhesive’ (i.e., the cohesive force is more than 100 time stronger than gravity) (Tomas and Kleinschmidt Citation2009). Increasing the particle size to reduces the ratio of friction to gravity below 100 and the powder will be free-flowing. If fluid-based forces or magnetism are dominant, gravity will only cause powder to become free-flowing above approximately 200 µm.
Friction depends proportionally on both the normal contact force between two particles and the coefficient of friction between them. The normal contact force can be approximated fairly well as described previously. A discrete element model (DEM) simulation of a Hall flow funnel was performed for a powder comprising perfectly spherical particles of diameter using the software EDEM 2020. Inter-particle forces were calculated using a Hertz-Mindlin model and a coefficient of friction of 0.5. The simulation showed compressive forces up to
N, but only for a very small number of particles. Most particles were under compressive loads of no more than
N, which would result in frictional forces of
N, consistent with the calculations performed here. The coefficient of friction,
is reported in literature to be in the region of
Clearly, this introduces some error, but not enough to change any conclusions of this study.
The application of discrete element modeling to such fine powders is yet to be validated, which should be done to give confidence to such models when they are applied to simulate powder handling or processing. However, much work is underway to achieve such confidence, both using a single ‘cohesion’ force (Chaudhuri et al. Citation2006; Mukherjee et al. Citation2018) with quantified contributions to particle cohesion (Mikami, Kamiya, and Horio Citation1998; Abbasfard, Evans, and Moreno-Atanasio Citation2016; Meier et al. Citation2019). Analysis of the relative importance of input parameters to the modeling results should also be performed to help design powders optimized for flow and/or spreading. Examples of appropriate analyses have been presented in Barati et al. and Akbari and Barati (Barati, Rahimi, and Akbari Citation2012; Akbari and Barati Citation2012).
4.2. Hall flowmeter
4.2.1. Gravity, friction and Van der Waals forces
When the powder does not flow (i.e., the size fraction ), it is expected that the van der Waals forces are more than ten times stronger than gravity acting on one particle and the frictional forces are one hundred times stronger than gravity (). In size classes for which a single tap is required to start flow (
) or ratholing is observed (
and
), van der Waals forces are several times stronger than gravity and friction is one hundred times stronger than gravity. For coarser size fractions, gravity is within two orders of magnitude of friction and exceeds van der Waals forces when the particle diameter exceeds 100 µm. These findings are consistent with literature that flow will be affected when gravity and cohesive forces have these relative strengths (Tomas and Kleinschmidt, Citation2009). However, this implies that the other cohesive forces are much weaker than predicted in . This is explained by the presence of surface roughness, irregular particles, or satellites. All of these phenomena increase the effective separation of the particles (Tomas and Kleinschmidt Citation2009). The powders in this study certainly contain non-spherical particles ().
4.2.2. Moisture
The fact that Hall flow occurs without drying and the fact that drying has no significant effect suggest that forces that depend on moisture are not significant. This is consistent with literature that suggests that such mechanisms are insignificant below some lower limit: 65% (Zimon and Corn Citation1969; Turner and Balasubramanian Citation1974; Wright and Raper Citation1998), or 66% (Stanford and DellaCorte Citation2006). At the time when data were collected for the current study, the lab in which the equipment is situated had a relative humidity of between 20% and 30%, measured using four independent SDS011 air quality sensors and a Testo 174H temperature and humidity sensor. Measurements of the force required to separate a pair of particles conducted using atomic force microscopy have also shown that not all materials are susceptible to cohesive forces due to humidity (Jones et al. Citation2003). It is, therefore, unlikely that moisture affected the flow behavior of this material under the conditions tested and related mechanisms can safely be ignored. If moisture is ignored, then the predicted cohesive force is approximately N and is dominated by magnetism. In the absence of magnetism, the remaining cohesive force in particles of 50 µm diameter is dominated by friction and is approximately
N, which agrees with the relevant atomic force microscopy measurements performed on particles of that size (Jones et al. Citation2003).
4.2.3. Magnetic forces
The Hall flow tests indicate that once particles are large enough to permit flow, the flow rate gradually decreases as particle size increases (). This implies that cohesive forces in the powder increase and is in contradiction to accepted behavior (Liu et al. Citation2008), but the flow times themselves are consistent with other results (Stanford Citation2002; Kulkarni, Berry, and Bradley Citation2010; Vlachos and Chang Citation2011; Moghadasi et al. Citation2020; Dai et al. Citation2021). Even some studies on powder that is likely to be magnetic do not follow the trend observed in this study. One example is the study by Dobson and Starr (Citation2021), although that study focused on atomization conditions, with each sample produced in a separate atomization run, which could easily change other properties between samples. In this study, all sample come from one atomization run, which should avoid similar confounding factors. Furthermore, some literature does contain results that are consistent with the current observations, for example (Yang and Evans Citation2005; Vasquez et al. Citation2020; Rock et al. Citation2021). Those angle of repose tests that were possible also seems to support this trend ().
The majority of systematic studies of flow time and particle size originate from particle recycling during additive manufacturing. Amongst these studies, many observe a decrease in flow time as fine particles are gradually removed and particle size increases, (Tang et al. Citation2015; Nguyen et al. Citation2017; Harkin et al. Citation2020). Some show no dependence of flow time on particle size (Terrassa et al. Citation2018)) and some show an increase of flow time with the particle size (Carroll et al. Citation2006; Popov et al. Citation2018; Rock et al. Citation2021). However, in recycling studies, the chemistry of the particles changes, in particular the surface chemistry, with higher contents of oxygen and nitrogen accumulating as powder is recycled. This is generally considered to have the greatest effect on the flowability and, by extension, the cohesive forces. In addition, repeated heating can alter the microstructure of the powders, which may also affect magnetism. In this study, all particles have a very similar history and have not been heated above 105 ∘C (the temperature at which drying was performed) at any time since they were first atomized. Therefore it is unlikely that the surface condition of the particles will be significantly different and the explanations offered in studies about powder recycling are not relevant.
Another possible explanation is that the larger particles caused partial clogging of the opening of the Hall flowmeter. However, this is unlikely, as the flow time rose gradually from a particle size of 40 µm, which is much too small to cause clogging.
4.3. Shear cell testing
Shear cell testing greatly reduces the effect of gravity, as the powder flows horizontally under an applied compressive stress that is much larger than that caused by the weight of the powder in the Hall flowmeter. The unconfined yield stress and cohesion show no dependence on particle size, which implies that the cohesive forces during the shear test do not depend strongly on particle size. The shear cell test does not require particles to move apart but simply to begin to undergo rearrangement — the shear stress is recorded at the point when the ensemble first begins to rearrange. This requires that frictional forces are overcome, but not necessarily magnetic forces, as the particles can remain close together, even if sliding occurs. Since the friction under the applied compressive load is expected to be larger than other sources of cohesion except magnetism (), it is likely that this friction dominates the cohesive forces during the shear tests. In a situation such as high humidity, when another force could become significant, different behavior may be observed, but this is not observed in the current study.
4.4. X-ray diffraction and phase analysis
The alloy studied consists of martensite and retained austenite. It is commonly known that it is the martensite that is magnetic. The fact that saturation magnetization has no dependence on particle size () is consistent with the analysis of the X-ray diffraction results, which show a martensite volume fraction, of between 77% and 80%. The well-known and widely used Koistinen-Marburger equation (EquationEquation 16
(16)
(16) ) predicts 79% martensite, assuming an exponential coefficient,
which is common for many steels (Koistinen and Marburger Citation1959), a martensite start temperature,
C, which is reported for the current alloy (Zhu et al. Citation2018) and a final temperature,
C.
is the fraction of the material that was austenite and was available to transform to martensite. In the current case,
(16)
(16)
4.5. Magnetization
The change in remanent magnetization from the finest particles to the coarsest () is relatively small. Since the tests are performed without an external field, it is the remanent magnetization (the magnetization remaining in the particles when no field is applied) that will determine the behavior of the powder. Such a small change is unlikely to cause a significant change in behavior in the powders and will be dominated by the change in diameter (Equationequation 11(11)
(11) ). The small change that does occur in remanent magnetization may be caused by the change in average particle shape, with larger particles being less spherical ( cf. ) and so more prone to demagnetization. This is difficult to investigate and quantify explicitly, but an attempt should be made in the future to understand the influence particle shape has on magnetic forces in metal powder ensembles.
The findings imply that powders that have the potential to be magnetic should be degaussed to remove their magnetization and eliminate magnetic cohesion. While it is possible to overcome this for small samples, such as the 10 mg samples used in the magnetometer experiments in this study, it is more difficult to degauss a large ensemble — such as would be of practical use in a manufacturing process — in a reasonable time. Further studies should be conducted to confirm if magnetism is indeed the cause of the results obtained in this study and to test how effective different degaussing techniques are.
The fact that powder can flow despite the presence of magnetism is consistent with the relative sizes of the two forces: magnetism is always approximately 100–1000 stronger than gravity in this study. This leads to the powder being ‘adhesive,’ but the cohesive forces are not able to stop flow completely (Tomas and Kleinschmidt Citation2009). It is also possible that the strength of the magnetic force is lower than that calculated in this study due to the effects of particle shape (Osborn Citation1945). However, the magnetization measured experimentally will already be affected by any shape effects, so it is likely that this is the true effective magnetization of the powder particles in each case and no further correction needs to be applied. Interactions2 between particles may also alter the strength of the magnetic force, but it is beyond the scope of this study to predict that effect (Bjørk and Bahl Citation2013).
5. Conclusions and future work
Flow tests have been conducted on ferromagnetic powder, AISI 420 martensitic stainless steel. The flowability has been quantified using a Hall flowmeter, angle of repose and shear cell testing as a function of particle size.
An assessment of the relative magnitude of different cohesive forces using available data reveals that magnetism is significant up to 500 µm diameter particles.
Drying has little effect on flow in a Hall flowmeter. This implies that forces arising from moisture are not significant in this study.
The force due to gravity is expected to be several orders of magnitude lower than all cohesive forces studied for particles that are 20–40 µm in diameter. This is consistent with the lack of flow for particles of that size.
The need for tapping to initiate flow for particle between the sizes of 40 µm and 50 µm is consistent with the expected strength of gravity compared to van der Waals forces, magnetism, friction — the strongest cohesive forces are approximately one hundred times stronger than gravity.
If sufficient compressive stress is applied, friction can be of similar magnitude to magnetic force and alters the dependence of flow behavior on particle size.
The measured remanent magnetization is highest for the finest particles. This may be due to the fact that the larger particles are less spherical and therefore exhibit a shape effect that reduces the measured magnetization. However, further in-depth study is required to understand this phenomena precisely.
The findings of this study can be used to inform future developments of contact forces for discrete element modeling (DEM) simulations.
Degaussing the powder will remove magnetic effects and would allow a direct comparison of the flowability in the magnetized and demagnetized state, but is difficult to achieve in practice. Further studies to investigate the effects of degaussing similar powder is warranted.
Further research to improve the quality of data for the calculations used in this study will improve future modeling of cohesive forces, including discrete element modeling. Sensitivity analysis for input parameters should be performed to find the properties that have the strongest influence on powder flow.
Acknowledgment
The author gratefully acknowledges the contribution of Dr Valter Ström who helped perform and process the data from the magnetometry experiments. This work received no dedicated funding.
Disclosure statement
No potential conflict of interest was reported by the author(s).
Data availability statement
All data used in this article are available from a permanent online repository (Hulme-Smith, Citation2021).
References
- Abbasfard, H., G. Evans, and R. Moreno-Atanasio. 2016. Effect of Van der Waals force cut-off distance on adhesive collision parameters in DEM simulation. Powder Technology 299:9–18. doi: https://doi.org/10.1016/j.powtec.2016.05.020.
- Abbasi-Khazaei, B., and A. Mollaahmadi. 2017. Rapid tempering of martensitic stainless steel AISI420: Microstructure, mechanical and corrosion properties. Journal of Materials Engineering and Performance26 (4):1626–33. doi: https://doi.org/10.1007/s11665-017-2605-y.
- Akbari, G. H., and R. Barati. 2012. Comprehensive analysis of flooding in unmanaged catchments. Proceedings of the Institution of Civil Engineers - Water Management165 (4):229–38. doi: https://doi.org/10.1680/wama.10.00036.
- Alnajjar, M., F. Christien, K. Wolski, and C. Bosch. 2019. Evidence of austenite by-passing in a stainless steel obtained from laser melting additive manufacturing. Additive Manufacturing25:187–95. doi: https://doi.org/10.1016/j.addma.2018.11.004.
- ASTM International. 2015. Standard test method for shear testing of powders using the Freeman technology. Technical report. West Conshohocken, PA, USA: ASTM International.
- Barati, R., S. Rahimi, and G. H. Akbari. 2012. Analysis of dynamic wave model for flood routing in natural rivers. Water Science and Engineering5 (3):243–58.
- Bjørk, R., and C. R. H. Bahl. 2013. Demagnetization factor for a powder of randomly packed spherical particles. Applied Physics Letters103 (10):102403. doi: https://doi.org/10.1063/1.4820141.
- Boyce, C. M. 2018. Gas-solid fluidization with liquid bridging: A review from a modeling perspective. Powder Technology336:12–29. doi: https://doi.org/10.1016/j.powtec.2018.05.027.
- Carroll, P. A., A. J. Pinkerton, J. Allen, W. U. H. Syed, H. K. Sezer, P. Brown, G. Ng, R. Scudamore, and L. Li. 2006. The effect of powder recycling in direct metal laser deposition on powder and manufactured part characteristics. In Proceedings of AVT-139 Specialists Meeting on Cost Effective Manufacture via Net Shape Processing. NATO Research and Technology Organisation, Neuilly, Paris, France, March 23–27.
- Chang, C.,X. Yan, R. Bolot, J. Gardan, S. Gao, M. Liu, H. Liao, M. Chemkhi, and S. Deng. 2020. Influence of post-heat treatments on the mechanical properties of CX stainless steel fabricated by selective laser melting. Journal of Materials Science55 (19):8303–16. doi: https://doi.org/10.1007/s10853-020-04566-x.
- Chaudhuri, B., A. Mehrotra, F. J. Muzzio, and M. S. Tomassone. 2006. Cohesive effects in powder mixing in a tumbling blender. Powder Technology165 (2):105–14. doi: https://doi.org/10.1016/j.powtec.2006.04.001.
- Dai, L., Y. R. Chan, G. Vastola, N. Khan, S. Raghavan, and Y. W. Zhang. 2021. Characterizing the intrinsic properties of powder – a combined discrete element analysis and Hall flowmeter testing study. Advanced Powder Technology32 (1):80–7. doi: https://doi.org/10.1016/j.apt.2020.11.015.
- Dobson, S. D., and T. L. Starr. 2021. Powder characterization and part density for powder bed fusion of 17-4 PH stainless steel. Rapid Prototyping Journal27 (1):53–8. doi: https://doi.org/10.1108/RPJ-01-2020-0023.
- Edwards, B. F., D. M. Riffe, J.-Y. Ji, and W. A. Booth. 2017. Interactions between uniformly magnetized spheres. American Journal of Physics85 (2):130–4. doi: https://doi.org/10.1119/1.4973409.
- Ennis, B. J., G. Tardos, and R. Pfeffer. 1991. A microlevel-based characterization of granulation phenomena. Powder Technology65 (1–3):257–72. doi: https://doi.org/10.1016/0032-5910(91)80189-P.
- Feng, J. Q., and D. A. Hays. 2003. Relative importance of electrostatic forces on powder particles. Powder Technology135–136:65–75. doi: https://doi.org/10.1016/j.powtec.2003.08.005.
- Harkin, R., H. Wu, S. Nikam, J. Quinn, and S. McFadden. 2020. Reuse of grade 23 ti6al4v powder during the laser-based powder bed fusion process. Metals10 (12):1700–14. doi: https://doi.org/10.3390/met10121700.
- Hengsbach, F., P. Koppa, K. Duschik, M. J. Holzweissig, M. Burns, J. Nellesen, W. Tillmann, T. Tröster, K. P. Hoyer, and M. Schaper. 2017. Duplex stainless steel fabricated by selective laser melting –microstructural and mechanical properties. Materials & Design 133:136–42. doi: https://doi.org/10.1016/j.matdes.2017.07.046.
- Hulme-Smith, C. N. 2021. Research dataset for flow behaviour of magnetic steel powder. doi: https://doi.org/10.5281/zenodo.5070929.
- International Organization for Standardization.1977. ISO 4324: Surface active agents – powders and granules –measurement of the angle of repose. Geneva, Switzerland: International Organisation for Standardization.
- International Organization for Standardization 2014. ISO 13322-1:2014: particle size analysis – image analysis methods –part 1: Static image analysis methods. Geneva, Switzerland: International Organization for Standardization.
- International Organization for Standardization 2018. ISO 4490:2018 metallic powders – determination of flow rate by means of a calibrated funnel (Hall flowmeter). Geneva, Switzerland: International Organization for Standardization.
- International Organization for Standardization.2020. Additive manufacturing. Feedstock materials. Methods to characterize metal powders. Geneva, Switzerland: International Organization for Standardization.
- Jerrard, P. G., L. Hao, and K. E. Evans. 2009. Experimental investigation into selective laser melting of austenitic and martensitic stainless steel powder mixtures. Proceedings of the Institution of Mechanical Engineers, Part B: Journal of Engineering Manufacture223 (11):1409–16. doi: https://doi.org/10.1243/09544054JEM1574.
- Jones, R., H. M. Pollock, D. Geldart, and A. Verlinden. 2003. Inter-particle forces in cohesive powders studied by AFM: Effects of relative humidity, particle size and wall adhesion. Powder Technology132 (2–3):196–210. doi: https://doi.org/10.1016/S0032-5910(03)00072-X.
- Koistinen, D. P., and R. E. Marburger. 1959. A general equation prescribing the extent of the austenite-martensite transformation in pure iron-carbon alloys and plain carbon steels. Acta Metallurgica7 (1):59–60. doi: https://doi.org/10.1016/0001-6160(59)90170-1.
- Kulkarni, P. A., R. J. Berry, and M. S. Bradley. 2010. Review of the flowability measuring techniques for powder metallurgy industry. Proceedings of the Institution of Mechanical Engineers, Part E: Journal of Process Mechanical Engineering224 (3):159–68. doi: https://doi.org/10.1243/09544089JPME299.
- Lapple, C. E., and G. O. Adhesion. 1970. Electrostatic phenomena with particulates. In Advances in Chemical Engineering, ed.T. B. Drew, G. R. Cokelet, J. W. Hoopes, and T. Vermeulen, vol. 8, 1–96. Cambridge, MA: Academic Press, Inc.
- Liu, L. X., I. Marziano, A. C. Bentham, J. D. Litster, E. T. White, and T. Howes. 2008. Effect of particle properties on the flowability of ibuprofen powders. International Journal of Pharmaceutics362 (1–2):109–17. doi: https://doi.org/10.1016/j.ijpharm.2008.06.023.
- Liu, Y., A. Li, X. Cheng, S. Q. Zhang, and H. M. Wang. 2016. Effects of heat treatment on microstructure and tensile properties of laser melting deposited AISI 431 martensitic stainless steel. Materials Science and Engineering: A 666:27–33. doi: https://doi.org/10.1016/j.msea.2016.04.014.
- Lutterotti, L., S. Matthies, and H.-R. Wenk. 1999. MAUD (material analysis using diffraction): A user friendly Java program for Rietveld texture analysis and more. In Proceeding of the Twelfth International Conference on Textures of Materials (ICOTOM-12), McGill University, Montreal, Canada, August 9–13.
- Maugis, D. 1987. Adherence of elastomers: Fracture mechanics aspects. Journal of Adhesion Science and Technology1 (1):105–34. doi: https://doi.org/10.1163/156856187X00120.
- McCusker, L. B., R. B. Von Dreele, D. E. Cox, D. Louër, P. Scardi, D. Louër, and P. Scardi. 1999.Rietveld refinement guidelines. Journal of Applied Crystallography32 (1):36–50. doi: https://doi.org/10.1107/S0021889898009856.
- Meier, C., R. Weissbach, J. Weinberg, W. A. Wall, and A. J. Hart. 2019. Modeling and characterization of cohesion in fine metal powders with a focus on additive manufacturing process simulations. Powder Technology343:855–66. doi: https://doi.org/10.1016/j.powtec.2018.11.072.
- Mikami, T., H. Kamiya, and M. Horio. 1998. Numerical simulation of cohesive powder behavior in a fluidized bed. Chemical Engineering Science53 (10):1927–40. doi: https://doi.org/10.1016/S0009-2509(97)00325-4.
- Moghadasi, M., W. Du, M. Li, Z. Pei, and C. Ma. 2020. Ceramic binder jetting additive manufacturing: Effects of particle size on feedstock powder and final part properties. Ceramics International46 (10):16966–72. doi: https://doi.org/10.1016/j.ceramint.2020.03.280.
- Molerus, O. 1975. Theory of yield of cohesive powders. Powder Technology12 (3):259–75. doi: https://doi.org/10.1016/0032-5910(75)85025-X.
- Mukherjee, R., C. Mao, S. Chattoraj, and B. Chaudhuri. 2018. DEM based computational model to predict moisture induced cohesion in pharmaceutical powders. International Journal of Pharmaceutics536 (1):301–9. doi: https://doi.org/10.1016/j.ijpharm.2017.12.001.
- Murr, L. E., E. Martinez, J. Hernandez, S. Collins, K. N. Amato, S. M. Gaytan, and P. W. Shindo. 2012. Microstructures and properties of 17-4 PH stainless steel fabricated by selective laser melting. Journal of Materials Research and Technology1 (3):167–77. doi: https://doi.org/10.1016/S2238-7854(12)70029-7.
- Mutsers, S. M., and K. Rietema. 1977. The effect of interparticle forces on the expansion of a homogeneous gas-fluidized bed. Powder Technology18 (2):239–48. doi: https://doi.org/10.1016/0032-5910(77)80014-4.
- Nguyen, Q. B., M. L. S. Nai, Z. Zhu, C.-N N. Sun, J. Wei, and W. Zhou. 2017. Characteristics of Inconel powders for powder-bed additive manufacturing. Engineering3 (5):695–700. doi: https://doi.org/10.1016/J.ENG.2017.05.012.
- Olsson, M., and U. Bexell. 2011. Friction characteristics and material transfer tendency in metal powder compaction. Wear271 (9–10):1903–8. doi: https://doi.org/10.1016/j.wear.2011.01.050.
- Osborn, J. A. 1945. Demagnetizing factors of the general ellipsoid. Physical Review67 (11–12):351–7. doi: https://doi.org/10.1103/PhysRev.67.351.
- Oxley, P., J. Goodell, and R. Molt. 2009. Magnetic properties of stainless steels at room and cryogenic temperatures. Journal of Magnetism and Magnetic Materials321 (14):2107–14. doi: https://doi.org/10.1016/j.jmmm.2009.01.002.
- Pérez-Díaz, J. L., M. A. Álvarez-Valenzuela, and J. C. García-Prada. 2012. The effect of the partial pressure of water vapor on the surface tension of the liquid water-air interface. Journal of Colloid and Interface Science381 (1):180–2. doi: https://doi.org/10.1016/j.jcis.2012.05.034.
- Pitois, O., P. Moucheront, and X. Chateau. 2000. Liquid bridge between two moving spheres: An experimental study of viscosity effects. Journal of Colloid and Interface Science231 (1):26–31. doi: https://doi.org/10.1006/jcis.2000.7096.
- Ponnusamy, P.,. S. H. Masood, S. Palanisamy, R. A. Rahman Rashid, and D. Ruan. 2017. Characterization of 17-4PH alloy processed by selective laser melting. Materials Today: Proceedings4 (8):8498–506. doi: https://doi.org/10.1016/j.matpr.2017.07.196.
- Popov, V. V., A. Katz-Demyanetz, A. Garkun, and M. Bamberger. 2018. The effect of powder recycling on the mechanical properties and microstructure of electron beam melted Ti-6Al-4V specimens. Additive Manufacturing22 (May):834–43. doi: https://doi.org/10.1016/j.addma.2018.06.003.
- Rietema, K. 1991. The dynamics of fine powders. Dordrecht: Springer Netherlands.
- Rock, C., C. Ledford, M. Garcia-Avila, H. West, V. M. Miller, M. Pankow, R. Dehoff, and T. Horn. 2021.The influence of powder reuse on the properties of nickel super alloy ATI 718TM in laser powder bed fusion additive manufacturing. Metallurgical and Materials Transactions B52 (2):676–88. doi: https://doi.org/10.1007/s11663-020-02040-2.
- Rumpf, H. 1958. Grundlagen und Methoden des Granulierens. Chemie Ingenieur Technik – CIT30 (3):144–58. doi: https://doi.org/10.1002/cite.330300307.
- Schneider, C. A., W. S. Rasband, and K. W. Eliceiri. 2012. NIH image to ImageJ: 25 Years of image analysis. Nature Methods9 (7):671–5. doi: https://doi.org/10.1038/nmeth.2089.
- Solimanjad, N. 2003. New method for measuring and characterisation of friction coefficient at wide range of densities in metal powder compaction. Powder Metallurgy46 (1):49–54. doi: https://doi.org/10.1179/003258903225010488.
- Stanford, K. 2002. Particle size effects plasma on flow feedstock properties powder of blend. Technical report, NASA Center for Aerospace Information, Hanover, MD and/or National Technical Information Service, Springfield, VA.
- Stanford, M. K., and C. DellaCorte. 2006. Effects of humidity on the flow characteristics of a composite plasma spray powder. Journal of Thermal Spray Technology15 (1):33–6. doi: https://doi.org/10.1361/105996306X92550.
- Tang, H. P., M. Qian, N. Liu, X. Z. Zhang, G. Y. Yang, and J. Wang. 2015. Effect of powder reuse times on additive manufacturing of Ti-6Al-4V by selective electron beam melting. Journal of the Minerals Metals and Materials Society. 67 (3):555–63. doi: https://doi.org/10.1007/s11837-015-1300-4.
- Terrassa, K. L., J. C. Haley, B. E. MacDonald, and J. M. Schoenung. 2018. Reuse of powder feedstock for directed energy deposition. Powder Technology338:819–29. doi: https://doi.org/10.1016/j.powtec.2018.07.065.
- Tolias, P. 2020. Non-retarded room temperature Hamaker constants between elemental metals. Surface Science700 (June):121652. doi: https://doi.org/10.1016/j.susc.2020.121652.
- Tomas, J., and S. Kleinschmidt. 2009. Improvement of flowability of fine cohesive powders by flow additives. Chemical Engineering & Technology32 (10):1470–83. doi: https://doi.org/10.1002/ceat.200900173.
- Turner, G. A., and M. Balasubramanian. 1974. Investigations of the contributions to the tensile strength of weak particulate masses. Powder Technology10 (3):121–7. doi: https://doi.org/10.1016/0032-5910(74)80037-9.
- Underwood, E. E. 1984. Particle size distribution. In Quantitative microscopy, chapter particle s, ed. F. N. Rhines and R. T. Dehoff,149–200. New York, N. Y., U. S. A.: McGraw-Hill.
- Vasquez, E., P. F. Giroux, F. Lomello, M. Nussbaum, H. Maskrot, F. Schuster, and P. Castany. 2020. Effect of powder characteristics on production of oxide dispersion strengthened Fe14Cr steel by laser powder bed fusion. Powder Technology360:998–1005. doi: https://doi.org/10.1016/j.powtec.2019.11.022.
- Visser, J. 1989. Van der Waals and other cohesive forces affecting powder fluidization. Powder Technology58 (1):1–10. doi: https://doi.org/10.1016/0032-5910(89)80001-4.
- Vlachos, N., and I. T. Chang. 2011. Investigation of flow properties of metal powders from narrow particle size distribution to polydisperse mixtures through an improved Hall-flowmeter. Powder Technology205 (1–3):71–80. doi: https://doi.org/10.1016/j.powtec.2010.08.067.
- Wright, P. C., and J. A. Raper. 1998. Examination of dispersed liquid-phase three-phase fluidized beds Part 1. Non-porous, uniform particle systems. Powder Technology97 (3):208–26. doi: https://doi.org/10.1016/S0032-5910(98)00014-X.
- Yang, S., and J. R. Evans. 2005. Flow rate of metal powders at reduced and elevated air pressure. Powder Technology154 (2–3):95–8. doi: https://doi.org/10.1016/j.powtec.2005.04.038.
- Zhu, H., Y. Li, B. Li, Z. Zhang, and C. Qiu. 2018. Effects of low-temperature tempering on microstructure and properties of the laser-cladded AISI 420 martensitic stainless steel coating. Coatings8 (12):451–10. doi: https://doi.org/10.3390/coatings8120451.
- Zhu, X., Q. Zhang, C. Huang, Y. Wang, C. Yang, and F. Wei. 2017. Validation of surface coating with nanoparticles to improve the flowability of fine cohesive powders. Particuology30:53–61. doi: https://doi.org/10.1016/j.partic.2016.09.001.
- Zhukov, A., B. Barakhtin, and P. Kuznetsov. 2017. Study of strength characteristics of steel specimens after selective laser melting of powder materials 17-4PH, 316L, 321. Physics Procedia89:179–86. doi: https://doi.org/10.1016/j.phpro.2017.08.012.
- Zimon, A. D., and M. Corn. 1969. Adhesion of dust and powder. Boston, MA: Springer US.