Abstract
The deposition of submicrometer soot aerosol particles in a miniature pipe bundle heat exchanger system has been investigated under conditions characteristic for combustion exhaust from diesel engines and oil or biomass burning processes. The system has been characterized for a wide range of aerosol inlet temperatures (390–510 K) and flow velocities (1–4 m s−1), and particle deposition efficiencies up to 45% have been achieved over an effective deposition length of 27 cm. Thermophoresis was the dominant deposition mechanism, and its decoupling from isothermal deposition was consistent with the assumption of independently acting processes. The measured deposition efficiencies can be described by simple linear parameterizations based on an approximation formula for thermophoretic plate precipitators. The results of this study support the development of modified heat exchanger systems with enhanced capability for filterless removal of combustion aerosol particles.
INTRODUCTION
Ultrafine combustion aerosol particles pose a potential threat to human health since they can enter the alveolar system of human lungs. Therefore, public authorities and industry aim to reduce particle emissions by means of combustion process development and exhaust gas treatment. In many applications, conventional filter systems lead to an undesired increase of pressure drop and are prone to clogging by soot and oil ashes (CitationNeeft et al. 1996). Electrostatic filtration has found wide application to remove combustion particles; however, this method imposes high investment and running costs. Due to the limitations of particle loading by their size, small particles between 10 and 30 nm cannot be removed reliably. Furthermore, electrostatic precipitators can generate undesired gaseous components, especially when operated with negative voltage (CitationYehia et al. 2000). Turbulent precipitators showed particle deposition efficiencies of up to 35% with significantly reduced removal of particles in the range between 80 and 300 nm (Citationvan Gulijk et al. 2001). CitationShi and Harrison (2001) report on thermophoretic deposition of diesel soot in a water-cooled fluidized bed. In diesel processes (CitationShi et al. 1999) nearly all particles are in the submicrometer size range based on particle mass; in the case of biomass burning (CitationBaumbach 1993) it is more than 80%. CitationMesserer et al. (2003) could show that the thermophoretic coefficient of ultrafine soot agglomerate particles exhibits no significant dependency on agglomerate size. Therefore, thermophoretic soot particle removal can provide a reliable solution for filterless combustion aerosol deposition in the submicrometer size range. Sufficient temperature gradients for particulate removal can be established in heat exchangers, so that future engineering could focus on the parallel optimization of heat transfer and submicrometer particulate removal in one device.
CitationByers and Calvert (1969) were the first to perform experiments and analyses of thermophoretic deposition of particles in a hot turbulent gas stream from the aspect of air cleaning. CitationNishio et al. (1974) investigated the thermophoretic deposition of aerosol particles in a heat exchanger pipe, in particular the influence of fouling on the long-term heat exchange behavior of the tube. Further studies of thermophoretic particle deposition in externally cooled tubes include CitationStratmann and Fissan (1989), CitationChang et al. (1990), CitationMontassier et al. (1991), CitationSasse and Nazaroff (1994), CitationChang et al. (1995), and CitationLin and Tsai (2003). CitationSasse and Nazaroff (1994) performed a numerical simulation of a tobacco smoke particle filter based on thermophoretic deposition from natural convection flow. They emphasize the necessity for a proof-of-principle experiment for the validation of their simulation results. Up to now little information about the thermophoretic deposition of submicrometer aerosol particles at high flow velocities in the temperature gradient field around internally cooled tubes is available.
Thermophoretic particle motion can be described by (CitationTalbot et al. 1980)
Miniaturized heat exchanger systems provide a high surface-to-volume ratio and therefore lead to high heat transfer rates even under laminar flow conditions. The heat transfer behavior in these devices has been investigated by a number of researchers over the last decade, e.g., CitationPeng et al. (1995). Due to high temperature gradients thermophoresis is expected to be significantly higher than in conventional heat exchangers for particle-loaded flows. To our knowledge this is the first study on the removal of aerosol particles in the external flow around cooling tubes in a miniature heat exchanger under experimental conditions relevant for modern combustion exhaust systems with aerosol flow velocities between 1 and 4 m s− 1.
METHODS
High Temperature Gradient Pipe Bundle Heat Exchanger
shows the cross-sectional area of the miniature pipe bundle heat exchanger that has been designed and used to investigate particle deposition at high gas flow rates and temperature gradients. Twenty seven stainless steel tubes with an inner diameter of 0.99 mm and an outer diameter of 1.59 mm are arranged in a near-quadratic area of 10.4 · 10.5 mm such that the axes of all tubes are near-equidistant. At their ends 5 mm of each tube are fitted into 10 mm stainless steel blocks, which are inserted into a stainless steel channel. The top of the channel can be removed to control the alignment of the tubes as well as the soot deposition (). The 2 mm viton sealing in the top was found to be leak proof for the experimental conditions of this study. Along the 300 mm effective length of the tubes between the two blocks the bottom area of the channel as well as the top were formed in a way that reduces the free space towards the tubes, simulating half-perimeter tubes directly mounted at the bottom and top plate.
FIG. 1 Cross-sectional area of the miniature pipe bundle heat exchanger. Pipe inner diameter d i = 0.99 mm, outer diameter d o = 1.59 mm. Aerosol flow around the cooling tubes flown through by cooling air.
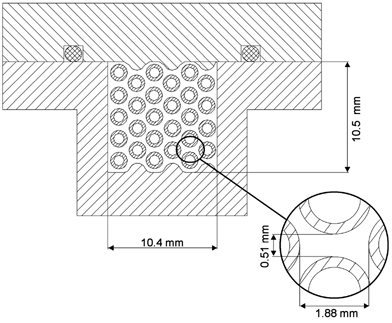
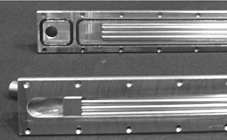
FIG. 2 Photograph of the pipe bundle heat exchanger inlet section.
The hot aerosol was led into the channel by a 8 mm d i tube at an angle of 35° as a compromise between engineering requirements and a high fluid impulse in axial direction to minimize turbulences in the entry region of the tube channel (). The aerosol outlet was designed symmetrically. The cooling fluid—in the study presented here pressurized air—was added by 8 mm d i tubes through the top plate and by a smooth 90° curvature directed into the steel blocks supporting the 27 heat exchanger tubes. The pipe inlets were conical to minimize pressure build up by the inflowing cooling gas. The outlet was symmetrical. The whole heat exchanger was thermally insulated to reduce heat transfer to and from the channel. Therefore the aerosol flowing between the outer tubes and the walls of the heat exchanger heated up the channel walls, and so no significant undesired thermal gradients that would increase thermophoretic deposition towards a cooler channel wall were established. The walls of the upper and lower plate were adopted to the void space to reduce the aerosol flow between the channel walls and the outer tubes. At the same time there was still space between the outer tubes and the channel walls to avoid direct thermal contact and conductive heat transfer between the wall and tubes. According to the cross-sectional areas () only about 10% of the aerosol flow passed between the outer tubes and the wall. Therefore, the particle deposition effects observed in this study were not significantly influenced by these boundary phenomena. The internal cooling of the 27 tubes lead to a smaller thermal axial expansion of the tubes in comparison to the channel housing the steel blocks. Therefore the tubes were equidistantly distributed over the whole heat exchanger length. The effective deposition length can be calculated from the tube length between the stainless steel blocks, the distance between the blocks, and the axial position where the inflowing aerosol comes in contact with the cooling tubes: L = 300 − 2 · (15) = 270 mm. The relative error in the determination of the deposition length resulting from the diameter of the inflowing aerosol tube (8 mm) is ±3%.
FIG. 3 Longitudinal section of the pipe bundle heat exchanger. Note the symmetrical design of the deposition device.
Temperatures of the system were measured with four K-type thermocouples (accuracy ±0.1 K). The thermocouples for the aerosol inlet and outlet were placed in the center of the 8 mm tubes about 2 mm before the tube bundle. The thermocouples for the cooling gas inlet and outlet were mounted in the center of the tube blocks at a distance of about 3 mm.
Experimental Setup and Measurement Procedure
The complete experimental setup applied in this study is outlined in . The test aerosol particles were produced by a spark discharge between graphite electrodes (Alfa Aesar, Karlsruhe, Germany, purity 99.9995%) in a 3.7 l min− 1 argon flow (Messer Griesheim, Krefeld, Germany, purity 4.6). The primary carbon particles produced with the applied spark discharge aerosol generator are known to have a diameter of ∼5 nm (PALAS GfG 1000, Karlsruhe, Germany; CitationEvans et al. 2003). After passing through an agglomeration reservoir (2 l glass flask), the aerosol flow was diluted with 4.4 l min− 1of filtered nitrogen and led through a Kr 85 aerosol neutralizer (10 mCi). The aerosol flow through the pipe bundle heat exchanger was controlled by venting the excess through an outlet valve into the exhaust line. Before entering the heat exchanger system the aerosol was heated to the desired inlet temperature.
FIG. 4 Schematic flow diagram of the experimental setup for counterflow heat exchanger particle deposition measurements.
The symmetric sampling setup at ambient temperature and equal flow conditions enabled near-identical aerosol sampling conditions before and after the heat exchanger. Thus the significant thermophoretic losses which are known to occur upon cooling of a hot aerosol flow to ambient temperature in a sampling line (CitationBerger et al. 1995) could be avoided. Other potential effects of the sampling process on the aerosol properties can be assumed to cancel out and were neglected in the measurement data analysis.
Particle number size distributions were measured with a scanning mobility particle sizer (SMPS) system consisting of an electrostatic classifier (TSI 3071) and a condensation particle counter (TSI 3025) operated with a sample flow of 1 l min− 1, a sheath air flow of 10 l min− 1, and a scan time of 120 s (measurement range 20–300 nm). Before the SMPS, the particle concentration in the sample flow was reduced by a ratio of 1:20 in a dynamic dilution system (TOPAS DDS 560) to minimize soiling and transient particle deposition in the measurement device. The particle size spectra were analyzed with a resolution of 16 particle size classes i per decade, providing sufficient information on the size distribution of the sparkdischarge soot aerosol and maintaining a high signal-to-noise level at the same time.
The parameters describing flow and temperature properties of the different experiments are summarized in . After every experiment the pipe bundle heat exchanger was flushed with pressurized air at flow velocities of about 40 m s− 1 to reliably remove soot deposits on the tubes, which influence particle deposition and heat transfer properties.
TABLE 1 Experimental parameters for the investigation of the particle deposition mechanisms in the miniature pipe bundle heat exchanger
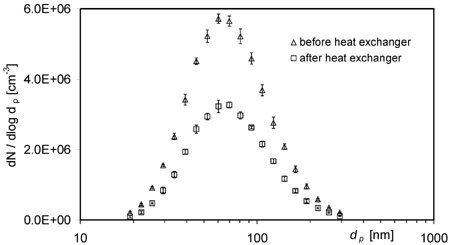
The spark-discharge soot aerosol exhibited an approximated log-normal size distribution with a median particle diameter of about 82 nm, a geometric standard deviation of 1.64, and a number concentration between 6 and 9 · 106 cm− 3. It is similar to those encountered in the exhaust of modern heavy duty diesel engines (CitationShi et al. 1999). The average particle size distribution before and after the heat exchanger for experiment Id is given in .
FIG. 5 Soot-particle size distributions measured before and after the heat exchanger in experiment Ia (arithmetic mean ± standard deviation of 6 measurements each).
For each set of parameters the heat exchanger system was heated up by the aerosol flow until thermal equilibrium was reached. Then 12 consecutive particle size distribution measurements were taken, alternatingly before and after the heat exchanger. For every switching, the particle concentration difference was divided by the particle concentration measured before the precipitator. The arithmetic mean of the 11 values per particle size class i obtained by this procedure was taken as the (size-dependent) total deposition efficiency, ϵ tot,i . The measured total deposition efficiency can be split into an isothermal contribution ϵ iso,i caused by diffusion, impaction, and interception under isothermal flow conditions and a thermophoretic contribution ϵ th , i . ϵ iso,i is the deposition efficiency measured when the heat exchanger was operated under isothermal but otherwise unchanged conditions. It was generally in the range of 2–20%.
The small volume of the heat exchanger necessitates a macroscopic description of the thermal gas properties by measuring temperatures at the hot aerosol inlet, T h,in, the aerosol outlet, T h,out, the cooling gas inlet, T c,in, and the cooling gas outlet, T c,out. The logarithmic mean temperature difference, Δ T log,mean which is generally used to describe heat transfer characteristics, is given by
RESULTS AND DISCUSSION
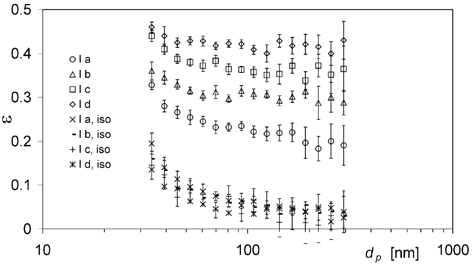
In the measured ϵtot,i and ϵiso,i are displayed for the conditions of experiment series I with average aerosol flow velocities v x,0 between 1.15 and 1.28 m s−1. Small particles in the size range of 34 to 70 nm are found to exhibit significant particle deposition up to 20% in the case of small aerosol flows through the heat exchanger when no temperature gradients are established. This observation can be attributed to diffusion processes occuring in the heat exchanger, leading to an increased particle deposition with decreasing d p . Increasing T h,in leads to significantly enhanced particle deposition ϵtot,i , indicating that thermophoretic deposition occurs.
FIG. 6 Total particle deposition efficiencies ϵtot,i and isothermal losses ϵiso,i in the pipe bundle heat exchanger for experiments Ia–Id. Data points with error bars represent the arithmetic mean ± standard deviation of 11 differential measurement values.
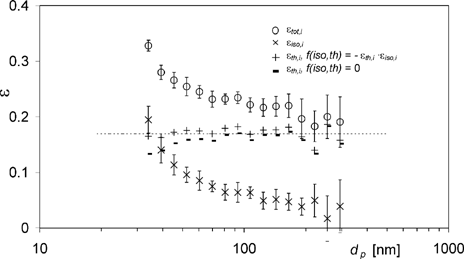
To investigate the contribution of thermophoresis to the total particulate deposition ϵtot,i , the different deposition mechanisms have to be decoupled. The first step in decoupling the thermophoretic deposition component ϵth,i is to determine how the mechanisms couple together. A general expression for combining the mechanisms occuring in this study is given by
FIG. 7 Total particle deposition efficiencies ϵtot,i , isothermal losses ϵiso,i , and thermophoretic deposition efficiencies ϵth,i calculated with f(iso,th) = −ϵth,i · ϵiso,I and f(iso,th) = 0, respectively, for experiment Ia. Data points with error bars represent the arithmetic mean ± standard deviation of 11 differential measurement values; dashed line illustrates ϵth,avg calculated with f(iso,th) = −ϵth,i · ϵiso,i .
A detailed mathematical model of particle deposition in the pipe bundle heat exchanger would require solving a complex set of differential equations describing fluid flow, heat transfer, and particle motion by extensive numerical calculations for every relevant set of experimental conditions. To find a simple semiempirical parameterization of deposition efficiency as a function of temperature and flow conditions, we tested the applicability of the plate precipitator formula in EquationEquation (2).
In the average total particle deposition efficiencies ϵtot,avg from all experiments are plotted against the dimensionless “precipitator number” (Lμ0Δ T log,mean)/(v x,0ρ0 TH ch 2). μ0, v x,0 and ρ0 are the arithmetic mean values of the gas properties calculated for the temperatures of the aerosol flow at the inlet and outlet of the heat exchanger (T h,in, T h,out), respectively. L and Δ T log,mean are the effective deposition length and logarithmic mean temperature difference as defined above. H ch is the characteristic distance for particle deposition along the temperature gradient perpendicular to the gas flow. In a plate precipitator it is the distance between the hot and cold plates. For the miniature pipe bundle heat exchanger it was calculated as the arithmetic mean of vertical and horizontal half-distances between the outer surfaces of the cooling pipes: H ch = 0.25 · (0.51 mm + 1.88 mm) = 0.60 mm (). This is assumed to be a characteristic average for the varying distances between maximum temperatures in the middle of the flow channels and minimum temperatures at the cooling pipe surfaces.
FIG. 8 Total particle deposition efficiency ϵtot,avg plotted against the dimensionless precipitator number calculated from average flow parameters, (Lμ0Δ T log,mean)/(v 0ρ0 T 0 H ch 2). The lines are linear least-squares fits to the data sets with different cooling air flow rates (5 l min− 1 dotted; 10 l min− 1 dashed). Error bars represent the standard deviation (±1 s.d.) of the averaged values ϵtot,i .
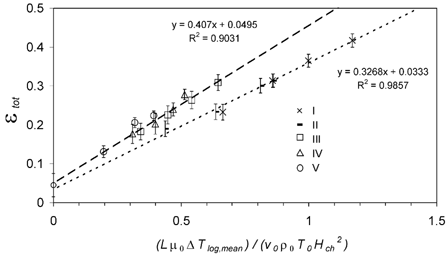
For each of the investigated cooling air flow rates (5 L min−1 and 10 L min−1), ϵtot,avg exhibits a near-linear increase with the precipitator number. The increase is steeper for the higher cooling air flow, but the linear least-squares fits to both measurement data sets intercept the y axis (Δ T = 0 K) at ϵtot≈ 4%, which is consistent with the particle deposition observed under isothermal conditions averaged over all experiments (ϵiso,avg = 4.5 ± 2.5%).
shows the average thermophoretic deposition efficiencies, ϵth,avg, plotted against the precipitator number. Again, a near-linear increase is observed for each of the cooling air flows. The linear least-squares fits intercept the y axis (Δ T = 0 K) at ϵth,avg≈ 0, as expected for isothermal conditions. The slopes of the fit lines (0.42 and 0.34, respectively) are fairly close to the value of 0.55, which can be observed in plate precipitators and equals the thermophoretic coefficient applicable for soot agglomerates in the investigated range of particle size and experimental conditions (CitationTsai and Lu 1995; CitationMesserer et al. 2003).
FIG. 9 Thermophoretic particle deposition efficiency ϵth,avg plotted against the dimensionless precipitator number calculated from average flow parameters, (Lμ0Δ T log,mean)/(v 0ρ0 T 0 H ch 2). The lines are linear least-squares fits to the data sets with different cooling air flow rates (5 l min− 1 dotted; 10 l min− 1 dashed) and the theoretical relation for a plate precipitator (solid). Error bars represent the standard deviation (±1 s.d.) of the averaged values ϵth,i .
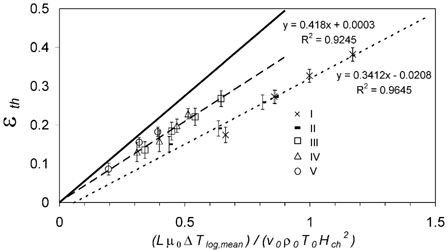
If the dimensionless precipitator numbers were calculated with characteristic distances of H ch,1* = H ch sqrt (0.55/0.32) = 0.79 mm and H ch,2* = H ch sqrt (0.55/0.42) = 0.69 mm, which are well within the range of different half-distances occurring between the outer surfaces of the cooling pipes in heat exchanger (0.26–0.94 mm), the slopes of the linear least-squares fit would be identical to K th≈ 0.55. The results confirm that plate precipitator formula can be regarded as a physically reasonable and a consistent basis for simple semiempirical parameterizations of ϵth,avg as a function of temperature and flow conditions in miniature pipebundle heat exchangers. For a given geometry and cooling gas flow the characteristic distance, H ch* can be determined from a few measurements and used to estimate deposition efficiencies for varying thermal conditions.
To investigate the influence of deposited soot on the deposition efficiency, experiment Ic was extended over a time span of 13 h. ϵtot,avg was near-constant at (37 ± 1)%. After the long-term experiment the isothermal deposition efficiencies ϵiso,i were found to be 5–10% higher than at the beginning. Apparently the deposited soot led to enhanced nonthermophoretic deposition and reduced the contribution of thermophoresis, while the overall deposition efficiency remained near-constant. Substantial blackening of the heat exchanger tubes was observed upon visual inspection after the long-term experiment. The blackening was most intense at the beginning of the heat exchanger and strongly decreased along the flow direction, indicating that the particle removal was dominated by deposition over the first few centimeters of the heat exchanger, where the highest temperature gradients and thermophoretic forces occur.
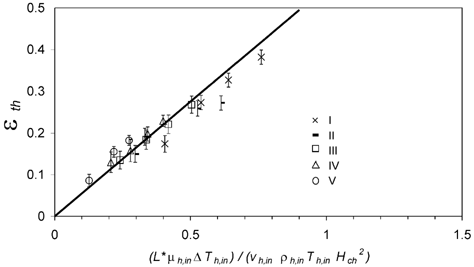
The dominant influence of the conditions at the aerosol inlet was confirmed by test calculations in which the inlet temperature and flow parameters (Δ T h,in, μ h,in, v x,h,in, T h,in) instead of the average parameters (Δ T h,0, μ h,0, v x,h,0, T h,0) and an effective deposition length L* = 0.1· L = 30 mm were inserted in EquationEquation (2). The assumption L* = 0.1· L = 30 mm is based on observed deposition patterns and is consistent with basic temperature profile calculations. With these parameters the data points plotted against the precipitator number converged towards the theoretical line for a simple plate precipitator with K th≈ 0.55 ().
FIG. 10 Thermophoretic particle deposition efficiency ϵth,i plotted against the dimensionless precipitator number calculated from effective flow parameters at the hot inlet, (L *μ h,inΔ T h,in)/(v h,inρ h,in T h,in H ch 2). The line is the theoretical relation for a plate precipitator. Error bars represent the standard deviation (±1 s.d.) of the averaged values ϵth,i .
CONCLUSIONS
The results of this study demonstrate the applicability of miniature pipe-bundle heat exchangers for efficient particle deposition under typical combustion exhaust conditions. At aerosol inlet temperatures of 390–510 K, flow velocities of 1–4 m s− 1, and cooling air inlet temperatures around 300 K, deposition efficiencies of up to 45% have been achieved for submicrometer spark discharge soot aerosol particles.
Thermophoresis was the dominating particle deposition mechanism, and its decoupling from isothermal mechanisms was consistent with the assumption of independently acting processes (CitationBrockmann 2001).
Simple parameterizations derived from plate-precipitator theory and experiments (CitationTsai and Lu 1995; CitationMesserer et al. 2003) were found to be suitable for the description of particle deposition efficiencies as a function of inlet temperatures, flow rates, and geometric parameters without solving the complex set of differential equations describing fluid flow, heat transfer, and particle motion in the pipe-bundle heat exchanger.
Overall, the results of our study confirm the high potential of miniature pipe bundle heat exchangers for combustion exhaust treatment systems combining efficient heat recovery and aerosol particle deposition.
NOMENCLATURE
| A HE | = |
Cross-sectional area of heat exchanger (m2) |
| c p | = |
Particle number concentration (cm− 3) |
| d p | = |
Particle diameter (nm) |
| D h | = |
Hydraulic diameter, 4A HE/P HE |
| fiso,th | = |
Coupling term of deposition mechanisms |
| H ch | = |
Characteristic distance (m) |
| H ch* | = |
Modified characteristic distance (m) |
| H P | = |
Plate distance (m) |
| Kn | = |
Knudsen number, 2λ/d p |
| K th | = |
Thermophoretic coefficient |
| L | = |
Deposition length (m) |
| L* | = |
Modified deposition length (m) |
| P HE | = |
Perimeter of heat exchanger (m) |
| Re | = |
Heat exchanger Reynolds number, v h,0 D h ρ g,h,0/μ g,h,0 |
| T | = |
Gas temperature (K) |
| T p | = |
Particle temperature (K) |
| v th | = |
Thermophoretic velocity (m s− 1) |
| v x | = |
Axial velocity (m s− 1) |
Greek Lettters
| ϵiso | = |
Isothermal particle deposition |
| ϵth | = |
Thermophoretic particle deposition efficiency |
| ϵtot | = |
Measured particle deposition efficiency |
| Δ Tlog,mean | = |
Mean logarithmic temperature difference (K) |
| λ | = |
Mean free path of gas molecules (m) |
| μ | = |
Dynamic viscosity of the gas (kg m− 1 s− 1) |
| ρ g | = |
Density of the gas (kg m− 3) |
| ∇ T | = |
Temperature gradient in the heat exchanger (K m− 1) |
Additional Subscripts
| i | = |
Particle size class |
| avg | = |
Weighted average over particle spectrum |
| 0 | = |
Arithmetic mean of inlet and outlet aerosol properties |
| h | = |
Hot aerosol |
| c | = |
Cooling air |
Acknowledgments
This work is part of the project “Katalytisches System zur filterlosen kontinuierlichen Ruβpartikelverminderung für Fahrzeugdieselmotoren,” supported by the Bavarian Research Foundation, Munich. Additional funding from the Max-Buchner-Forschungsstiftung and technical support by Sebastian Wiesemann are gratefully acknowledged.
REFERENCES
- Batchelor , G. K. and Shen , C. 1985 . Thermophoretic deposition of particles in gas flowing over cold surfaces . J. Colloid Interface Sci. , 107 : 21 – 37 .
- Baumbach , G. 1993 . Luftreinhaltung , Berlin : Springer Verlag .
- Berger , C. , Horvath , H. and Schindler , W. 1995 . The deposition of soot particles from hot gas streams through pipes . J. Aerosol Sci. , 26 : 211 – 217 .
- Brock , J. R. 1962 . On the theory of thermal forces acting on aerosol particles . J. Colloid Sci. , 17 : 768 – 780 .
- Brockmann , J. E. 2001 . “ Sampling and transport of aerosols ” . In Aerosol Measurement: Principles, Techniques and Applications , Edited by: Willeke , K. and Baron , P. A. 143 – 195 . New York : John Wiley & Sons .
- Byers , R. L. and Calvert , S. 1969 . Particle deposition from turbulent streams by means of thermal force . Ind. Engng Chem. Fundam. , 8 : 646 – 655 .
- Chang , Y. C. , Ranade , M. B. and Gentry , J. W. 1990 . Thermophoretic deposition of aerosol particles on transport tubes . J. Aerosol Sci. , 21 : S81 – S84 .
- Chang , Y. C. , Ranade , M. B. and Gentry , J. W. 1995 . Thermophoretic deposition in flow along an annular cross section: experiment and simulation . J. Aerosol Sci. , 26 : 407 – 428 .
- Derjaguin , B. V. , Rabinovich , Ya. I. , Storozhilova , A. I. and Scherbina , G. I. 1976 . Measurement of the coefficient of thermal slip of gases and the thermophoresis velocity of large-size aerosol particles . J. Colloid Interface Sci. , 57 : 451 – 461 .
- Evans , D. E. , Harrison , R. M. and Ayres , J. G. 2003 . The generation and characterisation of elemental carbon aerosols for human challenge studies . J. Aerosol Sci. , 34 : 1023 – 1041 .
- Friedlander , S. K. 1977 . Smoke, Dust and Haze , New York : John Wiley & Sons .
- Van Gulijk , C. , Makkee , M. and Moulijn , J. A. 2001 . Experimental techniques for the development of the turbulent precipitator as a diesel particulate filter . Topics in Catalysis , 16 : 285 – 290 .
- Hinds , W. C. 1999 . Aerosol Technology , New York : John Wiley & Sons .
- Johnson , J. E. and Kittelson , D. B. 1996 . Deposition, diffusion and adsorption in the diesel oxidation catalyst . Appl. Catalysis B: Environmental , 10 : 117 – 137 .
- Kousaka , Y. , Okuyama , K. , Nishio , S. and Yoshida , T. 1976 . Experimental study of thermophoresis of aerosol particles . J. Chem. Eng. Jpn. , 9 : 147 – 150 .
- Lin , J.-S. and Tsai , C.-J. 2003 . Thermophoretic deposition efficiency in a cylindrical tube taking into account developing flow at the entrance region . J. Aerosol Sci. , 34 : 569 – 583 .
- Messerer , A. , Niessner , R. and Pöschl , U. 2003 . Thermophoretic deposition of soot aerosol particles under experimental conditions relevant for modern diesel engine exhaust gas systems . J. Aerosol Sci. , 34 : 1009 – 1021 .
- Montassier , N. , Boulaud , D. and Renoux , A. 1991 . Experimental study of thermophoretic particle deposition in laminar tube flow . J. Aerosol Sci. , 22 : 677 – 687 .
- Neeft , J. P. A. , Makkee , M. and Moulijn , J. A. 1996 . Review article – diesel particle emission control . Fuel Proc. Techn. , 47 : 1 – 96 .
- Nishio , G. , Kitani , S. and Takahashi , K. 1974 . Thermophoretic deposition of aerosol particles in a heat-exchanger pipe . Ind. Engng Chem. Process Des. Dev. , 13 : 408 – 415 .
- Peng , X. F. , Wang , B. X. , Peterson , G. P. and Ma , H. B. 1995 . Experimental investigation of heat transfer in flat plates with rectangular microchannels . Int. J. Heat Mass Transfer , 38 : 127 – 137 .
- Romay , F. J. , Takagaki , S. S. , Pui , D. Y. H. and Liu , B. Y. H. 1998 . Thermophoretic deposition of aerosol particles in turbulent pipe flow . J. Aerosol Sci. , 29 : 943 – 959 .
- Rosner , D. E. and Khalil , Y. F. 2000 . Particle morphology– and Knudsen transition-effects on thermophoretically dominated total mass deposition rates from “coagulation-aged” aerosol population . J. Aerosol Sci. , 31 : 273 – 292 .
- Sasse , A. G. B. M. and Nazaroff , W. W. 1994 . Particle filter based on thermophoretic deposition from natural convection flow . Aerosol Sci. Technol. , 20 : 227 – 238 .
- Shi , J. P. , Harrison , R. M. and Brear , F. 1999 . Particle size distribution from a modern heavy duty diesel engine . Sci. Tot. Env. , 235 : 305 – 317 .
- Shi , J. P. and Harrison , R. M. 2001 . Study of a water-cooled fluidized bed for diesel particle agglomeration . Powder Technology , 115 : 146 – 156 .
- Stratmann , F. and Fissan , H. 1989 . Experimental and theoretical study of submicron particle transport in cooled laminar tube flow due to combined convection, diffusion and thermophoresis . J. Aerosol Sci. , 20 : 899 – 902 .
- Talbot , L. , Cheng , R. K. , Schefer , R. W. and Willis , D. R. 1980 . Thermophoresis of particles in a heated boundary layer . J. Fluid Mech. , 101 : 737 – 758 .
- Tsai , C.-J. and Lu , H.-C. 1995 . Design and evaluation of a plate-to-plate thermophoretic precipitator . Aerosol Sci. Technol. , 22 : 172 – 180 .
- Waldmann , L. Z. and Schmitt , K. H. 1966 . Aerosol Science , Edited by: Davies , C. N. London : Academic Press .
- Yehia , A. , Abdel-Salam , M. and Mizuno , A. 2000 . On assessment of ozone generation in dc coronas . J. Phys. D: Appl. Phys. , 33 : 831 – 835 .