Abstract
Aerosol absorption coefficients were obtained using two versions of the Magee Scientific Aethalometer and a Particle Soot Absorption Photometer (PSAP) in Riverside, California during July and August of 2005. These measurements were subsequently compared to each other and to hourly elemental carbon (EC) mass concentrations as determined by a Sunset Labs semi-continuous OCEC analyzer. Measurements from all four instruments were shown to be highly correlated (R 2 = 0.83 to 0.92). Differences between absorption values measured by the PSAP and the Aethalometer were found to be dominated by differences in the filter media used by the respective instruments. Comparison of optical and thermal measurements revealed that the specific attenuation cross section (σ ATN ) of light absorbing carbon (LAC) varied as a function of the time of the day, most notably during weekdays. Minimum σ ATN values were observed during morning rush hour when EC concentrations were at their greatest and maxima were seen in the late afternoon. These variations correlated with changes in the OC/EC ratio and the Angstrom exponent for absorption, which is consistent with changes in the mixing state of elemental carbon associated with secondary aerosol condensation on primary EC particles.
INTRODUCTION
The ability to determine the mass concentration of light-absorbing carbon (LAC) in ambient aerosols using filter-based optical instruments depends on two important assumptions: first, that the attenuation of light through a particle-laden filter is directly related to the mass of light absorbing material on the filter and second, that this relationship, represented by the specific attenuation cross section (σATN), remains constant over time at a given receptor site. The relationship between filter attenuation and absorption of light by particles is, unfortunately, not entirely straight forward. While the attenuation of light through a filter is a function of absorption, it is also, to some extent, a function of scattering by both particles and filter fibers (CitationHitzenberger 1993; CitationHorvath 1993; CitationPetzold et al. 1997; CitationBond et al. 1999). The scattering of light by the filter material can be particularly complex as multiple scattering by fibers creates a tortuous path for incident light along which there exists an increased probability for photons to encounter and be absorbed by particles. Attenuation due to scattering is not expected to be strongly correlated with the mass of absorbing material on the filter (CitationPetzold et al. 1997) and thus can potentially result in an overestimation of LAC as the apparent attenuation cross section fluctuates in response to scattering effects (CitationHitzenberger 1993; CitationHorvath 1993; CitationPetzold et al. 1997; CitationBond et al. 1999).
Attenuation enhancement caused by filter scattering is dependant on the type of filter used, both in terms of the amount of scattering and the extent to which particles are embedded within the filter matrix (CitationBond et al. 1999; CitationArnott et al. 2005). These differences are thought to be contributing factors in the differences between light absorption measurements reported by two of the most commonly deployed filter-based optical instruments, the Radiance Research Particle Soot Absorption Photometer (PSAP) and the Magee Scientific Aethalometer (CitationHansen et al. 1984; CitationWeingartner et al. 2003). Whether filter enhancement is the dominant factor in the differences between these two instruments is unclear due in part to uncertainties regarding how filter loading affects both absorption and scattering (CitationWeingartner et al. 2003; CitationBond and Bergstrom 2006). Numerous correction factors for both instruments have been proposed but, with the exception of those included in the PSAP algorithm, these corrections are not universally applied making it all the more difficult to compare PSAP and Aethalometer data.
In addition to LAC mass concentration, attenuation data from filter-based instruments is also utilized to determine the mass absorption efficiency or specific absorption cross section (σ) of ambient aerosols. To determine σ, attenuation is typically divided by the mass concentration of elemental carbon (EC) as determined by a thermal-optical method. Determination of σ by such methods also relies on an important assumption, namely that absorbance of light by particles collected on a filter is analogous to the absorbance of light by ambient aerosols. Given the difficulties in relating filter attenuation with absorbance outlined previously, it is difficult to rely on this assumption, and as a result, it is perhaps more appropriate to refer to the quotient of attenuation and EC as the specific attenuation cross section (σATN) of filter-bound particles. It should also be noted that the specific attenuation cross section is dependant on how EC is defined by a given thermal-optical method as the EC to OC split can vary significantly between methods utilizing different temperature profiles (CitationSchauer et al. 2003b).
As shown in , published values of σATN span a fairly wide range, which can be explained by several factors, including differences in the optical instruments and thermal methods used to measure attenuation and EC. Additionally, the absorptive properties of ambient aerosols are a function of sources, aerosol aging, and mixing state, and as a result, the attenuation cross section of LAC can vary from location to location (CitationLiousse et al. 1993; CitationPetzold and Niessner 1995). From studies at different locations, CitationLiousse et al. (1993) concluded that regional values of σATN are determined by the dominant source(s) of aerosols within that region and as such, are not expected to vary significantly. Subsequent studies, however, indicate that the absorptive properties of LAC can also exhibit seasonal variations and can undergo rapid changes when a site is impacted by sulfate haze events and bio-mass burning (CitationSharma et al. 2002; CitationJeong et al. 2004). This suggests that the ability to predict changes in σATN is dependant on an understanding of the factors that influence the sources and mixing state of LAC.
TABLE 1 Published values for the specific attenuation cross-section of ambient aerosols
The motivation behind the present study is to provide a framework for the inter-comparison of ambient measurements of LAC by filter-based light absorption methods and the inter-comparison of LAC measurements with EC mass concentrations reported by a common thermal-optical method. Filter based light absorption instruments, in particular the PSAP and Aethalometer, provide investigators with a method for measuring LAC that is relatively inexpensive, robust, and simple to operate when compared to thermal methods. These factors have combined to make such instruments extremely popular and ideal for a variety of uses by a variety of users. At last count, there were more than one thousand Aethalometers in use across the globe (Hansen, personal communication, 2006) making it imperative to have a firm understanding of how measurements reported by this instrument compare to the PSAP and to commonly used thermal methods.
In order to accomplish this objective, this study uses atmospheric data to compare attenuation values generated by a PSAP and two versions of the Aethalometer in order to determine the level of reproducibility in such measurements and to ascertain what factors dominate the differences in attenuation values reported by the PSAP and Aethalometer. Additionally, hourly attenuation, elemental carbon, and organic carbon (OC) measurements are utilized to demonstrate the range of the specific attenuation cross section of LAC in the urban environment and to suggest some of the factors influencing this range.
EXPERIMENTAL SECTION
Aerosol Measurements
Aerosol measurements were obtained at the Air Pollution Research Center on the campus of the University of California—Riverside during July and August of 2005. The sampling site was located approximately 5.0 km from downtown Riverside and 1.0 km from a major highway (US 215) in an area where EC concentrations have historically been dominated by mobile sources (CitationSchauer et al. 1996; CitationGray and Cass 1998).
Aerosol absorption data were obtained from two single wavelength PSAPs (Radiance Research, Seattle, WA), operated in succession during the campaign, and two 7-wavelength model AE-31 Aethalometers (Magee Scientific, Berkeley, CA) operated concurrently. Aethalometer #1 was fitted with a standard “high sensitivity” sampling head featuring a 0.5 cm2 circular collection spot and operated at a flow rate of 5.9 L min− 1 without benefit of a size-selective inlet. Aethalometer #2 was fitted with the optional “extended range” sampling head, which contains a 1.67 cm2 oval shaped collection spot, and operated a flow rate of 5.0 L min− 1 from an inlet which included a PM2.5 sharp-cut cyclone (BGI, Waltham, MA). Both Aethalometers were programmed to provide data over a five minute averaging period.
PSAP #1 was operated throughout the majority of the campaign and was replaced by PSAP #2 during the last two days of sampling. PSAP #1 was operated at a flow rate of 1.0 L min− 1 initially, but in order to facilitate less frequent filter changes, the flow rate was changed to 0.5 L min− 1 during the first week of the campaign. Sampling was accomplished through the same inlet used by Aethalometer #1, which did not include a cyclone. The averaging period for PSAP data throughout the campaign was one minute.
Thermal measurements of elemental carbon and organic carbon were obtained by two methods. Hourly EC and OC concentrations were measured using a Sunset Labs semi-continuous OCEC analyzer (Sunset Labs, Tigard, OR) programmed to collect aerosol for 47 minutes beginning at the top of each hour with the analysis cycle executed during the remainder of the hour. The analysis of carbonaceous aerosols by this instrument is based on the NIOSH 5040 method and a description of its operation and validation can be found in CitationBae et al. (2004). Sample collection was accomplished at flow rate of 24.0 L min− 1 through an inlet equipped with a sharp-cut PM2.5 cyclone and a carbon impregnated parallel plate organics denuder (Sunset Labs, Tigard, OR) designed to remove gas-phase organic compounds upstream of the collection filter. Calibration of the Sunset Labs field analyzer was accomplished by an internal calibration using a 5% methane in helium mixture in a fixed volume loop automatically repeated at the conclusion of each analysis cycle, and an external calibration using sucrose spikes on clean, pre-baked filters.
As a part of the quality assurance procedure for the semi-continuous analyzer, aerosol samples were also collected on pre-baked 90 mm quartz-fiber filters (Pall Gellman, Ann Arbor, MI) by four URG-3000B (URG, Chapel Hill, NC) particulate samplers. Filters were stored in sealed Petri dishes lined with baked aluminum foil and kept in a freezer at or below 20°F before and after sampling. The URG samplers were operated at 92 L min− 1 and were each fitted with a PM2.5 cyclone. Three five hour samples and one nine hour sample were collected consecutively each day, along with 20% field blanks, and samples were subsequently analyzed for OC and EC content using the ACE-Asia method. (CitationSchauer et al. 2003a).
Filter Comparison Experiment
Two PSAPs were operated concurrently at the Midwest Supersite in East St. Louis during January of 2006, and hourly absorption coefficients were obtained from each instrument over 48 hours in two phases of 24 hours each. In the initial phase, both instruments collected aerosol on the tissue-glass filters used by both PSAPs in Riverside (Pallflex E70-2075W). In the second phase, one of the tissue-glass filters was replaced by a length of the filter tape used by the Aethalometer (Pallflex quartz 2500 Q205). The sampling regime, including flow rate and inlet construction, used in this comparison was identical to that used in Riverside.
Data Treatment
The PSAP provides a measurement of the absorption coefficient (bap) of LAC by dividing the change in light attenuation, Δ ATN (λ, t), by the optical pathlength of the sample, V/A (sample air volume divided by the collection area of the filter), such that bap is defined as the attenuation of light by the sample in the air per unit pathlength (Equation [Equation1]). As the Aethalometer provides a direct reading of LAC mass concentration, average hourly bap values were calculated for each Aethalometer from attenuation data wherever possible using Equation (Equation1) in order to provide consistency between the treatment of PSAP and Aethalometer data. During hours when the filter tape advanced, causing an interruption in attenuation readings, direct concentration readings taken from the Aethalometer were utilized instead (Equation [Equation2]). A comparison of the two calculation methods revealed that there are no significant differences between them.
Attenuation as determined by the Aethalometer is defined in Equation (Equation3) with the factor of 100 added by the manufacturer for numerical convenience. This factor was removed when calculating bap values. In Equation (Equation2), σ (1/λ), which has units of m2 g− 1, is the instrumental specific attenuation cross section of LAC provided by the manufacturer. This constant is wavelength dependant and is used to provide a measurement of LAC mass concentration by relating light attenuation through the filter to the mass of light absorbing material on the filter via Equation (Equation4).
During the treatment of the Aethalometer data, no correction factors were utilized with the exception of correcting for differences in reported versus actual flow rate and a correction for the extended range sampling head that was applied when utilizing Equation (Equation1). The second correction was necessary because, according to the manufacturer, for instruments which use the larger spot size, sample deposition is not uniform across the entire collection spot, and as a result, concentrations may be over-reported as mass tends to accumulate preferentially in the center of the spot directly above the photo-diode detector (Hansen, personal communication, 2005). This has prompted Magee Scientific to include what it calls a “mean correction” factor to the algorithm which calculates LAC concentration.
PSAP data was treated in much the same fashion as Aethalometer data in order to determine absorption coefficients. Although, as stated previously, the PSAP does provide a direct reading of bap, it also applies what the manufacturer calls a “transfer function” to this data in order to account for the effect of increasing particle load on the filter. As the Aethalometer does not incorporate any such correction and since the focus of this study is to compare attenuation reported by both instruments, the transfer function was not utilized in determining bap from the PSAP. Instead the attenuation was calculated using the signals from the reference and signal beams using Equation (Equation5), which is similar to the algorithm used by the Aethalometer. As with the Aethalometer, the only corrections made were for collection spot size and the sample flow rate. PSAP attenuation values were then plugged into Equation (Equation1) in order to generate bap values.
In Equation (Equation5), sb and sb0 refer to the signals of the sensing beam at the beginning and the end of the averaging period respectively, and similarly, rb and rb0 refer to the reference beam signals at the beginning and the end of the averaging period.
Slopes, intercepts, r-squared values, and uncertainties for all regression analyses were calculated using SPSS for Windows v.13.0.
RESULTS AND DISCUSSION
Semi-Continuous EC vs. Integrated Filter EC
As previously outlined, filter samples were collected and analyzed for OC and EC concentrations as a part of the QA/QC procedure for the Sunset Labs semi-continuous field analyzer (CitationBae et al. 2004). Additionally, this was done to provide us with a framework with which to compare our results with previous work, including that of CitationLiousse et al. (1993) and CitationSharma et al. (2002), in which thermal EC was determined by integrated filter sampling and analysis. shows the results of the comparison of semi-continuous EC as determined by the Sunset Labs field instrument and EC determined by analysis of the filter samples. The result of the two methods were well correlated (R2 = 0.90), although the slope of 1.11 ± 0.05 deviated significantly from unity. A small zero off-set was observed (+0.17 ± 0.04); however, given that the two methods varied on average by less than 15%, they appear to be quite comparable.
FIG. 1 Comparisons of semi-continuous thermal EC (Sunset Labs instrument) with integrated filter measurements of EC () and with absorption coefficients (bap) as determined by two co-located PSAPs ( and ). PSAP data is segregated by transmittance values and by instrument in and , respectively. The resulting slope of these plots represents the specific attenuation cross-section (σATN). Two PSAPs were used sequentially during the study. Regression statistics for each subset are available in in the supplemental materials accompanying this article.
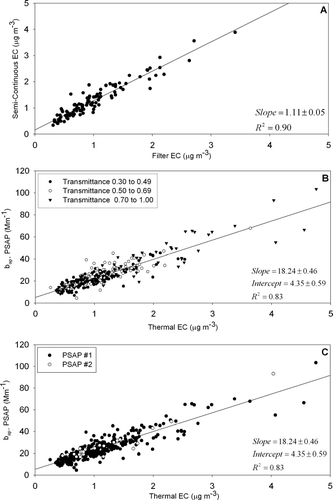
PSAP vs. Semi-Continuous EC
Good agreement was noted between the absorption coefficients (bap) determined by the PSAP and semi-continuous EC (R2 = 0.83 and σATN (slope) = 18.24 ± 0.59) as shown in and . In order to evaluate the significance of filter loading, bap values were separated into three bins determined by filter transmittance. The upper bin included all data points generated when the filter transmittance reported by the instrument equaled or exceeded 70%. The significance of this value lies in the submission of CitationBond et al. (1999) that the instrument's filter loading correction is not recommended when transmittance falls below 70%. The remaining bins are from 50 to 70% transmittance and from 30 to 50% transmittance. Examination of bap values determined when transmittance fell below 30% revealed that the correlation between the PSAP and the Sunset Labs analyzer declined drastically, and consequently, these values were not included.
As shown , there appears to be no significant difference in the correlation between absorption coefficients reported by the PSAP and EC at transmittance values above 30%. It is important to keep in mind that the bap values in and were calculated from the detector signals and not taken directly from the instrument, which reports bap corrected for filter loading based on the transmittance value measured during the data averaging period. Although there is some scattering in the data, it seems clear that the filter loading artifact described by CitationBond et al. (1999) and corrected for by the transfer function incorporated within the PSAP algorithm does not represent a significant concern under urban conditions. In addition, the data suggests that the 50% transmittance cutoff recommended by the manufacturer appears to be conservative as bap values reported by the PSAP (without the transfer function) retain a strong correlation with EC mass concentrations to as low as 30% transmittance. demonstrates that data from PSAP #2, which was operated on the last day of sampling, also consistently reports a strong correlation with semi-continuous EC.
Aethalometer vs. Aethalometer
The comparison between Aethalometer #1 and Aethalometer #2 shown in demonstrates that despite the use of the correction factor for the extended range spot size, absorption coefficients from both instruments are highly correlated across all wavelengths (R2 = 0.84 to 0.92 and slope = 0.99 ± 0.01 to 1.04 ± 0.02). The differences in the sample flow between the two instruments (5.9 vs. 5.0 L min−1) appeared to have had no significant impact despite the fact that the instrument with the higher flow (Aethalometer #1) performed automated filter changes with a greater frequency. This suggests that, like those reported for the PSAP by CitationBond et al. (1999), the filter loading artifacts reported by CitationArnott et al. (2005) appear to be relatively minor under ambient conditions in the urban environment.
FIG. 2 Comparison of absorption coefficients (bap) determined by two co-located Aethalometers. Aethalometer #1 utilized the standard “high-sensitivity” collection spot while Aethalometer #2 was fitted with the optional “extended-range” collection head. Six of the seven available wavelengths are shown. All values are in Mm−1.
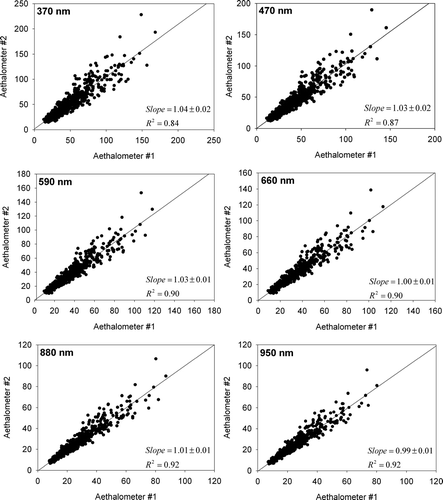
With regards to the “mean correction” factor applied to the extended range sampling head used by Aethalometer #2, the best fit between the two instruments was found when using 0.82 rather than the 0.85 suggested by the manufacturer. This suggests that further work is warranted in order to better understand and quantify this effect and its associated uncertainty and to characterize instrument to instrument variability among Aethalometers.
Aethalometer vs. PSAP
Although both the PSAP and the Aethalometer operate on the same basic principles, two significant differences exist. First, despite the fact that they are manufactured from similar materials, some physical differences exist between the filters used in the two instruments. The Pallflex 250F (Pallflex, Putnam, CN) quartz filter tape used by the Aethalometer is significantly thicker than the Pallflex E70-2075W (Pallflex, Putnam, CN) tissue glass filters, which can allow particles to become more deeply embedded in the filter matrix. In addition to the filter media, the method used to change out filters is a second difference between the PSAP and the Aethalometer. The Aethalometer automatically advances a roll of filter tape when the attenuation value recorded by the instrument reaches a pre-set value, while the PSAP requires that the operator manually change the filter when the transmittance falls below an established value (the manufacturer recommends that it be changed “… before it falls too far below 0.50.”).
The automated filter change enables unattended operation of the Aethalometer, but we found that it further complicates inter-comparison of Aethalometer and PSAP data. Amongst the difficulties encountered was the significant number of times the PSAP filter had to be changed on any given day, even when the flow rate was set to 0.5 L min− 1. As previously noted, data collected when the transmittance was below 0.30 was not considered in this analysis. The practical consequences of this was that, quite often, significant portions of early morning data had to be discarded as the transmittance typically fell well below the established threshold prior to the operator arriving at the site each day.
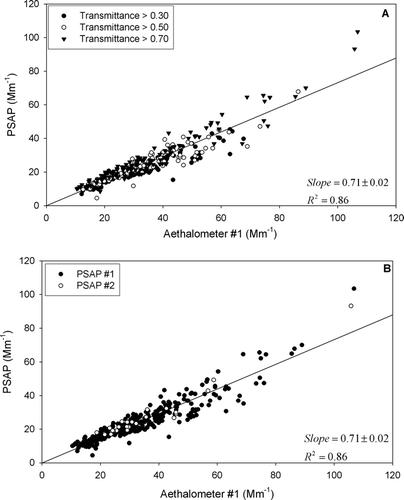
Despite these factors, and demonstrate that bap values tabulated from Aethalometer #1 (590 nm channel) and the PSAP (565 nm) were strongly correlated throughout the study (R2 = 0.86). However, the slope was significantly different than unity (slope = 0.71), indicating that an appreciable bias beyond the differences in wavelengths exists within one of the data sets. Nevertheless, it should be noted that like the PSAP/EC comparison no significant differences in the relationship between bap values derived from the Aethalometer and those of the PSAP exists for transmittances above 30% () or between the two PSAPs (). Data from Aethalometer #1 was used in this and all subsequent comparisons in order to eliminate any uncertainty due to uneven deposition on the extended range spot size used by Aethalometer #2.
FIG. 3 Comparison of absorption coefficients determined by PSAP and Aethalometer. PSAP data is segregated by transmittance in and by instrument in . Note that while the correlation between the two instruments is strong, the slope demonstrates a significant deviation from a 1:1 relationship. Regression statistics for each subset are available in in the supplemental materials accompanying this article.
Aethalometer vs. Semi-Continuous EC
As one might expect from the comparison of the Aethalometer and the PSAP, shows that the correlation between bap values from Aethalometer #1 and EC from the semi-continuous instrument is strong for all seven wavelengths (R2 = 0.83 to 0.88 and σATN (slope) = 34.50 ± 0.61 to 17.04 ± 0.26). However, like the PSAP/EC comparison, significant zero offsets were also observed ( and ). A plot of the wavelength dependence () of both σATN and the intercepts shown in demonstrates that both have similar wavelength dependence. The cause of these intercepts is related to diurnal changes in σATN, a matter which is discussed later in this paper. A further discussion of these intercepts, along with a graphical representation, can be found in the supporting materials accompanying this article. In brief, two distinct populations of particles were observed in Riverside each having significantly different specific attenuation cross sections. When absorption coefficients for both sets of particles are plotted vs. EC mass concentrations, as they are in , the slope of the regression line represents an average σATN value. However, hours during which bap values were at their highest coincide with the lowest absorption cross sections. This results in the regression line being pulled away from the origin giving a significant zero offset.
FIG. 4 Comparison of hourly thermal EC (Sunset Labs RT instrument) and absorption coefficients as determined by Aethalometer #1. Although significant zero-offsets are observed, a strong correlation between attenuation and thermal EC across a wide range of wavelengths is demonstrated by these plots. As in and , the slopes represent the specific attenuation cross section (σATN). Six of the seven available wavelengths are shown.
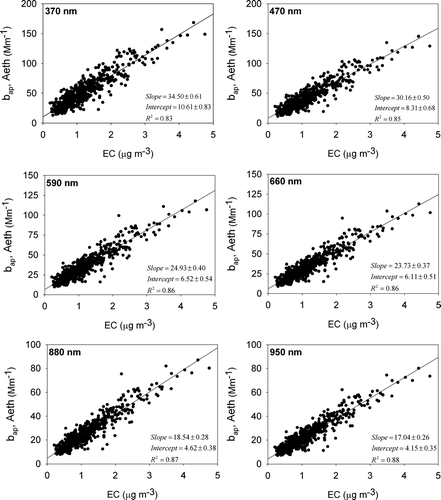
FIG. 5 The wavelength dependence of the slopes (σ ATN) and intercepts shown in .
Comparison of PSAP and Aethalometer Filters
Few published studies are available in which ambient data from the PSAP and the Aethalometer are compared. Work by Sharma et al. (2003) found that reasonable agreement between the two instruments was observed at some sampling sites but found significant disagreement at others. It is likely that some of these disagreements may be due to the application of filter loading and/or scattering corrections to absorption coefficients generated by the PSAP without the application of similar corrections to Aethalometer data. However, extensive work by CitationArnott et al. (2005) using well-characterized laboratory aerosols, clearly demonstrates that significant differences exist between the filters used by the two instruments and that these differences may lead to a greater enhancement of attenuation due to multiple scattering by the Aethalometer filter.
Ambient data shown in demonstrates that the Aethalometer consistently over-reports bap values when compared to the PSAP. Since these data are reported without benefit of any correction factors, and since the frequency and number of filter changes/advances performed by the Aethalometer does not appear to greatly affect the reproducibility of ambient data, the most significant difference between the two instruments appears to be the filter media.
illustrates the result of the filter comparison experiment conducted in East St. Louis in which two PSAPs were operated side-by-side first with identical filters of the type typically used by the PSAP ( and ) and then operated with two different filters ( and ). and demonstrate that, using identical filters, the two PSAPs are nearly perfect in their agreement both in terms of the absorption coefficients reported () and in terms of the decrease in light transmittance as filter loading increases (). In sharp contrast, shows a consistent over-reporting of bap by the PSAP when it is fitted with an Aethalometer filter when compared with an instrument fitted with a PSAP filter. Interestingly, this enhancement, given by the slope of the regression line, is identical to the value of 0.71 seen in the PSAP/Aethalometer comparison from Riverside (). It should be noted that both the sample and reference values for the PSAP are derived from different portions of the same filter, so fitting a PSAP with a section of Aethalometer filter tape, in effect, replaces both the reference and sample filters.
FIG. 6 Comparison of the performance of PSAP and Aethalometer filters. and show a side-by-side comparison of absorption coefficients and transmittance values, respectively, from two co-located PSAPs both using the tissue-glass filters. and show side-by-side comparisons of bap values and transmittance values from the same two instruments when one of the tissue-glass filters is replace with the tissue-quartz filter used in the Aethalometer (in effect, changing both reference and sample filters). Dashed lines in the transmittance plots represent the 1:1 line.
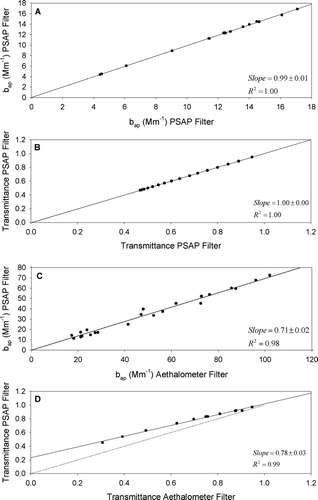
In addition, illustrates significant differences in transmittance values occur as the two filters are loaded with aerosol. The regression slope is similar to that seen in supporting the conclusion that while a filter loading artifact may be present in Aethalometer data, attenuation by the filter dominates differences between PSAP and Aethalometer data.
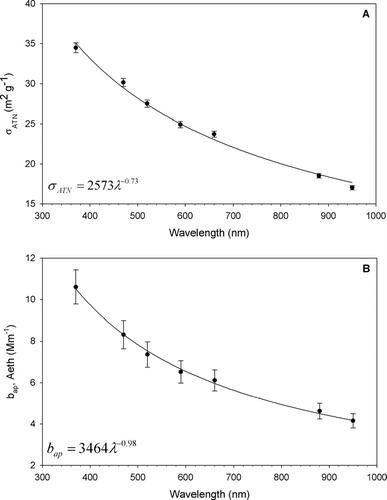
summarizes the relationship between attenuation and EC mass concentration for the PSAP and for all seven wavelengths of the Aethalometer. As shown, the Aethalometer appears to overestimate the value of σ ATN when compared with the PSAP. However, when Aethalometer and PSAP data are adjusted to 550 nm using the power law wavelength dependence derived in and the Aethalometer data is multiplied by the slope of the PSAP/Aethalometer relationship () the subsequently derived specific attenuation cross section, as well as the zero-offset, for the Aethalometer is comparable to that reported by the PSAP. This suggests that filter enhancement of attenuation is by far the most significant difference between these two instruments.
TABLE 2 Specific attenuation cross-section (σATN) measured in this study
Comparison of Hourly Aerosol Optical Properties and Bulk Chemical Composition
The relationship between attenuation and EC mass concentration shown in and have been seen in numerous studies and support one of the assumptions outlined in the introduction, namely that a strong relationship between attenuation and the mass of absorbing material collected on a filter exists. In order to determine whether this relationship is relatively constant or whether there is significant daily variability in the specific attenuation cross section, σATN was determined for each hourly period during the study (n = 504 hours) by plotting hourly bap values with hourly thermal EC concentrations and then grouped by weekday and weekend. The results indicated that, while weekend values of σATN demonstrate some variability with no discernable pattern, weekday values, shown in , demonstrate a clear pattern in which the absorption cross section declines during the morning hours and shows a marked increase in the afternoon. Minimum σATN values appear during morning peaks in EC mass concentration () attributable to morning rush-hour traffic. Additionally, the daily trend in the attenuation cross section seems consistent with daily changes in the OC/EC ratio shown in ; however, the trend in σATN appears to be unrelated to changes in OC ().
FIG. 7 Diurnal variations in the light absorbing properties of ambient aerosols during SOAR along with selected bulk chemical measurements. Similar patterns in weekday σ ATN are observed in data from the Aethalometer and PSAP (). These patterns appear related to the OC/EC ratio () and changes in Åap () but unrelated to average OC () and EC () concentrations. Error bars shown represent standard error. n = 504 hours.
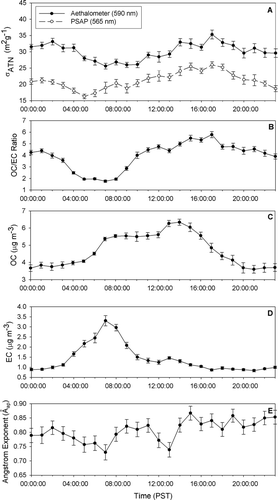
The lack of a clear pattern during the weekend may be explained by the absence of rush hour traffic periods which result in increased concentrations of fresh, externally mixed LAC over relatively short periods of time. It is worth noting, however, that weekend attenuation cross sections were on average, higher than those observed during weekdays, which may be indicative of the dominance of internally mixed LAC during weekends.
The wavelength dependence of absorbing aerosols across the entire wavelength range used by the Aethalometer was also determined as a function of the time-of-the-day for weekdays. Although this dependence, shown in , is quite variable, in general, the wavelength dependence increases from morning to afternoon signaling more preferential absorption in the UV range in the afternoon hours. This is consistent with changes in the wavelength dependence of LAC as it becomes coated with secondary organics (CitationSchnaiter et al. 2005). This coating, which has been shown to increase the absorption cross section of LAC by 35% or greater (CitationSchnaiter et al. 2003; CitationSchnaiter et al. 2005), may explain the diurnal pattern of σATN observed in Riverside.
CONCLUSIONS
Accurate measurement of LAC by filter-based optical instruments requires a thorough understanding of the relationship between the attenuation of light through a particle-laden filter and the absorbance of light by ambient aerosols. Toward this objective, we offer the following conclusions. First, we find that the ratio of attenuation to EC mass concentration was not constant during this study but instead varied in a fairly consistent pattern during the weekdays. Secondly, variation in the specific attenuation cross-section, which ranges from 25.58 to 35.31 m2 g− 1 for the Aethalometer and from 16.29 to 25.99 m2 g− 1 for the PSAP, appears to be related to changes in the wavelength dependence of light attenuation and to changes in the bulk composition of carbonaceous aerosols. Lastly, these relationships suggest that, in urban environments, changes in the mixing state of LAC can occur quite rapidly due to the condensation of semi-volatile organic compounds on primary EC particles. Such changes need to be taken into account when using filter-based light absorption instruments such as the PSAP and the Aethalometer to measure LAC in the urban environment.
With regards to comparisons between filter-based optical instruments, we find that the largest single factor which accounts for differences in attenuation reported by such instruments is the type of filter used. Although there is evidence to suggest that there may be some enhancement of attenuation due to filter loading and light scattering by filter-bound particles, such artifacts appear relatively minor when compared to the effects of filter enhancement. On the whole, we find that attenuation reported by the PSAP and the Aethalometer, regardless of the sampling head, are highly reproducible.
Further study is clearly needed to investigate how changes in σATN are affected by seasonal conditions and by different environments and how these may affect the inter-comparison of light-absorption instruments. It should be noted, however, that the accurate measurement of LAC concentrations and a complete understanding of its optical properties is dependant on the development of a standardized method for the measurement of EC, as this is the primary method for calibrating light-absorption instruments. Clearly, until such a method is made available, an accurate comparison of LAC measurements made in different environments or during different seasons cannot be accomplished.
FIG. S1 Specific attenuation cross section (σATN) values for Fridays demonstrate two distinct populations. The morning values (open circles) demonstrate a low attenuation cross section, presumably due to an infusion of fresh, externally mixed LAC from morning rush-hour traffic. During the afternoon and evening (closed circles), σATN is distinctly lower, representing the dominance of externally mixed LAC. The result of these distinct populations of σATN is a significant intercept in the linear relationship between ATN and EC mass concentration. The slope of the bap/EC line during the morning (dashed line) is significantly lower than that of the afternoon/evening line (upper line). The best fit line though all points results in an intercept due to the influence of morning data and this may be a primary cause of the intercepts seen in the relationship between ATN reported by both the PSAP and the Aethalometer and EC mass concentration.
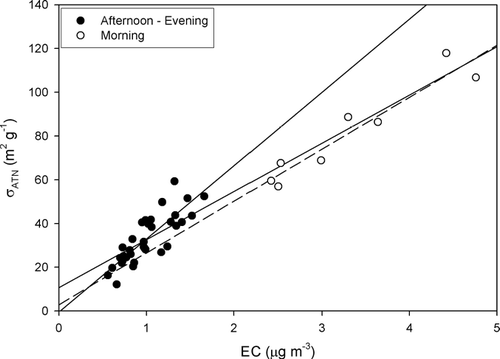
TABLE S1 Regression statistics for subsets of data shown in and . All statistics were calculated using SPSS for Windows v.13.0
Acknowledgments
Funding for this work was provided by the US Environmental Protection Agency STAR grants # R831080 and RD832161010 and a grant from the National Science Foundation (NSF grant ATM-0449815). We gratefully acknowledge the assistance of Jose Jimenez and Ken Docherty from Colorado University—Boulder and Paul Ziemann from the University of California—Riverside for assistance with site preparation and support. We would also like to thank the Prather Group from the University of California—San Diego for supplying Aethalometer data. Finally, many thanks to Brian Majestic for his assistance with the filter comparison work at the Midwest Supersite.
Notes
a Wavelength adjusted from 565 nm assuming inverse wavelength dependence.
a Adjusted to 550 nm from 565 nm (PSAP) and 590 nm (Aethalometer).
c Corrected for filter enhancement.
*Value not statistically different than zero.
Related Research Data
REFERENCES
- Arnott , W. , Hamasha , K. , Moosmuller , H. , Sheridan , P. and Ogren , J. 2005 . Towards Aerosol Light-Absorption Measurements with a 7-Wavelength Aethalometer: Evaluation with a Photoacoustic Instrument and 3-Wavelength Nephelometer . Aerosol Sci. Technol. , 39 : 17 – 29 .
- Bae , M. , Schauer , J. , DeMinter , J. , Turner , J. , Smith , D. and Cary , R. 2004 . Validation of a Semi-Continuous Instrument for Elemental Carbon and Organic Carbon Using a Thermal-Optical Method . Atmos. Environ. , 38 : 2885 – 2893 .
- Bond , T. , Anderson , T. and Campbell , D. 1999 . Calibration and Intercomparison of Filter-Based Measurements of Visible Light Absorption by Aerosols . Aerosol Sci. Technol. , 30 : 582 – 600 .
- Bond , T. and Bergstrom , R. 2006 . Light Absorption by Carbonaceous Particles: An Investigative Review . Aerosol Sci. Technol. , 40 : 1 – 41 .
- Gray , H. and Cass , G. 1998 . Source Contributions to Atmospheric Fine Carbon Particle Concentrations . Atmos. Environ. , 32 : 3805 – 3825 .
- Hansen , A. , Rosen , H. and Novakov , T. 1984 . The Aethalometer—An Instrument for the Real-Time Measurement of Optical Absorption by Aerosol Particles . Sci. Total Environ. , 36 : 191 – 196 .
- Hitzenberger , R. 1993 . Absorption-Measurements with an Integrating Plate Photometer Calibration and Error Analysis . Aerosol Sci. Technol. , 18 : 70 – 84 .
- Horvath , H. 1993 . Comparison of Measurements of Aerosol Optical-Absorption by Filter Collection and a Transmissometric Method . Atmos. Environ. , 27 : 319 – 325 .
- Huebert , B. , Bates , T. , Russell , P. , Shi , G. , Kim , Y. , Kawamura , K. , Carmichael , G. and Nakajima , T. 2003 . An Overview of ACE-Asia: Strategies for Quantifying the Relationships Between Asian Aerosols and their Climatic Impacts . J. Geophys. Res-Atmos. , 108 ( D23 ) : 8633 doi: 10.1029/2003JD003550
- Jeong , C. , Hopke , P. , Kim , E. and Lee , D. 2004 . The Comparison Between Thermal-Optical Transmittance Elemental Carbon and Aethalometer Black Carbon Measured at Multiple Monitoring Sites . Atmos. Environ. , 38 : 5193 – 5204 .
- Kuhlbusch , T. 1995 . Method for Determining Black Carbon in Residues of Vegetation Fires . Environ. Sci. Technol. , 29 : 2695 – 2702 .
- Lavanchy , V. , Gaggeler , H. , Nyeki , S. and Baltensperger , U. 1999 . Elemental Carbon (EC) and Black Carbon (BC) Measurements with a Thermal Method and an Aethalometer at the High-Alpine Research Station Jungfraujoch . Atmos. Environ. , 33 : 2759 – 2769 .
- Liousse , C. , Cachier , H. and Jennings , S. 1993 . Optical and Thermal Measurements of Black Carbon Aerosol Content in Different Environments—Variation of the Specific Attenuation Cross-Section, Sigma (σ) . Atmos. Environ. , 27 : 1203 – 1211 .
- Mayol-Bracero , O. , Gabriel , R. , Andreae , M. , Kirchstetter , T. , Novakov , T. , Ogren , J. , Sheridan , P. and Streets , D. 2002 . Carbonaceous Aerosols Over the Indian Ocean During the Indian Ocean Experiment (INDOEX): Chemical Characterization, Optical Properties, and Probable Sources . J. Geophys. Res-Atmos. , 107 ( D19 ) : 8030
- Petzold , A. , Kopp , C. and Niessner , R. 1997 . The Dependence of the Specific Attenuation Cross-Section on Black Carbon Mass Fraction and Particle Size . Atmos. Environ. , 31 : 661 – 672 .
- Petzold , A. and Niessner , R. 1995 . Method Comparison Study on Soot-Selective Techniques . Mikrochimica Acta , 117 : 215 – 237 .
- Quinn , P. , Coffman , D. , Bates , T. , Welton , E. , Covert , D. , Miller , T. , Johnson , J. , Maria , S. , Russell , L. , Arimoto , R. , Carrico , C. , Rood , M. and Anderson , J. 2004 . Aerosol Optical Properties Measured on Board the Ronald H. Brown During ACE-Asia as a Function of Aerosol Chemical Composition and Source Region . J. Geophys. Res-Atmos. , 109 : D19501 doi: 10.1029/2003JD004010
- Schauer , J. , Mader , B. , Deminter , J. , Heidemann , G. , Bae , M. , Seinfeld , J. , Flagan , R. , Cary , R. , Smith , D. , Huebert , B. , Bertram , T. , Howell , S. , Kline , J. , Quinn , P. , Bates , T. , Turpin , B. , Lim , H. , Yu , J. , Yang , H. and Keywood , M. 2003a . ACE-Asia Intercomparison of a Thermal-Optical Method for the Determination of Particle-Phase Organic and Elemental Carbon . Environ. Sci. Technol. , 37 : 993 – 1001 .
- Schauer , J. , Rogge , W. , Hildemann , L. , Mazurek , M. and Cass , G. 1996 . Source Apportionment of Airborne Particulate Matter Using Organic Compounds as Tracers . Atmos. Environ. , 30 : 3837 – 3855 .
- Schauer , J. J. , Mader , B. T. , Deminter , J. T. , Heidemann , G. , Bae , M. S. , Seinfeld , J. H. , Flagan , R. C. , Cary , R. A. , Smith , D. , Huebert , B. J. , Bertram , T. , Howell , S. , Kline , J. T. , Quinn , P. , Bates , T. , Turpin , B. , Lim , H. J. , Yu , J. Z. , Yang , H. and Keywood , M. D. 2003b . ACE-Asia Intercomparison of a Thermal-Optical Method for the Determination of Particle-Phase Organic and Elemental Carbon . Environ. Sci. Technol. , 37 : 993 – 1001 .
- Schnaiter , M. , Horvath , H. , Mohler , O. , Naumann , K. , Saathoff , H. and Schock , O. 2003 . UV-VIS-NIR Spectral Optical Properties of Soot and Soot-Containing Aerosols . J. Aerosol Sci. , 34 : 1421 – 1444 .
- Schnaiter , M. , Linke , C. , Mohler , O. , Naumann , K. , Saathoff , H. , Wagner , R. , Schurath , U. and Wehner , B. 2005 . Absorption Amplification of Black Carbon Internally Mixed with Secondary Organic Aerosol . J. Geophys. Res-Atmos. , 110 : D19204 doi: 1029/2005JD006046
- Sharma , S. , Brook , J. , Cachier , H. , Chow , J. , Gaudenzi , A. and Lu , G. 2002 . Light Absorption and Thermal Measurements of Black Carbon in Different Regions of Canada . J. Geophys. Res-Atmos. , 107 ( D24 ) doi:10.1029/2002JD002496
- Weingartner , E. , Saathoff , H. , Schnaiter , M. , Streit , N. , Bitnar , B. and Baltensperger , U. 2003 . Absorption of Light by Soot Particles: Determination of the Absorption Coefficient by Means of Aethalometers . J. Aerosol Sci. , 34 : 1445 – 1463 .