Multiangle light scattering (MLS) measurements of monodisperse atmospheric particles ranging in diameter from 0.2 to 0.8 μm were made with the DAWN-A optical detector during the Southeastern Aerosol and Visibility Study (SEAVS). The study was conducted on the southwestern edge of the Great Smoky Mountains National Park from July 15 to August 25, 1995. Individual particles were separated into spherical and nonspherical classes on the basis of the variability in elastic light scattering measured at eight azimuthal angles. Values of the real part of the refractive index, n, were then inferred for spherical particles by comparing Lorenz-Mie theory calculations to calibrated light scattering responses from narrow-aperture detectors positioned at seven polar angles ranging from 40–140 degrees. The instrument was calibrated with submicron laboratory particles with n ranging from 1.38 to 1.61 for an illumination wavelength of 488 nm. The overall uncertainty in measured n was estimated to be ±0.02. For hygroscopic particles, refractive index was found to decrease as relative humidities increased due to the addition of water; the study-average value at low humidities (dry particles) was 1.49, while the average value at high humidities (wet particles) was 1.42. The lowest and highest values measured during the study were 1.34 and 1.54. Daily size- and RH-dependent measurements are compared to indices modeled for mixtures of ammoniated sulfate, organic carbon (OC), elemental carbon (EC), and water. Size-dependent mass concentrations of these species, with the exception of water, were measured with MOUDI cascade impactors.
INTRODUCTION
One of the primary goals in atmospheric visibility research is to accurately apportion the total scattering and absorption of light by atmospheric aerosol particles among their individual chemical constituents. A true portrayal of atmospheric aerosol optical effects requires detailed reconstruction of the aerosol and its optical properties; the chemical and physical complexity of these aerosols precludes simple analysis of the relationship between optical coefficients and species concentrations (CitationWhite 1986; CitationMcMurry et al. 1996). Such reconstruction consists of forming an aerosol model based on measured size-dependent properties, from which integral optical quantities may be calculated using suitable light scattering theory. Unknown model parameters often include particle density, particle refractive index, soil dust content, RH-dependent water content and properties of organic species, and no single instrument is currently available that can provide all of this information.
Light scattering instruments are indispensable tools in atmospheric visibility research. Integrating nephelometers (e.g., CitationCharlson 1972; CitationAnderson et al. 1996) provide integral scattering measurements that are the basis for closure in visibility reconstruction (e.g., CitationSloane and Wolff 1985; CitationZhang et al. 1994). Optical particle counters (OPCs) measure number size distributions from which volume size distributions may be calculated (CitationKreisberg et al. 2001; CitationHand et al. 2002a). These are important measurements because total light scattering in the visible depends strongly on aerosol volume. When installed downstream of a differential mobility analyzer (DMA), an OPC can also yield measurement of particle refractive index (CitationKreisberg et al. 2001; CitationHand and Kreidenweis, 2002; CitationHand et al. 2002b). The hygroscopic behavior of atmospheric aerosols, which can have a dramatic effect on visibility impairment, has been characterized with nephelometer-based measurement systems (e.g., CitationCovert et al. 1972; CitationRood et al. 1985; CitationDay et al. 2000) and with OPC-based systems (e.g., CitationKreisberg et al. 2001).
Multiangle light scattering (MLS) detection of individual particles can be utilized to address some of the unknowns that are beyond the capabilities of traditional single-detector OPCs or other aerosol instruments. The capabilities of the MLS technique include characterization of particle shape (CitationHirst et al. 1994; CitationKaye et al. 1996; CitationSachweh et al. 1995; CitationDick et al. 1996; CitationDick et al. 1998), determination of particle refractive index (CitationDick et al. 1994; CitationBaumgardner et al. 1996), and measurement of particle size (CitationBaumgardner et al. 1996; CitationSzymanski et al. 2002). Optical measurements of particle sphericity offer a direct validation or invalidation of the use of Mie theory in visibility modeling, and may reveal unexpected microphysical properties (CitationDick et al. 1998). Refractive index data can be used to help validate particle refractive index models, and to resolve pressing composition issues such as the determination of species-associated water content and total water content. In a broader context, representative measurements of atmospheric particle refractive index are needed for better quantification of aerosol radiative forcing (CitationCharlson et al. 1992).
In this work, we summarize measurements of atmospheric particle refractive indices using an MLS instrument (DAWN-A aerosol analyzer; Wyatt et al. 1988) and the interpretation of these measurements. MLS data were recorded during the Southeastern Aerosol and Visibility Study (SEAVS), conducted in the summer of 1995 on the southwestern edge of the Smoky Mountains National Park. The DAWN-A was used for distinguishing between spherical and nonspherical particles and for determining real refractive indices, n, of the spherical fractions of DMA-classified submicron atmospheric particles as functions of size (D p = 0.2–0.8 μ m) and relative humidity (RH).
The refractive index measurements are interpreted in the context of concurrent measurements of particle composition and water content. Size- and RH-dependent water content measurements were obtained with a tandem differential mobility analyzer (TDMA; McMurry and Stolzenburg 1989) and species' mass concentration data from MOUDI cascade impactors (CitationMarple et al. 1991) during SEAVS. As in previous studies by McMurry and coworkers (CitationZhang et al. 1994; CitationMcMurry et al. 1996), the TDMA and MOUDI measurements formed the foundation of a visibility model. In this study, we have found that the DAWN-A, TDMA, and MOUDI instruments provide a cohesive trio of datasets from which closure has been drawn.
In the following section, we briefly describe the DAWN-A system and the methodology of refractive index determination from MLS data. Next, we describe calibration of the DAWN-A based on measurements of a variety of laboratory-generated particles and application of the calibration to derivation of refractive indices of particles measured during SEAVS. Measured refractive indices are then compared to values modeled from MOUDI-measured chemistry data. From such analyses, we are able to derive an effective study-average value of n for organic carbon, and to draw conclusions regarding water content for both organic carbon and sulfate species measured at SEAVS.
REFRACTIVE INDEX MEASUREMENT APPROACH
The apparatus and measurement analysis approach used for measurement of submicron particle refractive index are described briefly here. We refer the reader to previous works (CitationWyatt et al. 1988; CitationDick et al. 1994; CitationSachweh et al. 1995; CitationDick et al. 1996; CitationDick et al. 1998; CitationDick 1998) for supplemental descriptions.
Apparatus
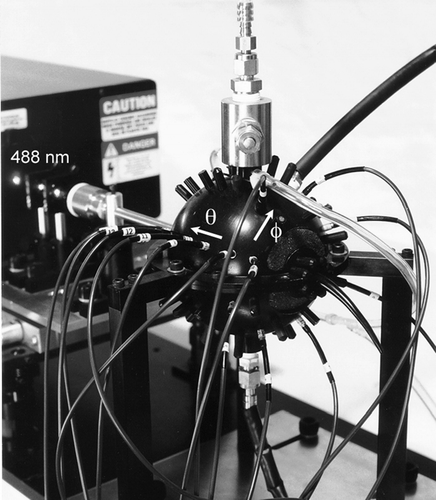
The DAWN-A (Model 1) is a laser-based single-particle light scattering instrument with 14 narrow-aperture fiber-optic detectors that may be freely arranged among 72 detector ports of a spherical scattering chamber (10 cm O.D., 4 cm I.D.). The DAWN-A optical assembly is shown in . A circularly polarized argon-ion laser beam (λ = 488 nm) was focused and projected horizontally through the chamber, intersecting a vertically flowing stream of sheathed particle-laden air at the center of the chamber. Light scattered by an individual particle within the viewing volume is collected by the 14 optical fibers with lenses that subtend collection half-angles of 1.25°.
FIG. 1 Photograph of the DAWN-A optical assembly showing the argon-ion laser, light-scattering chamber, and fiber-optic detectors. Azimuthal (φ) and polar (θ) angular coordinate directions are indicated by arrows.
The optical fibers guide the light to 14 photomultiplier tubes (PMTs; Hamamatsu R647-04), which convert the incident photon fluxes into detectable current levels. Trans-impedance amplifiers then convert the pulses of current into voltage-based signals, which are presented to a 16-channel transient waveform digitizer (Tektronix/Analytek Model 2000RH1) for recording purposes. A sampling frequency of ∼ 3 MHz (per channel) was chosen for all measurements presented, resulting in the recording of 512 digitized values for each signal. For every particle detected, 16 digitized signals were transferred from the digitizer to a personal computer using a GPIB interface. Since two channels did not have detector inputs, the associated signals were essentially at ground. Post-measurement digital integration of amplitude was performed on all recorded pulses to minimize the effects of signal noise(CitationSachweh 1993; CitationSachweh et al. 1995). Background subtraction was also performed to eliminate DC offsets. The digitizer has 12 bits of resolution, but the contributions of discretization noise and the effective use of only half of the amplitude range resulted in 10 true bits of resolution.
Light scattering measurements were made for particles of known size, thereby eliminating one of the three unknowns (size, shape, and refractive index) from the inverse problem. Monodispersions of laboratory-generated and atmospheric particles were selected with a differential mobility analyzer (DMA; CitationLiu and Pui 1974; CitationKnutson and Whitby 1975) and were drawn into the DAWN-A light-scattering chamber for measurement. MLS data have been analyzed for both shape and refractive index. In a previous article (CitationDick et al. 1998), we presented results on particle shape, obtained by placing detectors at all eight (8) available azimuthal positions at a fixed polar angle of θ = 55° (CitationSachweh et al. 1995). Refractive index has been inferred from measurements made with the remaining six detectors positioned at polar angles of 40°, 75°, 90°, 105°, 125°, and 140° and from the average response of the eight 55° detectors.
Analysis
Each MLS measurement, after digital signal processing (DSP), typically consisted of 512 particle records containing integrated pulse amplitudes and associated pulse widths for each of the 14 detectors. Particle light scattering records were selected in successive steps based on both the average and standard deviation of response among the eight detectors positioned at 55°. Particles were first selected on the basis of their mean response at 55°, as originally described by CitationDick et al. (1994). This procedure essentially consisted of selecting responses that were likely to correspond to particles that exited the inlet without recirculation and traversed the laser beam through its center. Selection in the current study was more liberal than that of CitationDick et al. (1994), typically yielding selected counts greater than 400 for calibration measurements consisting of 512 particle records. Responses from multiply-charged particles, which are larger than the primary singly-charged particles of interest, were also deselected with this procedure but not entirely.
The sphericity of each selected particle was then characterized based on variation of the 55° responses (i.e., azimuthal scattering; CitationSachweh et al. 1995; CitationDick et al. 1996; CitationDick et al. 1998). Particles were distributed between nonspherical and spherical classes, defined empirically from measurements of cubic sodium chloride particles and spherical dioctyl sebacate (DOS) droplets (CitationDick et al. 1998). Either of these shape subfractions may be chosen for further analysis. In the present work, the focus is on analysis of the spherical particles for two reasons. First, Lorenz-Mie theory (CitationLorenz 1898; CitationMie 1908), the analytical formulism for scattering by homogeneous spheres, is used to infer refractive indices from response as a function of polar angle. Inclusion of responses from nonspherical scatterers may cause erroneus results. Second, spherical scattering signatures are believed to be associated with the multi-component droplets whose refractive indices we were interested in modeling. In previous work, we argued that the atmospheric aerosol measured during SEAVS could reasonably be approximated as an external mixture of two types of particles: (a) nonaqueous soil dust particles, and (b) droplets consisting of homogeneous (internal) mixtures of the remaining predominant species: sulfate compounds, organic compounds, elemental carbon, and water (CitationDick et al. 1998, Citation2000). Number fractions of nonspherical particles measured by the DAWN-A were shown to be correlated with the modeled number fractions of soil dust particles (CitationDick et al. 1998). Conversely, one may speculate that the spherical scattering signatures correspond to the multicomponent particles. In general, we found that 90% or more of particles smaller than 0.8 μ m in diameter were spherical.
Selected responses corresponding to spherical particles (in the case of atmospheric particle samples) were averaged for each of the seven polar angles (θ = 40°, 55°, 75°, 90°, 105°, 125°, 140°) and were scaled with size-dependent detector calibrations for comparison with theory. The calibrations were derived from post-study measurements of laboratory-produced particles spanning a fairly wide range of refractive index. Calibration of the DAWN-A is described in the next section.
Instrument Calibration
Our aim in the calibration of the MLS instrument was to provide for each detector a relationship between: (a) the measured response to particles of known size and incident illumination and (b) the partial scattering cross section (i.e., the theoretical ratio of the power scattered into the detector to the incident irradiance). Ideally, this relationship is one of proportionality, allowing simple theoretical interpretation of measurements. In practice, the relationship is obscured by factors such as nonlinear detector response, response drift with time and temperature, data acquisition limitations, signal processing, and data processing.
To determine the relationship between measured scattering and theoretical scattering for a given detector, the scattered power must be varied over an appropriate dynamic range. Either varying the size or the refractive index of the calibration particles can achieve this variation for a fixed state of the instrument. We chose to vary particle refractive index by measuring a variety of model particles.
The approach we used for measuring the effective refractive index of particles consisted of (1) measuring the scattered irradiances of several hundred individually illuminated particles using multiple discrete detectors, (2) averaging the irradiances corresponding to each detector to derive effective irradiances for the particles, and (3) performing a best fit of these measured irradiances to theoretically calculated dimensionless irradiances. In the following section we describe how the theoretical irradiances are modeled to provide a simple, direct relationship between measurements and theory.
Theoretical Scattering Cross Sections
The optical power scattered into a finite aperture detector by a particle is equal to the product of the irradiance of the incident light, I o , and the angular scattering cross section, C s . The angular scattering cross section, which has units of area, is a function of (1) the position of the detector with respect to the direction of incidence, (2) the detector aperture, (3) the size, shape, and complex refractive index of the illuminated particle, and (4) the polarization states of the incident and collected light. We derive a concise expression that provides an effective or average value of the angular scattering cross section for an ensemble of individually measured particles. Averaging particle measurements allows us to make use of absolute multiangle scattering measurements.
Absolute measurements of scattered irradiances from individual particles could not be used to determine the refractive indices of individual particles because the Gaussian spatial intensity profile of the laser beam results in significant variation of I o and hence variation in the scattered irradiances. Although the use of relative measurements (i.e., ratios of detector responses; CitationQuist and Wyatt 1985) may alleviate the problem of variable intensity, thus enabling characterization of individual particles, this approach was not explored in the current work. Sensitivity to refractive index may be enhanced through the use of linearly polarized light and/or depolarization of detected light (e.g., CitationZhao et al. 1997; CitationZhao 1999), however, such analyses were beyond the scope of this study.
For an arbitrary detector with solid collection angle Δ Ω, the angular scattering cross section for an individual particle is (CitationBohren and Huffman 1983):
The single-particle differential scattering cross section, dC
s
/dΩ, is sensitive to both x and m and is calculated as a function of the angular direction of scattering, ![]() . The differential scattering cross section for the ensemble may be calculated with Lorenz-Mie theory assuming that each particle is a homogeneous sphere. The effective angular scattering cross section corresponding to an ensemble of individually measured particles may be determined by integrating Equation (Equation1) over the distribution of particle properties F(x,m) for the ensemble:
. The differential scattering cross section for the ensemble may be calculated with Lorenz-Mie theory assuming that each particle is a homogeneous sphere. The effective angular scattering cross section corresponding to an ensemble of individually measured particles may be determined by integrating Equation (Equation1) over the distribution of particle properties F(x,m) for the ensemble:
Two major simplifications may be made to Equation (Equation3) following the approach of CitationJones et al. (1994). First, since test particles of known complex refractive index m p were used for calibration, the following substitution may be made:
Second, for sufficiently small detectors, CitationJones et al. (1994) noted that the integral of the differential scattering cross section in Equation (Equation3) may be replaced by its average over the solid angle subtended by the detector, with minimal error incurred. Furthermore, we contend that the average dC s /dΩ over the small area of each DAWN-A detector is accurately represented by the value at the angular center, Ω*:
The simplifications represented by Equations (Equation4)–(Equation6) reduce the integral expression in Equation (Equation3) to the following form for an ensemble of particles:
The effective differential scattering cross section is obtained by dividing Equation (Equation7) by the detector solid angle, Δ Ω :
This expression was evaluated for each detector with a 15-point trapezoidal integration over the size distribution f(x). Calculations were made for seven narrow-aperture detectors (1.25° half-angle) positioned at θ* = 40°, 55°, 75°, 90°, 105°, 125°, and 140°. The azimuthal angle, φ*, was arbitrary because the laser was circularly polarized. (The response at θ* = 55° is taken as the average of measurements made with eight detectors at radially symmetric azimuthal positions.) Centroid size parameters, x*, were determined using Equation (2a) for D p * = 0.2–0.8 μ m and λ = 0.488 μ m. The distribution half-width is equal to the ratio of the aerosol flow rate to the sheath flow rate in the DMA. On average, this ratio was 0.101 for laboratory and field measurements.
Modeling the size distribution as triangular based on the triangular shape of the DMA mobility transfer function (CitationKnutson and Whitby 1975) is a reasonable approximation. For a spherical particle carrying a single unit of charge, the relationship between mobility, Z p , and the particle diameter is Z p = 300 eC/3π η D p , where e is the elementary unit of charge, C is the dimensionless slip correction, and η is the viscosity of the carrier gas (CitationLiu and Pui 1974). Since the slip correction factor depends on particle size, it has the effect of skewing the size distribution from a symmetric triangular representation. However, calculations predict relatively little difference in the slip correction factor between the smallest and largest diameters of each distribution considered. These differences range from a minimum of 4% for D p * = 0.8 μ m to a maximum of 10% for D p * = 0.2 μ m.
For a circularly polarized incident beam, the single-particle differential scattering cross section is given by
We calculated the complex quantities S1 and S2 using the BHMIE code from CitationBohren and Huffman (1983).
Calibration Particle Generation
Light scattering measurements of six laboratory-generated particle materials, with real refractive indices ranging from n = 1.38 to 1.61 (λ = 488 nm), are the basis for the DAWN–A calibrations. The particle materials were selected according to their ease of generation and also by how well they would simulate the anticipated characteristics and behavior of atmospheric particles. Sulfuric acid, generated at both low humidity and at high humidity conditions, and ammonium sulfate at high humidity served as models for hygroscopic, sulfate-dominated atmospheric particles. Together, these sulfate particles had n ranging from 1.38 to 1.42 for relative humidity (RH) ranging from 8% to 73%. Two organic compounds, dioctyl sebacate (DOS), and dioctyl phthalate (DOP), were used for midrange indices, with values of n = 1.45 and n = 1.49, respectively. A third organic compound, denoted “DPS” in this work, was created to provide light-absorbing droplets with known values of the imaginary component, k, of the complex refractive index. In contrast to the sulfate particles, DOS, DOP, and DPS particles are hygrophobic. PSL spheres, with n = 1.61, were generated to provide additional dynamic range in light-scattering response for comparable particle sizes.
DPS consisted of a 10:12 solution (by volume) of DOS and Di-(2-ethyl hexyl)-phosphoric acid with varying amounts of Safranin O (Red Dye No. 2). The organic phosphoric acid was used as an anionic detergent to transfer the light-absorbing cation of the Safranin O from its aqueous phase to the organic DOS phase. Solutions of DPS diluted with varying amounts of isopropyl were measured with a spectrophotometer (Milton Roy Spectronic 3000 Array) to determine the relationship between dye concentration and k at λ = 488 nm. Although peaks in absorption were observed for the various dilutions at about λ = 540 nm, absorption at λ = 488 nm was strong enough for creation of DPS solutions with known k up to 0.01.
Solutions of the calibration materials were atomized and classified with a DMA to produce monodisperse particles. The monodispersions had mean mobility diameters of 0.2, 0.3, 0.4, 0.5, 0.6, 0.7, and 0.8 μ m for all materials except PSL. Six nominal diameters of PSL spheres ranging from 0.21 to 0.74 μ m were generated. A mobility scan of each PSL size distribution was performed to determine the peak diameter. PSL was then classified at the associated peak voltage during generation.
The DMA was operated with respective aerosol and sheath flow rates of 0.33 and 3.27 Lpm. is a schematic of the complete system constructed for generation of calibration particles and for their subsequent measurement by the DAWN-A. Generation was performed either in a “dry” mode (RH = 4–10%), during which a membrane dryer (Perma Pure MD-110-24CS) was used to remove water from particles prior to classification, or in a “wet” mode (RH = 44–76%), during which the dryer was bypassed to allow water retention by hygroscopic particles.
FIG. 2 Schematic diagram of the flow system used for generation and sampling of calibration particles.
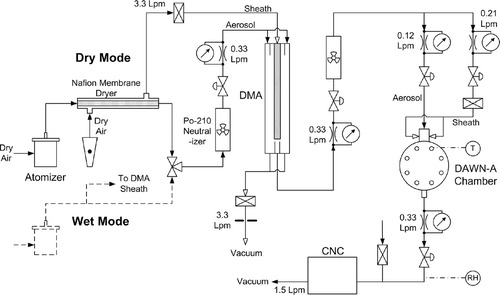
The flow system was configured to maintain steady RH, thereby preventing changes in particle properties due to water uptake or evaporation. In the DMA, particle growth due to RH gradients may affect classification, so sheath air RH and aerosol RH were matched as closely as possible. When using the dryer, the purge air was used for DMA sheath air. When bypassing the dryer, the polydisperse aerosol was split between the aerosol and sheath flows through the DMA. Changes in RH between the DMA and the DAWN-A could have affected particle size and refractive index leading to erroneous inversions or interpretations of light scattering data. To avert this problem, a fan was used to mix air surrounding the DMA and DAWN-A components, providing a more uniform temperature distribution throughout the plumbing system, and hence minimizing RH variation. Differences between the DAWN-A chamber and the DMA were within ±0.5°C during the SEAVS study, resulting in differences in RH of ± 2% (absolute) on average for wet aerosols.
To ensure uniform RH through the DAWN-A chamber, aerosol flow from the DMA was split between the aerosol and sheath flows (0.12 Lpm and 0.21 Lpm, respectively) in the DAWN-A aerosol inlet. Relative humidity measurements were made downstream of the chamber with a Vaisala Model HMP 233 probe, which provided factory-calibrated accuracies of ± 1% for 0–90% RH and ± 2% for 90–100% RH. The probe was also used for measurements of temperature, which were within 0.6°C of concurrent chamber temperatures measured with a J-type thermocouple (positioned in one of the detector ports) during the generation of ammonium sulfate and sulfuric acid particles.
Calibration Particle Optical Properties
Calculation of the theoretical differential cross sections for the calibration particles requires knowledge of their complex refractive index, m. Transparent calibration particles were modeled as having an imaginary component of zero (k = 0) while DPS particles were modeled using values of k measured with spectrophotometry. Specification of the real component of the refractive index required determination of the dispersion of each material in the visible because values of n in the literature, when available, are typically given for the sodium line, λ D = 0.5893 μ m, whereas the wavelength of the argon ion laser used in our measurements was λ = 0.488 μ m. Dispersion is conveniently characterized by the Lorentz-Lorenz formula, shown here in its molar form:
A number of different approaches and datasets were used to derive molar refraction values for the various calibration particle component materials. The reader is referred to CitationDick (1998) for more details. Molar refractivities were determined for NH4 + and SO4 2 − ions using data from CitationKruis and Geffcken (1936) and added stoichiometrically to derive a value of R = 23.52 cm3/mol (λ = 0.488 μ m) for ammonium sulfate. A value of R = 13.62 cm3/mol (λ = 0.488 μ m) for sulfuric acid was determined from density and refractive index data at four wavelengths (AIP Handbook; Gray 1982) and then regressed to determine constants used in constructing a predictable relationship between R and frequency ν, as described by CitationBauer and Fajan (1942). Water refractivity dispersion was obtained from 23 values of n as a function of wavelength (CitationChéneveau 1930), providing a value of R = 3.750 cm3/mol at 0.488 μ m.
To determine n for sulfuric acid as a function of relative humidity, molar volume, and molar refraction were calculated for the binary solution of sulfuric acid and water using compositional data from the literature. The molar volume of a binary solution may be defined in terms of the molar fractions, x i , as follows (CitationMoelwyn-Hughes 1961):
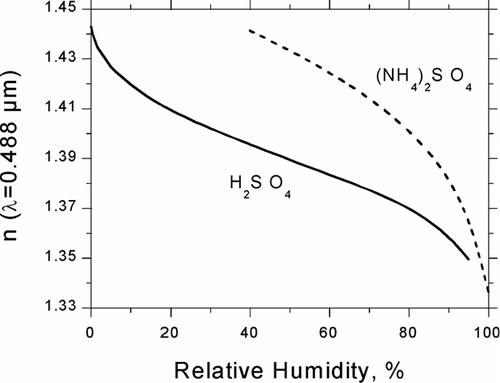
Values of ![]() and
and ![]() were substituted into Equation (Equation11) for calculation of RH-dependent refractive indices of sulfuric acid and ammonium sulfate, shown in for λ = 0.488 μ m. Values from these curves were employed in the calculations of differential scattering cross sections given by Equation (9).
were substituted into Equation (Equation11) for calculation of RH-dependent refractive indices of sulfuric acid and ammonium sulfate, shown in for λ = 0.488 μ m. Values from these curves were employed in the calculations of differential scattering cross sections given by Equation (9).
FIG. 3 RH-dependent refractive index of sulfuric acid and ammonium sulfate derived from partial molar refractions at λ = 488 nm.
Molar refractions of DOS and DOP were determined from measurements of n D (λ D = 0.5893 μ m) and Δ n = n(0.4861 μ m)-n(0.6563 μ m) that we made with an Abbé refractometer (Bausch & Lomb ABBE 3-L). DOS dispersion was measured as n D = 1.4483 and Δ n = 0.007407, and DOP as n D = 1.4843 and Δ n = 0.01104. Prior to determining the molar refractions of DOS and DOP, however, we used Cauchy's dispersion formula for determining n at λ = 0.488 μ m, and these values have been employed in the calibration calculations of Equation (9). The Cauchy formula in its simplest form may be expressed as
lists the parameters a and b derived from the refractometer measurements of DOS and DOP and also those reported for PSL by CitationKerker (1969). also lists real refractive indices at 0.488 μ m and 0.5893 μ m calculated with the Cauchy formula. Although Cauchy dispersion may be better suited for gases than for liquids or solids, the differences between the Cauchy-derived values and those calculated using molar refractions are less than ± 0.0001 for DOS and DOP at each wavelength. This mathematical uncertainty is likely to be less than the error of the refractometer measurements.
TABLE 1 Cauchy dispersion parameters, values of n calculated from the Cauchy formula
Response vs. Theory; Linear Calibrations
Bias potentials applied to the photomultiplier tubes (PMTs) were set according to polar angle to provide comparable pulse heights among all detectors. Scattered irradiances differ by about one to two orders of magnitude between the forward-most angle (θ = 40°) and angles in the backward hemisphere (θ ≥ 90°) for D p = 0.3–0.8 μ m. Thus, the backward hemisphere detectors were operated at higher gain than those in the forward hemisphere. The input voltage ranges of the digitizer were also varied according to particle size for some of the channels to provide additional dynamic range. The trigger level (channel 1) of the digitizer was set to 0.17 V for all measurements.
Examples of the relationships between measured angular response and the corresponding theoretical differential cross sections are shown in for 0.3-μ m calibration particles. Responses measured at angles of θ = 55° and 75° with 900 V PMT bias potential and 150-mW laser output power are plotted against theory calculated from Equations (Equation8) and (9). Response at a given angle generally increases with refractive index.
FIG. 4 Responses to six different 0.3-μ m calibration particles vs. Lorenz-Mie theoretical dimensionless irradiances calculated for polar angles θ = 55° and 75°.
Calibrations were performed for 11 combinations of particle size ranging from 0.2 to 0.8 μ m and laser power ranging from 60 to 180 mW. Individual linear fits of response to theory were performed for these combinations for each of the seven (7) polar angles, resulting in 77 linear fits. Outlier points were hand-picked for exclusion from fitting. If a measurement included outliers at four or more polar angles (out of the seven total), it was discarded altogether.
The relationship between the measured response M and the dimensionless theoretical response T for the polar angle θ j may be written as:
We may express the slope of the calibration as
For a given incident power, the slope of a calibration line is dictated by K j , which depends primarily on the PMT sensitivity and the gains of the amplifiers.
The effective light scattering response of the DAWN-A to an arbitrary selection of particles at an angle θ j is characterized by the average and standard deviation of response over the selection:
Calibrations were applied to angular responses by inverting the linear fits to yield theory as a function of measured response. The calibrated response is therefore given by
Thus, detectors that have low gain, corresponding to relatively flat linear fits, will yield greater uncertainties δ T j . High-gain detectors, with steep linear fits, will yield values with lower uncertainties. This inherent performance information is employed in the inversion for refractive index where the angular-dependent uncertainties are used for weighting.
Measurements of DMA-classified DOS droplets were also performed in the field during the study. Differences were observed between the field and laboratory measurements, indicating that a systematic change in performance had occurred. Response to DOS in the field was relatively constant during the study. The relative differences between study-averaged responses and laboratory measurements were within ± 30% for all particle sizes and detection angles. These differences were used to derive linear calibrations with different slopes for application to all field data including atmospheric particle measurements. Based on measurements of calibration particles made with different laser powers at selected sizes, we determined that the intercepts of the linear fits were essentially fixed even when laser power, amplifier gain or detector gain changed. This “hybrid” calibration for field data consists of modifying slopes of the linear fits as follows:
Hence, two sets of linear calibration slopes have been used for the conversion of measured response to the dimensionless theoretical space. One set (G j lab ) was applied to laboratory measurements, and the other (G j field ) to measurements of calibration particles and atmospheric particles made during SEAVS.
REFRACTIVE INDEX INVERSION
Refractive index is inferred from a given MLS measurement by comparing the calibrated responses T j to MLS response calculated with Lorenz-Mie theory for different values of refractive index. The comparison is performed using a least-squares fitting procedure, where the best fit of Lorenz-Mie theory to calculated response is obtained by minimizing χ2 (CitationBevington and Robinson 1992):
Here, ![]() j
Mie
(n) is the scattering calculated at θ
j
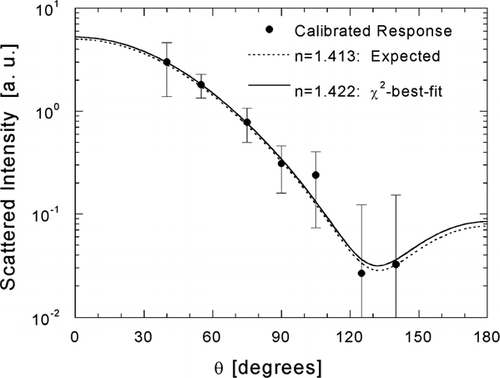
with Lorenz-Mie theory assuming a given real refractive index value of n. An example of the inversion is demonstrated in , which compares the calibrated response of 0.3 μ m wet ammonium sulfate particles to Mie theory scattering diagrams (θ = 0–180°) calculated for expected and inferred values of refractive index. The expected value, n = 1.413, was determined for the measured RH of 71% using the fit of n to the square root of mass solute fraction (represented by the (NH4)2SO4 curve in ). The χ2-minimization yields a value of n = 1.422, differing by only Δ n = 0.009 from the expected value, despite the inclusion of an outlier at θ = 105°.
j
Mie
(n) is the scattering calculated at θ
j
with Lorenz-Mie theory assuming a given real refractive index value of n. An example of the inversion is demonstrated in , which compares the calibrated response of 0.3 μ m wet ammonium sulfate particles to Mie theory scattering diagrams (θ = 0–180°) calculated for expected and inferred values of refractive index. The expected value, n = 1.413, was determined for the measured RH of 71% using the fit of n to the square root of mass solute fraction (represented by the (NH4)2SO4 curve in ). The χ2-minimization yields a value of n = 1.422, differing by only Δ n = 0.009 from the expected value, despite the inclusion of an outlier at θ = 105°.
FIG. 5 Example of the χ2-best-fit inference of the real component of refractive index shown for a 0.3-μ m ammonium sulfate droplet. Scattering diagrams calculated with Lorenz-Mie theory are shown for the expected refractive index (broken line) and the inverted refractive index (solid line).
The variability in response represented by the error bars in is significant with respect to the change in average response expected for modest changes in refractive index. Variation in incident intensity, due to deviation of particle position from the center of the Gaussian laser beam during illumination and referred to as autocorrelation here, does contribute notably to this variability when the signal-to-noise ratio at a given angle is strong. For the measurements presented in , we normalized detector responses to the response at 55° for each particle to determine the magnitude of the autocorrelation effect. The standard deviation of the ratio I(40°)/I(55°), where I represents measured intensity, was 44% lower than the standard deviation of the absolute response I(40°). For responses at 75° and 90°, the reductions in standard deviations were 20% and 7%, respectively. For the three remaining angles (105°, 125°, 140°), where the signal-to-noise ratio approaches a practical lower limit, reductions were not statistically significant. The contribution of variant particle diameter (defined by the DMA transfer function) is relatively minor. For 40°, 55°, and 75°, the ratios of the standard deviations of theoretical response for the modeled size distribution are only 10%, 19%, and 10% of the standard deviations in measured response. For the remaining angles, the relative contributions are only 2 to 5%. Considering that autocorrelation includes the effect of variant particle diameter, since changes in particle diameter generally shift all responses up or down, the combination of these two effects accounts for roughly 5 to 50% of the observed variability for the measurement shown in . Noise is presumed to account for the balance, illustrated well by the 0.3-μ m angular response, which spans approximately two orders of theoretical scattering, with especially low values at θ = 125° and 140°. In contrast, 0.2-μ m scattering spans only one order, with higher values than 0.3-μ m scattering at these large angles. Use of the uncertainties δ T j in the inversion minimizes each of the aforementioned adverse effects, especially the effect of poor signal-to-noise.
An analysis of refractive index measurement uncertainties is presented in for the calibration particles, consisting of spherical droplets, and for dry ammonium sulfate and sodium chloride particles, which are relatively non-spherical. Measurement errors, Δ n = n(measured)-n(expected), are listed as functions of size and of material. Expected values of n are provided for each material. Results are presented for particle selections based upon average response at 55° only (i.e., particles were not selected on the basis of particle sphericity).
TABLE 2 Errors in inferred refractive indices (inferred-expected) for calibration particles. For the values shown, shape distinction was not applied to the measurements prior to their inversion
Note that there is a systematic error (i.e., positive or negative) in the derived refractive indices of each material, which is reflected by the average error at the bottom of each material column. These systematic differences tend to be greater for the hygroscopic particles owing, in part, to their difficulty in generation and characterization. The largest average difference (+0.024) was obtained for dry H2SO4. Sources of this difference may include errors in modeling of the refractive index for dry H2SO4. Consideration of these larger errors is essential for characterizing the quality of measurements of atmospheric particles, since they also tended to be hygroscopic. Biases may also be introduced by multiply-charged particles, whose responses may have not been completely deselected. Values are not presented for 0.8 μ m wet H2SO4 and 0.8 μ m dry H2SO4 because these measurements included four or more (out of seven) outliers in the linear calibration fits, resulting in their rejection.
Results for inversion of PSL refractive index are not presented, due to the general uncertainty in peak diameter and size distribution width, which had a large influence on the inversion. Inversions were performed for two characteristic choices of PSL peak diameter: (1) nominal diameter, specified by the manufacturer, and (2) mobility diameter determined from classification with the DMA. As in previous work (CitationDick et al. 1994), mobility scans were performed manually with the DMA to simultaneously check DMA performance and to measure PSL peak size. Scans performed in the current work gave systematically higher diameters (3% on average) than the nominal PSL diameters provided by the manufacturer. Inverting data using nominal diameter values for PSL peak diameter resulted in refractive index values closer to the expected value of n = 1.611, suggesting that there may have been a systematic DMA sizing error of +3% for all calibration particles. This sizing error would have a negligible effect on inversion of measurements of the other calibration particles or atmospheric particles because the bias is always in the same direction.
The average and standard deviation of the refractive index errors were calculated for the calibration particles (droplets) as a function of particle size (). The average error is small (Δ n < 0.01) at each size, as one would expect, because the response measurements themselves were used for deriving the linear response calibrations. The standard deviation of the error among the materials, however, provides a gauge of the error to be expected from measurement of particles of unknown composition, and represents the combined effects of particle sampling, data processing, and the inversion procedure. The average of the size-dependent uncertainties is ± 0.015. We therefore specify an overall uncertainty of Δ n = ± 0.02 for DAWN-A refractive index measurements.
The errors of refractive indices inferred for two crystalline salts, dry ammonium sulfate and dry sodium chloride are also listed in . Measured refractive indices are lower than expected at all sizes for both materials due to the influence of particle non-sphericity on angular light scattering. The influence appears to be relatively mild for the ammonium sulfate particles, with an average error of Δ n = −0.043. For crystalline sodium chloride particles, errors are significantly greater, with an average of Δ n = −0.090. The error in measured refractive index for these two materials roughly correlates with the non-sphericity measured optically by CitationDick et al. (1998). In that work, sodium chloride particles were observed from electron microscopy to be single cubes and the measured variability in azimuthal scattering at 55° was very high, allowing clear distinction of the cubes from spherical DOS droplets. Ammonium sulfate particles were observed from electron microscopy to be spheroids with moderate to large surface irregularities. Azimuthal scattering signatures from these particles were not nearly as discernable from droplet scattering signatures. The large errors obtained for sodium chloride cast doubt on the ability to accurately infer refractive indices for the non-spherical subfractions of atmospheric particles, which were identified as consisting primarily of soil dust particles (CitationDick et al. 1998).
The effectiveness of the hybrid calibrations for inversion of field data is demonstrated in . Refractive index measurement errors are presented for light-absorbing DPS droplets with known values of the imaginary component, k = 0.002, 0.005, and 0.010. The expected real component of refractive index for DPS is 1.449, based on Abbé refractometer measurements made for the transparent DOS/phosphoric acid solution. Multiangle measurements of the light-absorbing particles were made in the field at D p = 0.2−0.6 μ m and have been processed with the hybrid calibrations. The observed uncertainties are consistent with those derived from the laboratory calibration measurements (). The overall uncertainty (estimated analogously to the laboratory measurements) is ± 0.012, and 15 of the 18 measurements have errors within ± 0.015.
Table 3 Errors in inferred refractive indices (inferred-expected) for light-absorbing DPS particles measured during the SEAVS field study. The values shown are for selected spherical subfractions to which laboratory/field “hybrid” calibrations were applied. The expected real part of the refractive index is n = 1.449
The inversions of DPS data were repeated assuming that k = 0. All inferred values of n decreased. Size-averaged errors (Δ n) of +0.003, 0.000, and –0.011 were obtained when the known values of k (0.000, 0.005, and 0.010, respectively) were assumed during inversion. When k = 0 was assumed, respective size-averaged errors of 0.000, −0.007, and −0.026 were obtained from inversion. Thus, the inferred value of n decreased by 0.015 for the most absorbing solution (k = 0.010).
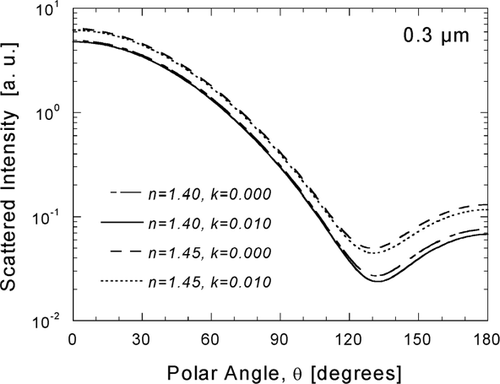
Results from the inversion of DPS measurements demonstrate the capability of the DAWN-A to sense small changes in angular scattering resulting from modestly light-absorbing materials and illustrate the importance of estimating k for inversion of n. The sensitivity of angular scattering to the real and imaginary parts of the refractive index is further illustrated in , in which scattering diagrams are shown for two values of the real part (1.40 and 1.45) in combination with two choices of the imaginary part (0.000 and 0.010) for D p = 0.3 μ m. To minimize the impact of unknown k on inversion of n, atmospheric particle light-scattering measurements, presented in the next section, were inverted with our best estimates of k determined from measurements of black carbon.
FIG. 6 Sensitivity of angular scattering to the real and imaginary components of the complex refractive index, illustrated with scattering diagrams calculated for a matrix of refractive indices defined by real values n = 1.40 and 1.45 and imaginary values k = 0.000 and 0.010.
Atmospheric Measurements
Field Data
The SEAVS atmospheric visibility study was conducted in the summer of 1995, from July 15 through August 25. The study was conducted in order to gain a better understanding of aerosols and their effect on visibility in the Southeastern United States, where humid conditions and high levels of light extinction are typically encountered. Aerosol instrumentation was installed at the observatory point Look Rock, located on the southwestern edge of the Great Smoky Mountains National Park, near Townsend, Tennessee and about 40 km southeast of Knoxville, Tennessee. The study was remarkable due to the extremes in visibility encountered over the 42-day study. It started with the characteristically poor visibility noted for the region. Within 10 days, the site experienced a major soil dust episode whose source has been attributed to the arid regions of North Africa (CitationPerry et al. 1997). In the middle of the study, a brief, but exceptionally clean period of hurricane influence occurred during which the visual range increased to approximately 125 km. Towards the end of the study, record high particle concentrations were reported, resulting in visual range values as low as 6 km. DAWN-A measurements of angular light scattering by atmospheric particles are presented for 31 of the 42 days of the SEAVS study, from July 21 to August 20, 1995 (Julian dates JD 202-232), during which the dust storm, hurricane, and pollution events occurred.
A significant portion of the instrumentation at SEAVS was employed for determining various RH-dependent properties of ambient aerosols, and at least three systems operated by different institutions were brought to the site for measurement of RH-dependent water uptake. Because water has such a low refractive index in comparison with other atmospheric aerosol constituents, we expected to see measurable changes in refractive index with the DAWN-A as a function of humidity. In the morning, we measured wet particles at near-ambient RH (44–76%) and in the afternoon, we dried the particles for measurement at low RH (4–10%). As with calibration particles, atmospheric particle samples were drawn into the size-classification and DAWN-A systems shown in (without atomizers) while monitoring RH and temperature downstream of the DAWN-A scattering chamber. The DAWN-A was installed in a trailer for shelter along with several other instruments. Despite the use of air conditioning in the trailer and outside venting of air used to cool the DAWN-A laser, temperatures were high enough inside to decrease RH to the noted levels from initial ambient levels of 62 to 97%.
Daily measurements were made at both high RH and low RH for mean mobility diameters of 0.2, 0.3, 0.4, 0.5 μ m, and at high RH for 0.6, 0.7, or 0.8 μ m when concentrations were sufficiently high (i.e., during the noted haze episode). Measurements of DOS generated with an atomizer were made every other day between wet and dry atmospheric samples at the same diameters. As described in the Response vs. Theory; Linear Calibrations section, study-averaged DOS responses were used in conjunction with laboratory calibration data to derive size- and angle-dependent detector calibrations for transformation of atmospheric particle light scattering responses into dimensionless irradiances. The success of this calibration scheme was demonstrated with measurement results for known light-absorbing particles, presented in .
Examples of calibrated polar scattering responses are shown in and . Measurements of wet and dry samples are contrasted in for D p = 0.2−0.5 μ m. Each set of multiangle response in is compared to a Mie theory scattering diagram calculated with the χ2-best-fit value of refractive index. The value of k assumed in the inversion is indicated in each plot along with the retrieved value of n. Imaginary components were estimated from elemental carbon (EC) content measured on samples collected with a MOUDI impactor.
FIG. 7 Inference of size-dependent atmospheric particle refractive index from χ2-best-fits of Mie theory to calibrated responses. Angular scattering patterns are compared for wet and dry samples for D p = 0.2 μ m (a), 0.3 μ m (b), 0.4 μ m (c), and 0.5 μ m (d).
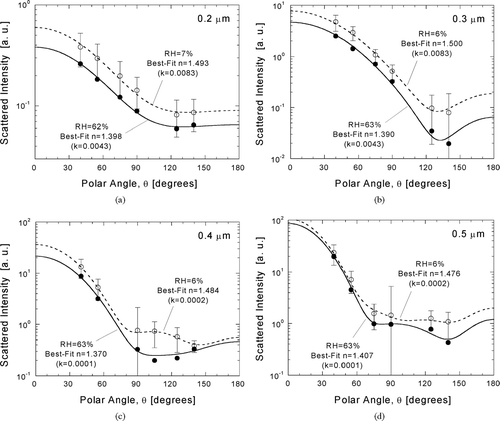
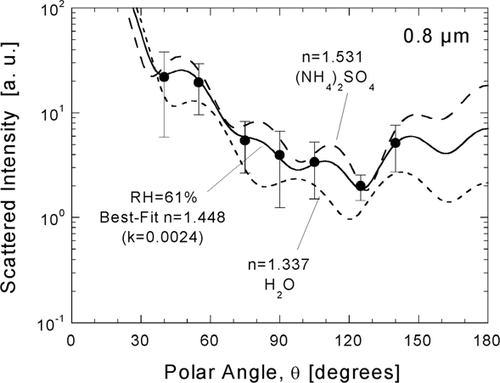
FIG. 8 Inference of atmospheric particle refractive from a χ2-best-fit of Mie theory to calibrated response for D p = 0.8 μ m. The angular scattering pattern for the inferred value (solid line) is compared to patterns calculated for water (dotted line) and crystalline ammonium sulfate (dashed line).
Variability in angle-dependent response is shown in for the dry sample in each plot. The variability is represented by an error bar corresponding to ± 1σ (standard deviation) in response for each detector. This is the same representation as that used in . Error bars are shown for the dry sample only to provide clarity. Note that the variability in response is significantly larger than the sensitivity of scattered irradiance to refractive index. The practices of averaging response for the particle ensemble and weighting response by the angle-dependent variability in the refractive index inversion minimize the contributions of response variation to uncertainty in the retrieved refractive index for monodisperse particles of uniform composition. Analysis of calibration particle measurements using these practices yielded an uncertainty in retrieved n of ± 0.02 for such particles. Atmospheric particles are presumed to vary in composition and present an associated variation in n which may increase the uncertainty in retrieved n due to non-linearities imposed by response averaging.
In , response of the DAWN-A to a wet sample at 0.8 μ m and the associated scattering diagram (n = 1.448, k = 0.0024) are compared to scattering diagrams for water (n = 1.337, k = 0) and crystalline ammonium sulfate (n = 1.531, k = 0), which are considered to be model compounds representing lower and upper bounds, respectively, of refractive index. Error bars corresponding to ± 1σ (standard deviation) in response for each detector are included in this figure. The increase in structure in the scattering diagrams as size increases is clear. The simple curves for 0.2 μ m () have essentially the same shape for the wet and dry indices, whereas curves for 0.8 μ m have five maxima that vary in magnitude and shift with respect to θ as refractive index changes.
Careful review of the plots will reveal that not all seven polar angles are represented at each size. Some of the size-dependent detector calibrations gave generally unacceptable response, resulting in exclusion of the associated responses from all atmospheric measurement inversions at a particular size. Responses excluded from inversion correspond to θ = 105° for 0.2 μ m and θ = 75° for 0.4 μ m due to inadequate sensitivity. Response at 90° for 0.5 μ m is not shown in because it was too low on that day for inversion purposes. This happens to be the only response excluded from inversion of wet 0.5-μ m measurements for the study. The sources of these outlier points are not known, but may include the effects of multiply-charged particles, re-circulating particles, triggering, and noise.
The measurements shown in and were made on August 11, 1995 (JD 223), which marks the beginning of the observed haze episode. It was chosen for presentation because it was one of the few days during which measurements were performed through D p = 0.8 μ m and because there is considerable contrast between wet and dry scattering. The study day was characterized by moderate acidity (ammonium-to-sulfate molar ratio of 1.38) and moderately low organic carbon (OC) content over a 12-hour sampling period. The average value of n for the dry samples (RH = 6–7%) of is 1.488, while the average value for the wet samples (RH = 62–63%) is 1.391. The uptake of water by the particles with increasing humidity is presumed to account for most of this difference. Changes in composition from morning to afternoon may have also contributed. In the following section, the observed variations in refractive index with humidity and chemical composition are compared with modeling in order to infer key properties of atmospheric particles measured during SEAVS.
Refractive Index Modeling
Data from two other instrumentation systems operated by the University of Minnesota at SEAVS have been used for modeling particle refractive index and water uptake. Particle chemical composition was measured with MOUDI impactors (CitationMarple et al. 1991) and aerosol water content was measured with the original tandem differential mobility analyzer (TDMA) described by CitationMcMurry and Stolzenburg (1989). Three MOUDI cascade impactors were operated 12 hours daily, from 07:00 to 19:00 Eastern Time, for collection of size-segregated particle samples that were analyzed for ionic species (primarily sulfate), carbon species (EC and OC), and mineral species (CitationVasiliou and McMurry, 1996). The cut points of the eight MOUDI stages ranged from 0.06 to 3.2 μ m in aerodynamic diameter and were preceded by a cyclone with a 1.8-μ m cut point. Humidifiers were installed upstream of two MOUDI impactors (those used for collection of ionic species and carbon species) to minimize particle bounce (CitationVasiliou et al. 1999). Sulfate ion mass concentrations were determined from ion chromatography and carbon species from a combustion technique (CitationMueller et al. 1982). Soil dust mass was estimated from a sum of oxides of the measured masses of Si, K, Ca, Al, Fe, and Ti (summarized by CitationDick et al. 1998). Aerosol acidity was measured with a Harvard-EPA Annular Denuder Sampler (HEADS), specified in terms of the molar ratio of ammonium to sulfate. Acidity is assumed to be constant with respect to particle size.
Daily TDMA measurements of particle growth sensitivity to relative humidity (RH) were made for 33 days total over the period of July 20 to August 22 or Julian dates 201–234 (CitationGerten and McMurry 1996). (TDMA measurements were not made on August 7, JD 219.) TDMA measurements consist of discrete values of D p /D o measured at several values of RH, where D o is the initial mean particle diameter extrapolated to 0% RH and D p is the mean diameter of particles that have grown from exposure to air of a known higher RH value (CitationMcMurry and Stolzenburg 1989). Measurements were made at initial dry mobility diameters of 0.02, 0.05, 0.1, 0.2, 0.3, and 0.4 μ m and typically at six final humidity levels ranging from about 5 to 85%. At 85% RH, two distinct modes of growth were often observed which are denoted as “more hygroscopic” and “less hygroscopic.” More hygroscopic particles typically increased in diameter by factors of 1.4 to 1.6 for an RH increase from 5 to 85%, while less hygroscopic particles at SEAVS only increased by factors of 1.1 to 1.3. Number fractions of less hygroscopic particles were typically small (≤ 15% for 0.4 μ m initial diameter), and were found to correlate with the number fractions of soil dust (CitationDick et al. 1998). Internal mixtures of sulfate, ammonium, OC, and EC that we model here are therefore expected to correspond to the more hygroscopic aerosol fractions.
RH-dependent particle growth curves for the more hygroscopic fractions identified by the TDMA provide one means of estimating water content for arbitrary RH. For a given initial diameter, D p /D o data were fit with the following third order equation:
Refractive index values were calculated using MOUDI chemistry measurements and various estimates of water content. We compare measured and modeled indices using water content derived from: (1) TDMA RH-dependent particle growth data, (2) water activity data for sulfate compounds, and (3) water activity for OC inferred from analyses of TDMA and MOUDI data (CitationDick et al. 2000). Each refractive index prediction was made using RH measured downstream of the DAWN-A chamber. For each dry particle measurement, one calculation was made using water content from TDMA measurements, since the water activities of the modeled sulfate compounds was essentially zero for RH < 10%, and because we believe that some bound water was likely to be present (CitationDick et al. 2000). For wet measurements, one calculation was made for each water estimate so that the different estimates could be evaluated through comparison with measured refractive index.
Mass concentration values of organic carbon, elemental carbon, and sulfate ion components were taken as the total loadings from the MOUDI stage that appeared to best match the given diameter. Thus, data from MOUDI stage 6, with a cut point D 50 of 0.18 μ m, was used for 0.2 and 0.3 μ m data, stage 5 (D50 = 0.32) for 0.4 and 0.5 μ m, and stage 4 (D50 = 0.56) for 0.6, 0.7, and 0.8 μ m. The component masses obtained from a given stage were converted to assumed forms of each species using the component conversion factor (CCF) values listed in . The use of CCF = 2.1 for OC is discussed by CitationDick et al. (2000). Species mass concentrations were converted to volume concentrations using assumed species densities listed in . These properties mark a departure from those assumed by CitationZhang (1990) in previous visibility work (i.e., CitationZhang et al. 1994; CitationMcMurry et al. 1996).
TABLE 4 Species properties assumed for refractive index modeling. Refractive index real and imaginary components n and k are specified for a wavelength of λ = 488 nm
The complex refractive index for each mixture of ammoniated sulfate, organic carbon, and elemental carbon was estimated by volume-averaging complex indices of the individual species:
When the modeling work was done, no consensus had been reached in the literature on the properties of amorphous elemental carbon (soot), so we used moderate values of the complex refractive index and density. Assumed properties for EC are important because they are used to estimate the imaginary component of refractive index, which is a variable in the inversion of real refractive index from DAWN-A angular response. The importance of estimating k based on EC content was illustrated with results from measurements of DPS calibration particles.
For the complex refractive index of EC, a value of m = 1.93–0.66 i for λ = 488 nm was interpolated from tabulated dispersion data given by CitationBergstrom (1972) that is based on measurements dating back to 1917. Lower values of both n and k in the literature have been derived from reflectance measurements of compressed carbon pellets, e.g., m = 1.56–0.47 i (CitationDalzell and Sarofim 1969) and m = 1.3–0.2 i (CitationBatten 1985). These values are suspect due to possible reflectance measurement artifacts from surface “asperities” (CitationJanzen 1979) and voids between particles (CitationRoessler and Faxvog 1979). Higher literature values include m = 1.7–0.7 i, derived from angular scattering measurements of single carbon particles (CitationPluchino et al. 1980), and m = 2−i from spectrophotometer measurements of carbon black particles in dilute solutions with water (CitationJanzen 1979).
For the effective density of EC, our assumed value of ρ = 1.9 is in the range of 1.8–2.1 specified for amorphous carbon in the CRC handbook (Weast 1982–1983). CitationPark et al. (2004) recently measured an inherent material density of 1.77 g/cm3 for diesel soot, a potentially significant source of the EC in this study. Assumption of this value would result in a 7% increase in the calculated volume of EC and in the calculated value of k.
Properties of the organic subfraction of carbonaceous species are even more uncertain since hundreds of organic species may be present in the atmosphere covering a wide range of carbon numbers, functional groups, solubilities, and so on (CitationSaxena and Hildemann 1996), and only a limited number of these compounds were quantified. We refer the reader to CitationDick et al. (2000) for a discussion of the properties assumed for modeling of organic carbon. In that work, we estimated the amount of water associated with organics as a continuous function of relative humidity from 5% to 85%.
Modeling sulfate refractive index was a challenge due to the substantial variation in sulfate acidity observed from HEADS measurements. The thermodynamics of aqueous ammoniated sulfate compounds are complex and generally their partial molar volumes are not additive, leading to errors when Equation (25a) is used for determining refractive index. The problem is compounded by the efflorescent and deliquescent behavior (i.e., hysteresis) of the less acidic species. Comparison of different water models requires a common scheme for refractive index modeling, however, so volume averages of dry sulfate refractive indices were used in our spreadsheet calculations.
Ammoniated sulfate properties were estimated for arbitary ammonium-to-sulfate molar ratio, B, by linear interpolation between the properties of sulfuric acid (H2SO4; B = 0) and ammonium sulfate ((NH4)2SO4; B = 2). For example, density was calculated as:
Other properties calculated in this manner include the component conversion factor (CCF), molecular weight (M), and partial molar refraction (R). HEADS-measured B varied from 0.60 to 2.17 over the course of the study.
The refractive index of dry ammoniated sulfate refractive index was calculated using the molar refraction approach outlined by CitationStelson (1990) and exemplified by Equations (11)–(13). The properties n, R, V were all modeled as functions of B. The partial molar volume is given by V = M/ρ. lists the values of B, CCF, ρ, M, V, R used for calculating n at ∼ 0% RH. Sulfuric acid and ammonium sulfate properties were obtained from various sources in the literature and were interpolated to derive NH4HSO4 (ammonium bisulfate) and (NH4)3H(SO4)2(letovicite) properties. Overall, the agreement between modeled and literature values of dry ammoniated sulfate indices is acceptable for these modeling purposes.
TABLE 5 Properties used for modeling refractive index of dry (∼ 0% RH) ammoniated sulfate. Properties of ammonium bisulfate and letovicite were determined from interpolation of sulfuric acid and ammonium sulfate properties, where the ammonium-to-sulfate molar ratio, B, is the dependent variable. Values of R and n are for λ = 488 nm unless indicated otherwise
The estimate of water content associated with sulfate species involves the method of Zdanovskii-Stokes-Robinson (ZSR) for multicomponent solutions (CitationStokes and Robinson, 1966). The method was applied to the H2SO4– (NH4)2SO4– H2O system by dividing it into three ternary mixture subdomains corresponding to B = 0–1.0, B = 1.0–1.5, and B = 1.5–2.0. We used the binary mixture water activity data of CitationTang and Munkelwitz (1994) for NH4HSO4, (NH4)3H(SO4)2, and (NH4)2SO4, which were measured for individual solution droplets using an electrodynamic balance technique. In that work, sulfate salt solution droplets were observed to reach metastable states of supersaturation when the water activity (same as RH for equilibrium) was decreased below the deliquescent point of each salt. For H2SO4, we used bulk solution water activities (Perry et al. 1984).
The modeling scheme for ammoniated sulfate refractive index is by no means perfect, but rather it is intended to reflect the variation of n as a function of acidity and humidity. Accurate quantitative prediction requires detailed thermodynamic modeling of the (NH4)2SO4-H2SO4-H2O system, as has been done by CitationStelson (1995). Our simple model does a fairly good job over the RH range of the wet measurements (44–76%) for B = 1 to 2. The agreement between the model and literature for ammonium bisulfate is good, with model-literature differences ranging from –0.007 to +0.016 for RH ranging from 2 to 100%. The model tends to over-predict n at lower RH values when B approaches a value of 2. Values are greatly under-predicted over the entire RH range for B approaching 0, since sulfuric acid properties are inherently different from those for B = 1–2. However, since the ammonium-to-sulfate ratio fell below B = 1 on only 8 out of the 42 study days and the lowest value for the study was B = 0.533 (August 18, 1995; JD 230), the overall discrepancy between actual and modeled indices is not expected to be great. Individual discrepancies do not significantly impact the results of this work, since the emphasis is on measured refractive indices and inference of a few key particle properties based on overall comparisons of modeled and measured refractive indices.
Comparison Results
In this section, we compare real refractive indices obtained from modeling, as described above, to size- and RH-dependent indices obtained from DAWN-A multiangle light scattering measurements. These comparisons allow us to draw important conclusions about atmospheric particles measured during SEAVS.
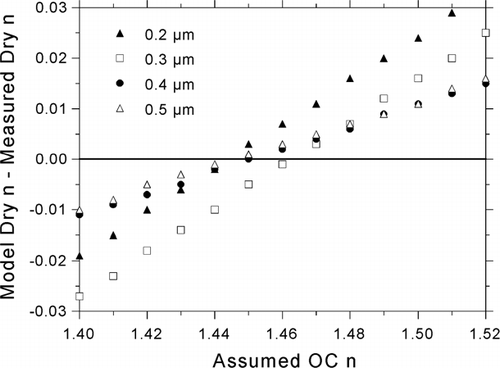
An effective value of n was inferred for dry OC by analyzing the agreement between modeled and measured dry indices as a function of assumed dry OC n. The dependence of the agreement on OC content was sufficiently consistent with regard to particle size to yield a size- and study-average refractive index for organics at low RH. This is fortunate because our lack of knowledge about the makeup of the organic particle fraction prevented us from modeling the associated optical properties. Differences between modeled and measured indices, averaged for all measurements over the course of the study, are plotted as a function of the assumed value of dry OC n in . We define the difference Δ n = (modeled n) – (measured n), with reference to the dry state in the current discussion, and the wet or dry state in subsequent discussions. This figure shows the remarkable consistency of the effect of modeled OC n among different particle sizes. Average size-dependent differences converge to Δ n = 0 for OC n = 1.45.
Differences were also analyzed as a function of organic carbon content (OC/SO4 mass ratio) for D p = 0.2–0.5 μ m (MOUDI stages 5 and 6). A value of n = 1.47 appeared to provide the best convergence about Δ n = 0 as OC content increased. The difference between modeled and measured dry indices ranged from roughly −0.04 to 0.05 on high sulfate days and converged to about ± 0.02 for days with higher OC content.
A compromise value of n = 1.46 for dry organics has been assumed for modeled values of the real refractive index presented herein. This value is lower than values such as 1.55 historically assumed for OC in visibility modeling calculations, (e.g., CitationSloane and Wolff 1985; CitationZhang et al. 1994). CitationZhang (1990) found that decreasing the value of OC n from 1.55 to 1.46 in visibility modeling calculations of Los Angeles aerosols resulted in a 5% decrease in total scattering and a 25% decrease in the scattering efficiency of OC, on average.
The effect of assumed OC mass on the inferred study-average value of dry OC n was investigated because substantial discrepancies in OC mass were observed between datasets from the MOUDI impactor and two quartz filter sampler designs operated during SEAVS (CitationSaxena et al. 1998). Refractive indices were modeled as previously described with MOUDI OC mass values doubled. DAWN-A measurements were inverted for n using values of k calculated for this alternative chemistry. Water activities derived from the OC mass-doubling assumption (CitationDick et al. 2000) were employed in the model. A dry OC refractive index of n = 1.47 was found to provide the best agreement of modeled and measured dry n (analogous to ), while n = 1.48 yielded the best convergence with increasing OC content. The effect of OC density was studied in the same manner for two assumed density values: 1.4g/cm3 and 1.0 g/cm3. Inferred values of dry OC n did not change with assumed OC density.
FIG. 9 Study-average dry Δ n values resulting from variation of dry OC n. The size-average of these values is minimized for OC n = 1.45 (average Δ n = −0.0003 among the sizes shown).
The assignment of a single value for all organic species sampled during the course of the study for the range of particle size modeled is a considerable simplification. Furthermore, the uncertainty in the representative value of n = 1.46 for dry organics is at least ± 0.02, which is the uncertainty estimated for refractive index retrieval based upon analysis of calibration particle measurements. There are several potential sources of additional uncertainty attributable to the model. The modeled species (in their assumed compound forms) do not account for the entire sampled aerosol mass. The impact of these unidentified compounds on modeled values has not been quantified. For the species that are known (ammonium, sulfate, EC), the respective mass measurements have associated uncertainties and the modeled species refractive indices have finite errors. Modeled values are based upon analysis of 12-hour samples, whereas DAWN-A measurements were made twice a day for time durations on the orders of minutes; diurnal variations in chemical composition add to the uncertainty. The assumption of species volume-average mixing may also contribute to the overall modeling uncertainty.
Study-averaged refractive index measurements are compared to average modeled values as a function of particle size for dry particles (RH = 4–10%) in and for wet particles (RH = 44–76%) in . As described above, volume-average values of the imaginary component k of the refractive index were derived from MOUDI measurements of black carbon and used for Mie-theory inversions of the real component values n. Assumed values of k for wet particles were about half of the respective values for dry particles, on average, due to the dilution effect of water. For modeling of dry indices, water content was estimated using TDMA data (CitationDick et al. 2000). Dry n was observed to be very consistent with respect to size (0.2 to 0.5 μ m), with a size- and study-averaged value of 1.494 and a size-averaged standard deviation of 0.018. The average difference Δ n between measured and modeled values was observed to be less than 0.01 for all sizes as a result of assuming n = 1.46 for dry organics.
TABLE 6 Size-dependent, study-averaged real refractive indices n measured at RH = 4–10% (dry) and results from comparison with modeled values. Assumed properties for dry organics are ρ = 1.4 and n = 1.46
TABLE 7 Size-dependent, study-averaged real refractive indices measured at RH = 44–76% (wet) and results from comparison with modeled values. Assumed properties for dry organics are ρ = 1.4 and n = 1.46
In , modeled values are compared to measured values for three different approaches to estimating water content. Wet n values are significantly lower than dry n values, due to appreciable gains in water content, with a size—and study-averaged value of 1.415 for D p = 0.2–0.5 μ m and a size-averaged standard deviation of 0.022. Measurements of 0.6-, 0.7-, and 0.8-μ m particles were not included in the average because they were not made for the whole duration of the study that measurements at smaller sizes were made. Most 0.6-μ m and all 0.7-μ m and 0.8-μ m measurements were made during and just prior to the hazy period (August 8–20, 1995; Julian dates 220–232).
The water content estimates may be evaluated, in terms of their reconciliation between measured and modeled indices, by comparing listed values of wet Δ n and the coefficient of correlation R between model and measurement listed in . The three estimation methods are indicated by the following subscripts: T for water content from TDMA RH-dependent particle growth measurements, I for the ZSR method applied to inorganic salts of ammonium and sulfate, and I+O for the sum of inorganic-associated water content and organic-associated water described by CitationDick et al. (2000) assuming an average density of ρ = 1.4 for organics.
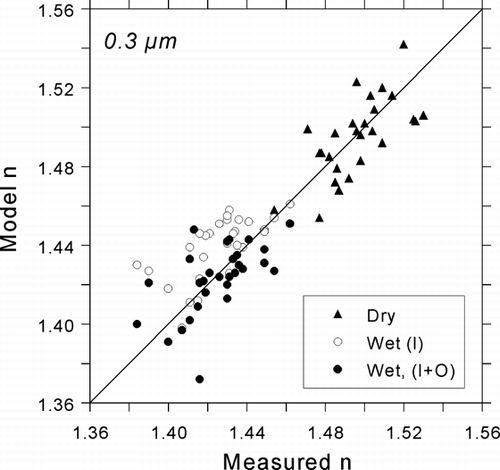
TDMA-derived water content values are generally lower than the corresponding calculations of supersaturated inorganic-associated water, resulting in noticeably higher modeled indices. The low water content values from the TDMA are presumed to be the result of measurement of the crystalline branch of sulfate hydration (CitationDick et al. 2000). When model-measured differences are averaged over the range D p = 0.2–0.5 μ m, we obtain Δ n = 0.030 for the TDMA model and Δ n = 0.018 for the inorganic water model. Better agreement between modeled and measured refractive index is obtained when the modeled contribution of organic carbon to water content (CitationDick et al. 2000) is added to the contribution of supersaturated sulfate, resulting in an average Δ n of only 0.006. Review of the respective correlation coefficients in reveals that the organic water and inorganic water sum (I+O) yields a coefficient that is twice as great as that for the TDMA model (T). The increase in the coefficient by the addition of organic water, i.e., the difference between I+O and I coefficients, is not statistically significant. However, we argue that a qualitative improvement in the agreement is evident in the scatter plot comparison of modeled and measured refractive indices in when organic water is added.
FIG. 10 Comparison of modeled refractive indices with atmospheric refractive indices measured by the DAWN-A during SEAVS for D p = 0.3 μ m. Two estimates of water content are compared for wet indices: thermodynamically predicted water associated with supersaturated ammoniated sulfates (I; inorganic contribution), and the sum of the inorganic contribution and water content associated with organics (I+O).
The incorporation of organics-associated water, derived from analyses of TDMA and MOUDI data (CitationDick et al. 2000), arguably produces the best agreement between modeled indices and DAWN-A measurements. This effect becomes more pronounced as particle size decreases, which correlates with an increase in organic content. For larger sizes, the bulk of the difference between water content measured directly by the TDMA and indirectly by the DAWN-A appears to be represented by the hysteresis in hydration of the sulfate compounds. While the TDMA appears to have measured the deliquescent branch for sulfate, the DAWN-A appears to have measured the efflorescent branch.
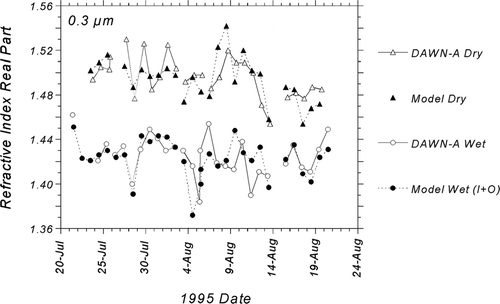
The striking agreement between DAWN-A measured indices and values modeled using the sum of water content contributions from supersaturated sulfates and organics is revealed in the time series of . In this plot, the differences between wet and dry indices, the study-average of which was about 0.07 for 0.3 μ m, are readily apparent. The time series demonstrates that the DAWN-A was able to capture small temporal variations in both wet and dry refractive index. Agreement is particularly strong for wet indices for the first half of the study from July 21 (JD 202) through August 3 (JD 215). From August 3 to 5 (JD 215–217), Hurricane Erin directly influenced meteorology at the site, producing exceptionally high visibility accompanied by variable winds. At this point, sizable discrepancies can be observed between the DAWN-A and the model that might be attributed to frequent and unpredictable changes in aerosol source and composition that could not be differentiated with 12-hour chemistry measurements. By the beginning of the hazy period, sometime around August 12 (JD 224), the agreement recovered with a few minor discrepancies noted for highly acidic days such as August 17 and 18 (JD 229 and 230). We may have underestimated sulfate refractive index on these acidic, sulfate-dominated days by as much as 0.03 for dry values and 0.02 for wet values.
FIG. 11 Time-series comparisons of modeled refractive indices with atmospheric refractive indices measured by the DAWN-A during SEAVS for D p = 0.3 μ m. For wet indices, modeled water content includes contributions from both inorganic and organic aerosol fractions (I+O).
SUMMARY AND CONCLUSIONS
Size- and RH-dependent refractive indices of submicron atmospheric particles were measured with the DAWN-A multiangle light scattering (MLS) detector during the SEAVS visibility study. The real part of the complex refractive index, n, was obtained for D p = 0.2−0.8 μ m by comparing Lorenz-Mie theory to calibrated multi-angle response to scattered light intensities measured at seven discrete polar angles ranging from 40 to 140 degrees. The effect of light absorption by elemental carbon on angular light scattering was considered in the inversion for real refractive index by assigning the imaginary component based on the measured amount of elemental carbon. Size-dependent detector calibrations were derived from an extensive set of laboratory measurements of model particles with n ranging from 1.38 to 1.61 and from measurements of DOS (n = 1.45) made every other day during the study. Based on inversions of the laboratory data and light-absorbing calibration particles measured in the field, we estimate an uncertainty in measured n of ± 0.02.
Measured atmospheric refractive index was found to be highly sensitive to relative humidity with an average difference between wet (RH = 44–76%) and dry (RH = 4–10%) indices of 0.08 for the size range 0.2–0.5 μ m. Refractive index was relatively constant with respect to size, with a study-average dry n = 1.494 over the size range 0.2–0.5 μ m, and an average wet value of 1.415. The lowest value (wet) measured during the study was 1.335, which is very close to the physical bound imposed by water (n = 1.337 at λ = 488 nm), while the highest measured value (dry) of 1.541 was close to the expected maximum of n = 1.531 corresponding to crystalline ammonium sulfate.
Refractive indices were modeled with particle chemistry measured with MOUDI cascade impactors and were compared to measured indices in our efforts to develop an accurate aerosol model for visibility calculations. A value of n = 1.47 was inferred for organic carbon by minimizing the discrepancy between modeled and measured dry refractive index n for high ratios of organics-to-inorganics for D p = 0.2−0.5 μ m. A value of n = 1.45 for OC provided better agreement between modeled and measured dry indices for the entire range of OC content, so a compromise value of n = 1.46 was used for wet and dry refractive index modeling. Using this value, the study-averaged differences in dry n ranged from −0.001 to 0.007 over the range D p = 0.2 to 0.5 μ m.
We estimated water content using three methods and evaluated the effectiveness of each method through comparisons of modeled and measured indices. The best agreement for wet indices was obtained by summing estimated contributions of the inorganic and organic aerosol fractions to water content. With this water content estimate, wet n study-averaged differences ranged from –0.013 to 0.016 for D p = 0.2 to 0.8 μ m. The inorganic water component was estimated using water activity data for bulk sulfuric acid and for supersaturated droplets of ammoniated sulfate in conjunction with the Zdanovskii-Stokes-Robinson (ZSR) method for multicomponent solutions. Water activity curves were derived for organic carbon from TDMA and MOUDI datasets (CitationDick et al. 2000), providing us with an estimate of the organic-associated water component. The DAWN-A measurements therefore provide remarkable closure on the issue of water uptake by atmospheric organics.
In conclusion, MLS can yield important information on atmospheric particle properties. Our previous work demonstrated that MLS can distinguish between spherical and nonspherical submicron particles with great certainty. In this study, we showed that MLS can determine the refractive index of the spherical fraction of a monodispersion of particles with good resolution. Conversely, the agreement achieved between MLS measurements of refractive indices and modeled values suggests that our modeling approach can be used, with careful consideration of the limitations imposed by the model, to calculate values of n for atmospheric aerosols similar in composition to those sampled during SEAVS.
Acknowledgments
This research was supported by the Electric Power Research Institute (Grant No. W09116-08/W04105-01). The DAWN-A detector used for these measurements was made available to us through a Memorandum of Agreement with the U.S. Bureau of Mines Pittsburgh Research Center. We would like to thank Prof. Maurice Kreevoy of the University of Minnesota Chemistry Department and William Sebo for their assistance in creating DPS solutions. The authors would also like to thank the reviewers for their helpful, constructive comments.
Notes
a Perry's Chemical Engineer's Handbook (Perry et al. 1984).
b CRC, 63rd ed. (Weast, 1982–1983), p. B-78. λ = 590 nm.
c International Critical Tables (CitationMerwin, 1930), p. 19.
Related Research Data
REFERENCES
- Anderson , T. L. , Covert , D. S. , Marshall , S. F. , Laucks , M. L. , Charlson , R. J. , Waggoner , A. P. , Ogren , J. A. , Caldow , R. , Holm , R. L. , Quant , F. R. , Sem , G. J. , Wiedensohler , A. , Ahlquist , N. A. and Bates , T. S. 1996 . Performance Characteristics of a High-Sensitivity, Three Wavelength, Total Scatter/Backscatter Nephelometer . J. Atmos. Oceanic Technol. , 13 : 967 – 986 .
- Batten , C. E. 1985 . Spectral Optical Constants of Soots from Polarized Angular Reflectance Measurements . Appl. Opt. , 24 ( 8 ) : 1193 – 1199 .
- Bauer , N. and Fajan , K. 1942 . The Molar Dispersion and Refraction of Free and Bonded Ions . J. Am. Chem. Soc. , 64 : 3023 – 3034 .
- Baumgardner , D. , Dye , J. E. , Gandrud , B. , Barr , K. , Kelly , K. and Chan , K. R. 1996 . Refractive Indices of Aerosols in the Upper Troposphere and Lower Stratosphere . Geophys. Res. Letters , 23 ( 7 ) : 749 – 752 .
- Bergstrom , R. W. 1972 . Predictions of the Spectral Absorption and Extinction Coefficients of an Urban Air Pollution Aerosol Model . Atmos. Environ. , 6 : 247 – 258 .
- Bevington , P. R. and Robinson , D. K. 1992 . Data Reduction and Error Analysis for the Physical Sciences. , 2nd ed. , New York : McGraw-Hill .
- Bohren , C. F. and Huffman , D. R. 1983 . Absorption and Scattering of Light by Small Particles. , 1st ed. , New York : John Wiley .
- Charlson , R. J. 1972 . Multiwavelength Nephelometer Measurements in Los Angeles . J. Colloid Interface Sci. , 39 : 240 – 241 .
- Charlson , R. J. , Schwartz , S. E. , Hales , J. M. , Cess , R. D. , Coakley , J. J. A. , Hansen , J. E. and Hofmann , D. J. 1992 . Climate Forcing by Anthropogenic Aerosols . Science , 255 : 423 – 430 .
- Chéneveau , C. 1930 . “ Refractivity of Selected Solids and Liquids ” . In International Critical Tables of Numerical Data Physics, Chemistry and Technology , Edited by: Washburn , E. W. , West , C. J. , Dorsey , N. E. and Ring , M. D. 12 – 15 . New York : McGraw-Hill .
- Covert , D. S. , Charlson , R. J. and Ahlquist , N. C. 1972 . A Study of the Relationship of Chemical Composition and Humidity to Light Scattering by Aerosols . Journal of Applied Meteorology , 11 : 968 – 986 .
- Dalzell , W. H. and Sarofim , A. F. 1969 . Optical Constants of Soot and Their Application to Heat-Flux Calculations . J. Heat Transfer , 91 : 100 – 104 .
- Day , D. E. , Malm , W. C. and Kredienweis , S. M. 2000 . Aerosol Light Scattering Measurements as a Function of Relative Humidity . J. Air Waste Manage. Assoc. , 50 : 710 – 716 .
- Dick , W. D. , McMurry , P. H. and Bottiger , J. R. 1994 . Size- and Composition-Dependent Response of the DAWN-A Multiangle Single-Particle Optical Detector . Aerosol Sci. Tech. , 20 : 345 – 362 .
- Dick , W. D. , Sachweh , B. A. and McMurry , P. H. 1996 . Distinction of Coal Dust Particles from Liquid Droplets by Variations in Azimuthal Light Scattering . Appl. Occup. Environment. Hyg. , 11 ( 7 ) : 637 – 645 .
- Dick , W. D. 1998 . Multiangle Light Scattering Techniques for Measuring Shape and Refractive Index of Submicron Atmospheric Particles , Ph.D. Thesis Minneapolis : University of Minnesota .
- Dick , W. D. , Ziemann , P. J. , Huang , P. F. and McMurry , P. H. 1998 . Optical Shape Fraction Measurements of Submicrometre Laboratory and Atmospheric Aerosols . Meas. Sci. Tech. , 9 ( 2 ) : 183 – 196 .
- Dick , W. D. , Saxena , P. and McMurry , P. H. 2000 . Estimation of Water Uptake by Organic Compounds in Submicron Aerosols Measured During the Southeastern Aerosol and Visibility Study . J. Geophys. Res. , 105 ( D1 ) : 1471 – 1479 .
- Gerten , A. L. and McMurry , P. H. 1996 . Southeastern Aerosol and Visibility Study (SEAVS): TDMA Data , Minneapolis : University of Minnesota . Report to the Electric Power Research Institute
- Gray , D. E. , ed. 1982 . American Institute of Physics Handbook , New York : McGraw-Hill .
- Hand , J. L. and Kreidenweis , S. M. 2002 . A New Method for Retrieving Particle Refractive Index and Effective Density from Aerosol Size Distribution Data . Aerosol Sci. Technol. , 36 : 1012 – 1026 .
- Hand , J. L. , Kreidenweis , S. M. , Eli Sherman , D. , Collet , J. L. Jr. , Hering , S. V. , Day , D. E. and Malm , W. C. 2002a . Aerosol Size Distributions And Visibility Estimates During the Big Bend Regional Aerosol and Visibility Observational (BRAVO) Study . Atmos. Environ. , 36 : 5043 – 5055 .
- Hand , J. L. , Kreidenweis , S. M. , Kreisberg , N. , Hering , S. , Stolzenburg , M. , Dick , W. and McMurry , P. H. 2002b . Comparisons of Aerosol Properties Measured by Impactors and Light Scattering from Individual Particles: Refractive Index, Number and Volume Concentrations, and Size Distributions . Atmos. Environ. , 36 : 1853 – 1861 .
- Hirst , E. , Kaye , P. H. and Guppy , J. R. 1994 . Light Scattering from Nonspherical Airborne Particles: Experimental and Theoretical Comparisons . Appl. Opt. , 33 : 7180 – 7186 .
- Janzen , J. 1979 . The Refractive Index of Colloidal Carbon . J. Colloid Interface Sci. , 69 ( 3 ) : 436 – 447 .
- Jones , M. R. , Leong , K. H. , Brewster , M. Q. and Curry , B. P. 1994 . Inversion of Light-Scattering Measurements for Particle Size and Optical Constants: Experimental Study . Appl. Opt. , 33 ( 18 ) : 4035 – 4041 .
- Kaye , P. H. , Alexander-Buckley , K. , Hirst , E. and Saunders , S. 1996 . A Real-Time Monitoring System for Airborne Particle Shape and Size Analysis . J. Geophys. Res. , 101 ( D14 ) : 19215 – 19221 .
- Kerker , M. 1969 . The Scattering of Light and Other Electromagnetic Radiation , New York : Academic Press .
- Knutson , E. O. and Whitby , K. T. 1975 . Aerosol Classification by Electric Mobility: Apparatus, Theory, and Applications . J. Aerosol Sci. , 6 : 443 – 451 .
- Kreisberg , N. M. , Stolzenburg , M. R. , Hering , S. V. , Dick , W. D. and McMurry , P. H. 2001 . A New Method for Measuring the Dependence of Particle Size Distributions on Relative Humidity, with Application to the Southeastern Aerosol and Visibility Study . J. Geophys. Res. , 106 ( D14 ) : 14935 – 14949 .
- Kruis , A. and Geffcken , W. 1936 . Die Äquivalent Dispersion von Starken Elektrolyten in Lösung II. Die Physikalische Deutung der Beobachteten Effekte . Z. Physik. Chem. , B34 : 51 – 69 .
- Liu , B. Y. H. and Pui , D. Y. H. 1974 . A Submicron Aerosol Standard and the Primary, Absolute Calibration of the Condensation Nuclei Counter . J. Colloid Interface Sci. , 47 ( 1 ) : 155 – 171 .
- Lorenz , L. 1898 . Oeuvres Scientifiques Copenhagen
- Marple , V. A. , Rubow , K. L. and Behm , S. M. 1991 . A Microorifice Uniform Deposit Impactor (MOUDI): Description, Calibration, and Use . Aerosol Sci. Tech. , 14 : 434 – 446 .
- McMurry , P. H. and Stolzenburg , M. R. 1989 . On The Sensitivity of Particle Size to Relative Humidity for Los Angeles Aerosols . Atmos. Environ. , 23 ( 2 ) : 497 – 507 .
- McMurry , P. H. , Zhang , X. and Lee , C. T. 1996 . Issues in Aerosol Measurement for Optics Assessments . J. Geophys. Res. , 101 ( D14 ) : 19,189 – 19,917 .
- Merwin , H. E. 1930 . “ Refractivity of Birefringent Crystals ” . In International Critical Tables of Numerical Data Physics, Chemistry and Technology , Edited by: Washburn , E. W. , West , C. J. , Dorsey , N. E. and Ring , M. D. 16 New York : McGraw-Hill .
- Mie , G. 1908 . Considerations on the Optics of Turbid Media, Especially Colloidal Metal Sols . Ann. Physik , 25 : 377 – 445 .
- Moelwyn-Hughes , E. A. 1961 . Physical Chemistry, , 2nd rev. ed. , New York : Pergamon Press .
- Mueller , P. K. , Fung , K. K. , Heisler , S. L. , Grosjean , D. and Hidy , G. M. 1982 . “ Atmospheric Particulate Carbon Observations in Urban and Rural Areas of the United States ” . In Particulate Carbon-Atmospheric Life Cycle , Edited by: Wolff , C. T. and Klimisch , R. L. 343 – 370 . New York : Plenum Press .
- Park , K. , Kittelson , D. B. , Zachariah , M. R. and McMurry , P. H. 2004 . Measurement of Inherent Material Density of Nanoparticle Agglomerates . J. Nanoparticle Res. , 6 : 267 – 272 .
- Perry , K. D. , Cahill , T. A. , Eldred , R. A. and Dutcher , D. D. 1997 . Long-Range Transport of North African Dust to the Eastern United States . J. Geophys. Res. , 102 ( D10 ) : 11225 – 11238 .
- Perry , R. H. , Green , D. W. and Maloney , J. O. , eds. 1984 . Perry's Chemical Engineer's Handbook , New York : McGraw-Hill .
- Pluchino , A. B. , Goldberg , S. S. , Dowling , J. M. and Randall , C. M. 1980 . Refractive-Index Measurements of Single Micron-Sized Carbon Particles . Appl. Opt. , 19 ( 19 ) : 3370 – 3372 .
- Quist , G. M. and Wyatt , P. J. 1985 . Empirical Solution to the Inverse-Scattering Problem by the Optical Strip-Map Technique . J. Opt. Soc. Am. , A2 ( 11 ) : 1979 – 1986 .
- Roessler , D. R. and Faxvog , F. R. 1979 . Optoacoustic Measurement of Optical Absorption in Acetylene Smoke . J. Opt. Soc. Am. , 69 ( 12 ) : 1699 – 1704 .
- Rood , M. J. , Larson , T. V. , Covert , D. S. and Ahlquist , N. C. 1985 . Measurement of Laboratory and Ambient Aerosols with Temperature and Humidity Controlled Nephelometry . Atmos. Environ. , 19 ( 7 ) : 1181 – 1190 .
- Sachweh , B. 1993 . Measurement of Size, Number Concentration and Velocity of Aerosol Particles Using an Aerosol Particle Counter . Part. Part. Syst. Charact. , 10 : 56 – 61 .
- Sachweh , B. A. , Dick , W. D. and McMurry , P. H. 1995 . Distinguishing Between Spherical and Nonspherical Particles by Measuring the Variability in Azimuthal Light Scattering . Aerosol Sci. Tech. , 23 : 373 – 391 .
- Saxena , P. and Hildemann , L. M. 1996 . Water-Soluble Organics in Atmospheric Particles: A Critical Review of the Literature and Application of Thermodynamics to Identify Candidate Compounds . J. Atmos. Chem. , 24 : 57 – 109 .
- Saxena , P. , Hildemann , L. M. , McMurry , P. H. and Seinfeld , J. H. 1995 . Organics Alter Hygroscopic Behavior of Atmospheric Particles . J. Geophys. Res. , 100 ( D9 ) : 18,755 – 18,770 .
- Saxena , P. , Andrews , E. and Musarra , S. 1998 . Southeastern Aerosol and Visibility Study (SEAVS): Concentration and Composition of Atmospheric Aerosols at Look Rock, Tennessee, July–August 1995 , Palo Alto, California : Electric Power Research Institute . Topical Report No. TR-111063
- Sloane , C. S. and Wolff , G. T. 1985 . Prediction of Ambient Light Scattering Using a Physical Model Responsive to Relative Humidity: Validation with Measurements from Detroit . Atmos. Environ. , 19 ( 4 ) : 669 – 680 .
- Stelson , A. W. 1990 . Urban Aerosol Refractive Index Prediction by Partial Molar Refraction Approach . Environ. Sci. Tech. , 24 : 1676 – 1679 .
- Stelson , A. W. 1995 . Thermodynamics of the Acidic (NH4)2SO4-H2SO4-H2O System at ∼ 25°C . Aerosol Sci. Tech. , 23 : 392 – 400 .
- Stokes , R. H. and Robinson , R. A. 1966 . Interactions in Aqueous Nonelectrolyte Solutions. I. Solute-Solvent Equilbria . J. Phys. Chem. , 70 ( 7 ) : 2126 – 2131 .
- Szymanski , W. W. , Nagy , A. , Czitrovszky , A. and Jani , P. 2002 . A New Method for the Simultaneous Measurement of Aerosol Particle Size, Complex Refractive Index and Particle Density . Meas. Sci. Technol. , 13 : 303 – 307 .
- Tang , I. N. and Munkelwitz , H. R. 1994 . Water Activities, Densities, and Refractive Indices of Aqueous Sulfates and Sodium Nitrate Droplets of Atmospheric Importance . J. Geophys. Res. , 99 ( D9 ) : 18,801 – 18,808 .
- Vasiliou , J. G. and McMurry , P. H. 1996 . Southeastern Aerosol Visibility Study (SEAVS): MOUDI Data , Minneapolis : University of Minnesota . Report to the Electric Power Research Institute
- Vasiliou , J. G. , Sorensen , D. and McMurry , P. H. 1999 . Sampling at Controlled Relative Humidity with a Cascade Impactor . Atmos. Environ. , 33 ( 7 ) : 1049 – 1056 .
- Weast , R. C. , ed. 1982–1983 . CRC Handbook of Chemistry and Physics , Boca Raton, Florida : CRC Press .
- White , W. H. 1986 . On the Theoretical and Empirical Basis for Apportioning Extinction by Aerosols: A Critical Review . Atmos. Environ. , 20 ( 9 ) : 1659 – 1672 .
- Wyatt , P. J. , Schehrer , K. L. , Phillips , S. D. , Jackson , C. , Chang , Y. J. , Parker , R. G. , Phillips , D. T. and Bottiger , J. R. 1988 . Aerosol Particle Analyzer . Appl. Opt. , 27 ( 2 ) : 217 – 221 .
- Zhang , X. , Turpin , B. J. , McMurry , P. H. , Hering , S. V. and Stolzenburg , M. R. 1994 . Mie Theory Evaluation of Species Contributions to 1990 Wintertime Visibility Reduction in the Grand Canyon . Air & Waste Manage. Assoc. , 44 : 153 – 162 .
- Zhang , X. Q. 1990 . Measurements of Size Resolved Atmospheric Aerosol Chemical Composition with Impactors: Data Integrity and Applications , Ph.D. thesis Minneapolis : University of Minnesota .
- Zhao , F. , Gong , Z. , Hu , H. , Tanaka , M. and Hayasaka , T. 1997 . Simultaneous Determination of the Aerosol Complex Index of Refraction and Size Distribution from Scattering Measurements of Polarized Light . Appl. Opt. , 36 ( 30 ) : 7992 – 8001 .
- Zhao , F. 1999 . Determination of the Complex Index of Refraction and Size Distribution of Aerosol from Polar Nephelometer Measurements . Appl. Opt. , 38 ( 12 ) : 2331 – 2336 .