Abstract
Two pressure-controlled inlets (PCI) have been designed and integrated into the Aerodyne Aerosol Mass Spectrometer (AMS) inlet system containing an aerodynamic aerosol lens system for use in airborne measurements. Laboratory experiments show that size calibration and mass flow rate into the AMS are not affected by changes in upstream pressure (P 0 ) of the PCI as long as the pressure within the PCI chamber (P PCI ) is controlled to values lower than P 0 . Numerous experiments were conducted at different P PCI , P 0 , and AMS lens pressures (P Lens ) to determine particle transmission efficiency into the AMS. Based on the results, optimum operating conditions were selected which allow for constant pressure sampling with close to 100% transmission efficiency of particles in the size range of ∼ 100–700 nm vacuum aerodynamic diameter (d va ) at altitudes up to ∼ 6.5 km. Data from an airborne field study are presented for illustration.
INTRODUCTION
Aerosols have gained much interest in recent years due to their effects of deteriorating visibility, air quality, and human health, as well as their direct and indirect effects on climate. Efforts to understand the different processes that lead to formation and growth of aerosols have involved ambient measurements of physical and chemical properties of aerosols and their precursors. To meet this challenge, several new aerosol instruments have been developed that utilize aerodynamic lenses in order to focus particles in the sampled air into a narrow beam before detection using mass spectrometry (CitationSchreiner et al. 1998; CitationSchreiner et al. 1999; CitationTobias and Ziemann 1999; CitationJayne et al. 2000; CitationSu et al. 2004; CitationZelenyuk and Imre 2005; CitationMurphy 2007). These lenses also have the potential to be used in other particle measurement techniques such as optical particle sizing. The operating pressure in all such lenses is lower than atmospheric, most commonly ∼ 2 mbar (CitationLiu et al. 1995a; CitationLiu et al. 1995b). Many of these aerosol instruments are being used in airborne studies in the troposphere where the ambient pressure decreases as a function of altitude but remains much above the lens operating pressure.
The Aerodyne Aerosol Mass Spectrometer (AMS) is one such instrument that uses a Liu-type aerodynamic lens. The AMS provides quantitative and size-resolved information about non-refractory composition of aerosols, and has been utilized in multiple ground based and airborne measurements (CitationJayne et al. 2000; CitationBahreini et al. 2003; CitationJimenez et al. 2003; CitationDrewnick et al. 2005; CitationDeCarlo et al. 2006). The standard AMS inlet system consists of a 100 μ m diameter critical orifice (COdown) upstream of the aerodynamic lens, that reduces the inlet pressure of the aerodynamic lens to ∼ 2 mbar when sampling at sea level pressure (1013 mbar), and an aerodynamic lens system to focus the particles into a beam (CitationLiu et al. 1995a; CitationLiu et al. 1995b). Particle transmission through the AMS standard inlet at sea level is ∼ 100% for sizes between 100–150 nm to 400–600 nm in vacuum aerodynamic diameter (d va ), depending on the specific lens used (CitationJayne et al. 2000; CitationLiu et al. 2007). Since the pressure drop across COdown is more than a factor of two, the orifice operates under critical, or choked, conditions with a constant volumetric flow rate. The nozzle at the end of the aerodynamic lens acts as a second critical orifice, setting the pressure in the lens as a function of the mass flow rate entering it. When the pressure upstream of the COdown changes, the mass flow rate varies with air density, which leads to changes in lens pressure, and thus in particle velocity and transmission efficiencies (CitationZhang et al. 2002; CitationBahreini et al. 2003). With laboratory calibrations of these effects, the data can be corrected in post-processing (CitationBahreini et al. 2003), but the differences in particle transmission can be large, especially at the upper end of the particle size range and difficult to calibrate for. A pressure controlled inlet (PCI) that maintains a constant pressure upstream of the lens with varying sampling pressure conditions could improve quantification of airborne measurements with an AMS.
Controlling the inlet pressure for aerosol measurements is not as straightforward as for gas phase measurements due to particle inertia. Lee and co-workers (1993) developed a sampling inlet that allows particles contained in high-pressure gases to equilibrate to the ambient flow conditions at atmospheric pressure before being extracted with high efficiency by a sampling probe. In this article we discuss the design and airborne application of two PCI models, based on the design of CitationLee et al. (1993), with the AMS.
PCI DESIGN
There are two versions of the PCI that were designed, built, characterized in the laboratory, and used in airborne field studies. Both designs are similar in theory to the University of Minnesota pressure reducer (CitationLee et al. 1993), where the inlet flow at an upstream pressure of P 0 expands from an orifice (COup) into a chamber with inner diameter D t (). Pressure within this chamber (P PCI) is feedback-controlled by variable pumping through side ports of the chamber. In our system, a pressure controlling valve (MKS 640A, MA) with digital readout (MKS PR4000, MA) regulates P PCI using a pump (Pfeiffer MVP 020-3AC, MA or Gast DOA-P104-AA, MI) to remove the excess flow. Particle concentration in the expansion chamber becomes uniform before the sampling flow is extracted at a distance L downstream through a tube with inner diameter D S . As suggested by CitationLee et al. (1993), for minimal deposition losses on the front side of COup, the orifice size (D O, up ) should be such that √St < 1, where stokes number (St) is defined as
FIG. 1 Schematic and main dimensions of the PCI- AMS inlet design. See text for definition of terms.
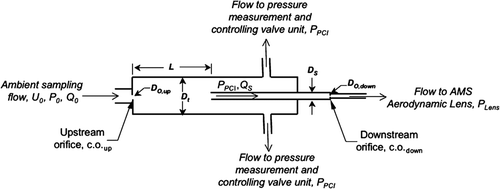
Main dimensions of both PCI designs are give in . PCI-I design was used with the Q-AMS (an AMS with a quadrupole mass spectrometer) aboard the NOAA WP-3D research aircraft for the 2004 New England Air Quality Study—Intercontinental Transport and Chemical Transformation (NEAQS-ITCT) field project. To minimize the residence time in the PCI, a smaller, second design (PCI-II) was later built and used in 2006 with a ToF-AMS (an AMS with Time-of-Flight mass spectrometers) instruments aboard the NSF/NCAR C-130 during the Megacity Initiative: Local and Global Research Observations (MILAGRO) and the 2006 Intercontinental Chemical Transport Experiment (INTEX-B) field studies, and aboard the NOAA WP-3D research aircraft during the Texas Air Quality Study/Gulf of Mexico Atmospheric Composition and Climate Study (TexAQS/GoMACCS) field campaign (CitationDrewnick et al. 2005; CitationDeCarlo et al. 2006). Since particle transmission within the AMS depends on the aerodynamic lens system used and the lens pressure rather than the type of detector used with the AMS (quadrupole vs. time-of-flight), for simplicity, we will not refer to the specific type of AMS used in the different experiments. The three different lenses used for these experiments have the same design with nominally similar transmission characteristics. However, slight variations in lens transmission without a PCI were observed and are discussed in the results section. Particle transmission through PCI-I and PCI-II, when detached from the AMS sampling inlet, was characterized by isokinetically introducing monodisperse ammonium nitrate particles in the size range of d va ∼ 95–620 nm into a particle counter (TSI CPC 3025-A, St. Paul, MN) and the PCI upstream of another particle counter (N-MASS [Brock et al. 2000] for tests with PCI-I and TSI CPC 3022-A for tests with PCI-II). Particle transmission through the PCI was determined to be close to 100% for submicron aerosols in this size range.
TABLE 1 Dimensions and operating parameters of the two PCI designs
EXPERIMENTAL
In order to characterize the performance of the PCI and AMS aerodynamic lens system, two types of particle experiments were performed: size calibrations and transmission efficiency. For these experiments, monodisperse particles were generated by atomizing a dilute solution of the desired species with a Collison atomizer (3076, TSI), drying the polydisperse particles by passing the flow through a diffusion drier filled with silica gel, and size selecting with a low-voltage Differential Mobility Analyzer—DMA (a custom design DMA, now produced as Model 2000c, Brechtel Mfg., Hayward, CA or a TSI SMPS 3936). The flow containing the monodisperse particles from the DMA was then divided through a flow splitter and sampled by a Condensation Particle Counter (CPC 3025A or CPC 3010, TSI) and by the AMS through the PCI. For PCI-I model, particle transmission tests were performed with dry, monodisperse di-(2-ethylhexyl) sebacate (DOS) particles, formed by atomizing a solution of DOS in isopropyl alcohol, then dried and sized as above, while polystyrene latex spheres (Duke Scientific, NC) were used for the size calibrations. For PCI-II model, all experiments were performed with ammonium nitrate particles, dried and sized as above.
Experiments were performed with both PCI designs while varying P PCI from 107–653 mbar. In these experiments, various sizes of COdown were used to allow for different lens pressures and to optimize the final operating conditions. In addition, experiments were performed at different P 0 in order to mimic airborne measurements and determine how particle transmission efficiency is affected when the PCI samples from pressures higher or lower than the chamber's set point. During the experiments with P 0 lower than that in Boulder, CO, i.e., ∼840 mbar, an additional critical orifice was used on the monodisperse flow out of the DMA, before the flow splitter.
Particle Size Calibrations
As particles are accelerated into the AMS vacuum system, their ultimate velocity is size dependent (CitationJayne et al. 2000). Velocity calibration curves are obtained by converting the particle time-of-flight into velocity for particles with a known size and composition. Size calibrations for the PCI-I model were performed with P 0 varying from 267–822 mbar, P PCI = 107 mbar, D O,down = 300 μ m, resulting in P Lens = 1.33 mbar and Q S = 1 STP cm3 s1. The calibrations for the PCI-II design were carried out under the conditions shown in . For the base cases, size calibrations were performed without the PCI and with the appropriate D O,down to obtain a similar P Lens as for the experiments with the PCI in place.
TABLE 2 Summary of operating conditions in experiments with PCI-II model. In all experiments, D O , up = 180 μ m
Particle Transmission Efficiency
The overall collection efficiency in the AMS system, CE(d va ), is defined as the ratio of the number (or mass) of particles detected by the AMS relative to the number (or mass) of particles introduced into the AMS inlet (CitationHuffman et al. 2005). There are three major factors affecting CE as a function of particle size (d va ): E L or particle transmission efficiency through the inlet/lens system, E S or the striking efficiency of the measured particles on the AMS vaporizer relative to spherical particles, and E b or the fraction of particles hitting the vaporizer that are vaporized which is reduced by particle bounce off of the vaporizer. Since ammonium nitrate or DOS particles are used for these experiments, E S and E b are equal to 1 (CitationHuffman et al. 2005; Matthew et al. Submitted). Hence a measurement of CE is equivalent to the particle transmission through the inlet/lens system, E L .
Here, particle transmission efficiency through the PCI and the aerodynamic lens inlet system, E L , as a function of particle size, d va , is calculated as the ratio of particles detected by the AMS to those detected by the CPC when both AMS and CPC isokinetically sample monodisperse particles (e.g., CitationLiu et al. 2007). For large enough particles, the number detected by the AMS is the number of particles counted as single particles. However, if the particles are small such that the mass of most of the individual particles does not generate a signal response large enough to cross the user-defined single-particle signal threshold, then the number of particles detected is calculated from the mass measured by the AMS. When sampling from a DMA, it is also possible to sample multiply charged particles that have the same mobility diameter as the singly charged particles but have a larger physical diameter. In these experiments, when size-selecting particles smaller than 300 nm, the number concentration of multiply charged particles was relatively small (1–12% depending on the size); yet they contributed to a significant fraction of the total mass (8–40% depending on the size). Therefore, when calculating E L for particles smaller than 300 nm, only the mass and number concentration of singly charged particles have been taken into account based on the signal fraction of the singly charged particles determined from the AMS mass distribution. The following formula is used to calculate the number of singly charged particles detected following the mass-based method:
RESULTS AND DISCUSSION
When the AMS samples from variable P 0 without a PCI, it effectively samples different mass flow rates. The internal standard of the instrument is the detected air ion signal (for nitrogen or oxygen), known as the “airbeam” (AB) (CitationAllan et al. 2003). The AB is the measured ion rate for nitrogen (or oxygen) in the difference signal (unblocked beam-blocked beam) and is the product of the number of nitrogen (or oxygen) molecules reaching the AMS detection region per unit time by their detection efficiency (ions detected per molecule reaching the ionization region). When sampling at constant pressure and temperature, the mass flow rate and the flux of air molecules into the system are constant and the AB should track only with changes in detection sensitivity. One will introduce an artifact if the AB measured at variable P 0 is used as the internal standard without correcting the effect of sampling pressure (CitationBahreini et al. 2003). As shown in for AMS airborne measurements during the 2006 TexAQS/GoMACCS study onboard the NOAA WP-3D aircraft using PCI-II, P PCI was well controlled (at 467 mbar) during a descent from 4.3 km to 0.8 km, corresponding to P 0 changes from 595 to 922 mbar. The constant pressure within the PCI chamber (P PCI) allowed for a constant lens pressure (P Lens ) in the AMS () and removed any pressure effects on the measured flow rate and the detected air signal to better than ± 2% (), and thus eliminated the need to correct the data for varying flow rate or airbeam signal. Plotted in are the measured and post-corrected air signal data points from a previous airborne measurement with an AMS (CitationBahreini et al. 2003) which did not incorporate a PCI on its inlet. After accounting for pressure effects, there still seem to be ± 10% random variation in the corrected air signal. With the PCI-I model maintained at P PCI = 107 mbar and operated in front of an AMS during the NEAQS-ITCT 2004 study, the mass flow rate varied within ± 2% and the AB varied within ± 10%.
FIG. 2 Ambient (P0), PCI chamber (PPCI), and lens pressures (PLens) throughout a descent (a) as well as “airbeam” signal and mass flow rate (QS) (b) during a research flight aboard NOAA WP-3D aircraft during the 2006 TexAQS/GoMACCS field campaign. Also plotted are measured and post-corrected airbeam signal (c) from a previous airborne measurement with an AMS without using the PCI.
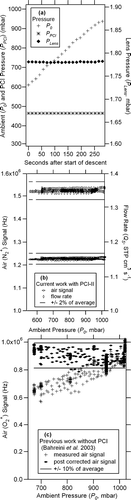
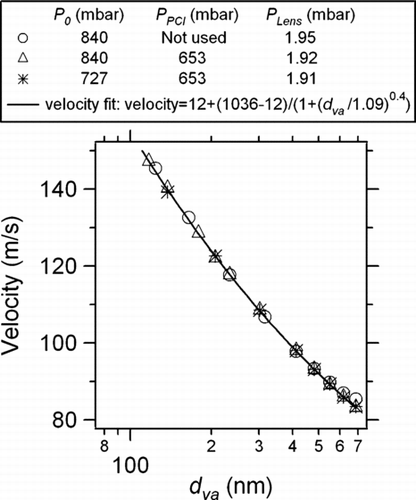
As mentioned previously, sampling from variable P 0 results in variable P Lens and therefore variable degrees of supersonic expansion from the nozzle at the end of the lens into the time-of-flight vacuum sizing chamber of the AMS. When the lens pressure is reduced, the expansion is less strong and particles reach a lower terminal velocity. Since particle size is inferred from the time particles take to travel through a fixed distance in the sizing chamber, this also results in pressure dependent size calibration (CitationBahreini et al. 2003). Previous experiments without a PCI have shown that a 6% reduction in P 0 can cause a 14% reduction in P L and lead to a measurable deviation in the observed particle velocity, and therefore, the deduced particle size (CitationBahreini et al. 2003). The PCI removes this dependence () where the velocity of dry monodisperse NH4NO3 particles as calculated from their corresponding times-of-flight follows the same calibration curve regardless of P 0. Furthermore, this velocity calibration is unchanged from the base case (i.e., PCI removed from the inlet) since P Lens values are similar in these experiments. Note that these experiments were carried out with ammonium nitrate, and the lack of a deviation in the size calibration indicates that this semi volatile species did not experience significant evaporation in the PCI at these operating conditions. Experiments using the PCI-I design and PSL particles (not shown) demonstrate that the velocity calibration is constant with P 0 = 267–828 mbar when P PCI was controlled at 107 mbar.
FIG. 3 Size calibration is unchanged in experiments with similar lens pressure (PLens). Data points are size selected dry ammonium nitrate particles.
Transmission efficiency, E L , of particles as a function of size through the lens can also be affected by variable P 0. A series of experiments were conducted to characterize E L when the AMS sampled through the PCI at variable P PCI. Experiments using PCI-I model show that with P PCI = 107 mbar and D O, down = 300 μ m (P Lens∼ 1.33 mbar), transmission efficiency of particles larger than d va∼ 200 nm is poor compared to transmission without the PCI (D O, down = 120 μ m) (). Since this configuration was used for the 2004 NEAQS-ITCT airborne study, there were substantial particle transmission losses as a function of size in the raw field data, to which a correction was applied. Interestingly, particle beam position studies in the AMS vacuum chamber, carried out using a beam width probe (CitationHuffman et al. 2005) while varying P 0 in the range of 267–827 mbar, showed that the fraction of particles in the center of the particle beam did not change significantly, regardless of size or transmission efficiency. This indicates that particle transmission losses for these conditions were occurring upstream of the AMS chamber, i.e., in the PCI and aerodynamic lens system. Tests of the first PCI design after the 2004 field study (sampling conditions summarized in and results shown in ) showed that there was an improvement in E L when P PCI was controlled in the range of 433–683 mbar compared to P PCI = 107 mbar. Since the highest altitude expected during subsequent airborne studies with NOAA WP-3D or NSF C-130 aircrafts is less than 7 km, the lowest P PCI tested with the PCI-II design was 467 mbar. As shown in , with P PCI in the range of 467–653 mbar, P 0 = 840 mbar, and P Lens∼ 1.65–1.95 mbar, E L stays close to 100% for all particle sizes tested. However, E L of particles larger than d va∼ 450 nm is reduced if P 0 is lower than the set point of the PCI chamber pressure (filled diamond vs. open square data points in ). Thus, in order to avoid lack of pressure control at some altitudes during aircraft sampling for example, the optimum P PCI is the lowest controllable pressure with a matching D O,down that would still allow P Lens to be similar to that of the base case condition (∼ 1.6–1.9 mbar). For this reason, P PCI = 467 mbar along with D O,down = 150 μ m were selected for sampling aboard NSF C-130 aircraft during MILAGRO/INTEX-B as well as the measurements made on NOAA WP-3D aircraft during the 2006 TexAQS/GoMACCS field study.
FIG. 4 AMS transmission efficiency, EL, as a function of particle size, dva, with PCI-I (a) and PCI-II (b,c) designs at different operating conditions.
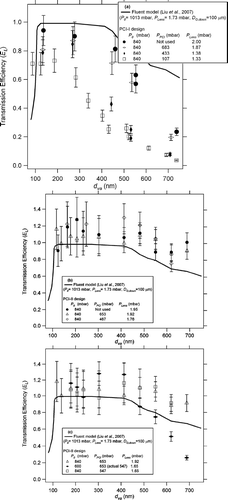
TABLE 3 Summary of operating conditions in experiments with PCI-I model. In all experiments, P 0 = 840 mbar and D O, up = 180 μ m
Note that for the data points without the PCI, E L values in are different than those in predominantly due to transmission variations among nominally similar aerodynamic lenses. Although not shown, when PCI-II design was placed in front of the aerodynamic lens used to test with PCI-I design and was operated at P PCI = 467 mbar and P L = 1.79 mbar, transmission of the particles larger than d va∼ 500 nm decrease to values less than 0.8, indicating that the lens design and machining characteristics have a stronger influence on particle transmission than the PCI design. Furthermore, E L values predicted for the AMS lens system by the Fluent model (Liu et al. 2007) lie in between the different measurements, possibly due to different D O,down and P Lens in the experiments (, ) compared to those in the simulations (100 μ m and 1.73 mbar) or because of different transmissions across nominally similar lens systems.
CONCLUSIONS
Design and operational characteristics of two PCI designs are described here as they were implemented on AMS instruments with an aerodynamic aerosol lens system. Laboratory experiments show that particle size calibrations in the AMS remain unchanged within measurement precision when it samples through the PCI at pressures higher than P PCI. Characterization experiments on the PCI also reveal that particle transmission efficiency remains close to 100% if P Lens∼ 1.65–1.95 mbar, P PCI is controlled at ∼ 467–653 mbar, and P 0 is higher than P PCI. Based on the results from these experiments, a suitable combination of D O,down (150 μ m) and P PCI (467 mbar) was selected that allows for pressure controlled conditions within the PCI at altitudes up to ∼ 6.5 km. Airborne measurements using PCI-II model, operated under these conditions upstream of an AMS, show that the mass flow rate and “airbeam” signal of the AMS are well controlled and stay constant with variations smaller than 2% during a typical flight.
Acknowledgments
This work was partially supported by NASA grant NNG04GA67G and NSF/UCAR grant S05-39607. RB and PFD acknowledge a CIRES postdoctoral visiting fellowship and an EPA STAR graduate fellowship (FP-91650801), respectively. We thank Jim Kastengren at CIRES for useful discussions and fabrication of the second design of the PCI and the AMS community for many useful discussions.
Related Research Data
REFERENCES
- Allan , J. D. , Jimenez , J. L. , Williams , P. I. , Alfarra , M. R. , Bower , K. N. , Jayne , J. T. , Coe , H. and Worsnop , D. R. 2003 . Quantitative Sampling Using an Aerodyne Aerosol Mass Spectrometer. Part 1: Techniques of Data Interpretation and Error Analysis . J. Geophys. Res. , 108 ( D3 ) : 4090 doi:10.1029/2002JD002358
- Bahreini , R. , Jimenez , J. L. , Wang , J. , Flagan , R. C. , Seinfeld , J. H. , Jayne , J. T. and Worsnop , D. R. 2003 . Aircraft-Based Aerosol Size and Composition Measurements During ACE-Asia Using and Aerodyne Aerosol Mass Spectrometer . J. Geophys. Res., , 108 ( D23 ) : 8645 doi:10.1029/2002JD003226
- Brock , C. A. , Schroder , F. , Karcher , B. , Petzold , A. , Busen , R. and Fiebig , M. 2000 . Ultrafine Particle Size Distributions Measured in Aircraft Exhaust Plumes . J. Geophys. Res. , 105 ( D21 ) : 26555 – 26567 .
- DeCarlo , P. F. , Kimmel , J. R. , Trimborn , A. , Jayne , J. , Aiken , A. C. , Gonin , M. , Fuhrer , K. , Horvath , T. , Docherty , K. S. , Bates , D. R. and Jimenez , J. L. 2006 . A Field-Deployable High-Resolution Time-of-Flight Aerosol Mass Spectrometer . Anal. Chem. , 78 ( 24 ) : 8281 – 8289 .
- DeCarlo , P. F. , Slowik , J. G. , Worsnop , D. R. , Davidovits , P. and Jimenez , J. L. 2004 . Particle Morphology and Density Characterization by Combined Mobility and Aerodynamic Measurements. Part 1: Theory . Aerosol Sci. Technol. , 38 : 1185 – 1205 . (doi: 10.1080/027868290903907)
- Drewnick , F. , Hings , S. S. , DeCarlo , P. , Jayne , J. T. , Gonin , M. , Fuhrer , K. , Weimer , S. , Jimenez , J. L. , Borrmann , K. L. D. S. and Worsnop , D. R. 2005 . A New Time-of-Flight Aerosol Mass Spectrometer (TOF-AMS)—Instrument Description and First Field Deployment . Aerosol Sci. Technol. , 39 ( 7 ) : 637 – 658 .
- Huffman , J. A. , Jayne , J. T. , Drewnick , F. , Aiken , A. C. , Onasch , T. , Worsnop , D. R. and Jimenez , J. L. 2005 . Design, Modeling, Optimization, and Experimental Tests of a Particle Beam Width Probe for The Aerodyne Aerosol Mass Spectrometer . Aerosol Sci. Technol. , 39 ( 12 ) : 1143 – 1163 .
- Jayne , J. T. , Leard , D. C. , Zhang , X. , Davidovits , P. , Smith , K. A. , Kolb , C. E. and Worsnop , D. W. 2000 . Development of an Aerosol Mass Spectrometer for Size and Composition Analysis of Submicron Particles . Aerosol Sci. Technol. , 33 : 49 – 70 .
- Jimenez , J. L. , Jayne , J. T. , Shi , Q. , Kolb , C. E. , Worsnop , D. R. , Yourshaw , I. , Seinfeld , J. H. , Flagan , R. C. , Zhang , X. , Smith , K. A. , Morris , J. and Davidovits , P. 2003 . Ambient Aerosol Sampling with an Aerosol Mass Spectrometer . J. Geophys. Res., , 108 ( D7 ) : 8425 doi:10.1029/2001JD001213
- Lee , J. K. , Rubow , K. L. , Pui , D. Y. H. and Liu , B. Y. H. 1993 . Design and Performance Evaluation of a Pressure-Reducing Device for Aerosol Sampling from High-Purity Gases . Aerosol Sci. Technol. , 19 ( 3 ) : 215 – 226 .
- Liu , P. , Ziemann , P. L. , Kittelson , D. B. and McMurry , P. H. 1995a . Generating Particle Beams of Controlled Dimensions and Divergence: I. Theory of Particle Motion in Aerodynamic Lenses and Nozzle Expansion . Aerosol Sci. Technol. , 22 : 293 – 313 .
- Liu , P. , Ziemann , P. L. , Kittelson , D. B. and McMurry , P. H. 1995b . Generating Particle Beams of Controlled Dimensions and Divergence: II. Experimental Evaluation of Particle Motion in Aerodynamic Lenses and Nozzle Expansions . Aerosol Sci. Technol. , 22 : 314 – 324 .
- Liu , P. S. K. , Deng , R. , Smith , K. A. , Williams , L. R. , Jayne , J. T. , Canagaratna , M. R. , Moore , K. , Onasch , T. B. , Worsnop , D. R. and Deshler , T. 2007 . Transmission Efficiency of an Aerodynamic Focusing Lens System: Comparison of Model Calculations and Laboratory Measurements for the Aerodynamic Aerosol Mass Spectrometer . Aerosol Sci. Technol. , 41 : 721 – 733 .
- Matthew , B. M. , Onasch , T. B. and Middlebrook , A. M. 2008 . Collection Efficiencies in an Aerodyne Aerosol Mass Spectrometer as a Function of Particle Phase for Laboratory Generated Aerosols . Aerosol Sci. Technol. , Submitted
- Murphy , D. M. 2007 . The Design of Single Particle Laser Mass Spectrometers . Mass Spectrom. Rev. , 26 ( 2 ) : 150 – 165 .
- Schreiner , J. , Schild , U. , Voigt , C. and Mauersberger , K. 1999 . Focusing of Aerosols into a Particle Beam at Pressures from 10 to 150 Torr . Aerosol Sci. Technol. , 31 ( 5 ) : 373 – 382 .
- Schreiner , J. , Voigt , C. , Mauersberger , K. , McMurry , P. and Ziemann , P. 1998 . Aerodynamic Lens System for Production Particle Beams at Stratospheric Pressures . Aerosol Sci. Technol. , 29 ( a ) : 50 – 56 .
- Su , Y. X. , Sipin , M. F. , Furutani , H. and Prather , K. A. 2004 . Development and Characterization of an Aerosol Time-of-Flight Mass Spectrometer with Increased Detection Efficiency . Anal. Chem. , 76 ( 3 ) : 712 – 719 .
- Tobias , H. J. and Ziemann , P. 1999 . Compound Identification in Organic Aerosols Using Temperature-Programmed Thermal Desorption Particle Beam Mass Spectrometry . Anal. Chem. , 71 ( 16 ) : 3428 – 3435 .
- Zelenyuk , A. and Imre , D. 2005 . Single Particle Laser Ablation Time-of-Flight Mass Spectrometer: An Introduction to SPLAT . Aerosol Sci. Technol. , 39 ( 6 ) : 554 – 568 .
- Zhang , X. , Smith , K. A. , Worsnop , D. R. , Jimenez , J. , Jayne , J. T. and Kolb , C. E. 2002 . A Numerical Characterization of Particle Beam Collimation by an Aerodynamic Lens-Nozzle System: Part I. An Individual Lens or Nozzle . Aerosol Sci. Technol. , 36 : 617 – 631 .