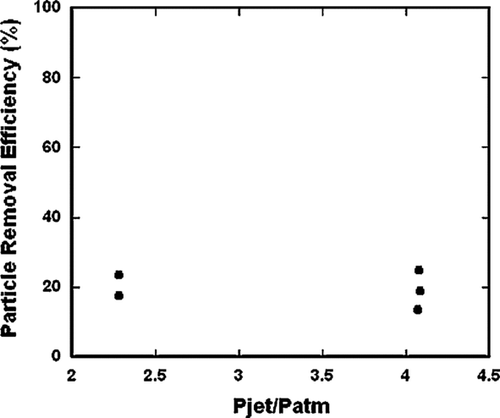
Abstract
Experiments were conducted to determine particle removal efficiencies from surfaces due to air jet impingement. We utilize monodisperse fluorescent polymer spheres ranging from 1 μm to 45 μm diameter distributed on polycarbonate surfaces and muslin cloth. Particle removal efficiencies are determined from cloth that simulates clothing or fabrics, surfaces important for trace explosives detection. Optical images of the sample surface are taken using a fluorescence microscope (488 nm radiation) before and after being challenged by a pulsed air or nitrogen jet. The jet is oriented at 45 degrees with respect to the particle laden substrate and is precisely aligned onto the center of the optical axis of the microscope. Particle removal rates are determined by automated particle counting implemented by image processing and analysis. We found that the cloth surface has a release rate comparable to the rate for polycarbonate surface under similar jet conditions. As expected, there is a particle size dependence on removal efficiency, with larger particles being more easily removed.
INTRODUCTION
Particle removal from surfaces by air jets is important for cleaning (semiconductor industry), contamination control, and homeland security. Recently, emphasis has been placed on particle removal using air jets primarily to support development of aerodynamic particle sampling portals. These systems use air jets to dislodge particles from persons or objects and thus are a critical front end process for detection of trace explosive particles by portals. Explosives have a low vapor pressure and so consequently trace detection requires analysis of particulate matter. If particles are not removed effectively and consequently not detected, there is opportunity for a significant level of false negative responses. Particles are held on surfaces by molecular forces (van der Waals forces) where the attachment force is proportional to the particle diameter and inversely proportional to the distance squared from the surface. There is a chemical compositional dependence to this force. In addition to van der Waals forces, electrostatic forces also play a strong role in particle adhesion to surfaces and are potentially important for dielectric particles and surfaces where the charge may not migrate. Capillary condensation of water (capillary forces) can glue the particles to the surface with forces some 70 times stronger than van der Waals forces (CitationLiu et al. 1994). An overview of attachment forces is given by CitationRanade (1987) and CitationPhares et al. (2000c).
The theory of boundary layer fluid flow (of the gas) over a surface has been extensively described (CitationZimon 1982; CitationSchlichting 1955). Others have reported particle removal of particles from clean surfaces. CitationLiu et al (1994) designed an air jet system and performed experiments to measure the removal of Arizona road dust and silicon particles from pre-cleaned glass slides. Smedley et al. (Citation1999, Citation2001) has applied an air jet at both normal and oblique incidence for removing particles. These authors proposed the concept that particles on a surface could serve as shear stress sensors (CitationPhares et al. 2000a). Phares expanded this approach (CitationPhares et al. 2000b) by using an oblique incident air jet to study the removal of explosive particles in fingerprints and also deposited spherical trinitrotoluene (TNT)-polymer composite particles. Both sets of particles were deposited on ultra clean glass slides. Identification of particle removal was by microscopy and in the spherical TNT particle case, by collection of the liberated particles for chemical detection. Finally, CitationPhares et al. (2000c) give an overview of surface attachment by particles, present a set of experimental results for normal incident jet removal of polymer spheres, and observe that the shear stress is more sensitive with respect to particle diameter than expected from theoretical considerations. The authors propose a kinetic cracking mechanism for breaking the particle loose from the surface.
In this article, we continue the work of Phares et al. on planar surfaces and use these measurements as a basis of comparison for extending the efforts to other surfaces, to consider surfaces relevant to explosive particle sampling. One likely surface for particle retention by a person is their clothing. Clothing or fabrics are a complex matrix usually composed of woven fibers where particles can be trapped. Cloth has a third dimension that previous experiments on glass slides were not concerned with and makes the microscopy more challenging.
EXPERIMENTAL SECTION
Commercially obtained fluorescent polystyrene microspheres (Polysciences, Inc.) were suspended in deionized filtered water, sonicated by a sonic probe or sonic bath and collected by filtration onto polycarbonate filters. The polycarbonate filter, pore size 0.45 μm, serves as a flat, planar test surface for particle removal. The filter material was not preconditioned or cleaned prior to filtration, although past experience has shown these filters to be very free of particles. Particles with nominal diameters of 45 μm, 20 μm, 15 μm, 10 μm, 6μm, and 1 μm were used in the experiments. These sizes span the range of explosive particles found in fingerprints (CitationVerkouteren 2007). In some cases, a mixture of sizes were filtered and in some cases only single sized fluorescent spheres were employed. Fluorescent polystyrene latex spheres were deposited onto the test surface (either polycarbonate filter material or muslin cloth). A region on the surface containing the spheres was imaged to obtain an initial particle count with a fluorescence microscope before subjecting the surface to the high velocity air jet. The imaged region is then challenged with the jet and the remaining spheres were imaged and counted to determine particle loss.
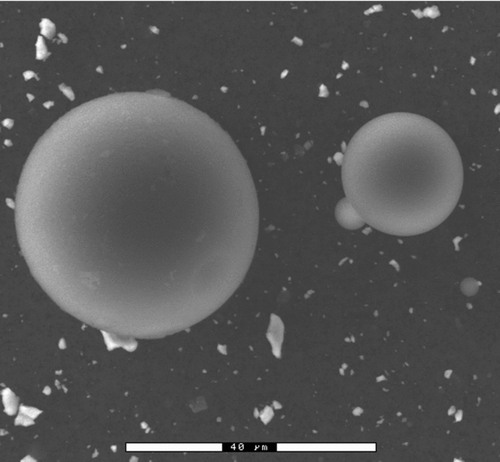
Two qualities of polycarbonate filter were inadvertently analyzed. The sonic metal probe used to deagglomerate the spheres produced tungsten particles that were also collected on the filter surface. The metal particles were not imaged by the fluorescent microscope, but did serve to roughen the planar polycarbonate surface. An environmental scanning electron microscope (ESEM) image of a typical sample is shown in where the spheres and metal particles can be observed. Image analysis indicates the metal particles are polydisperse and irregular in shape; the equivalent circular mean diameter is approximately 0.9 μm with a standard deviation of 0.8 μm. As the probe became more fractured, we switched to sonication by a bath which left no metal particles, but this method was not as energetic and thus not as successful in deagglomerating the spheres. After the spheres were filtered, the filters were stored overnight in a dessicator at reduced water vapor partial pressure to dry the sample and charge neutralized with a radioactive alpha source. Experiments were conducted on the microspheres that were filtered from a water suspension and dried on the membrane filter. Experiments were also conducted on microspheres dry transferred from the dry membrane filter to another membrane surface.
FIG. 1 Environmental scanning electron image of polystyrene spheres and metal particles produced from the sonic probe.
For the muslin cloth experiments, we collected microspheres from suspension by filtration onto polycarbonate filters, and dry transferred the spheres onto the top surface of muslin cloth by rubbing the cloth over the filter surface. Muslin is frequently used for particle collection by swiping of suspect surfaces. No attempt was made to use the cloth as a filter because that would have dispersed the spheres throughout the fibers in all 3 dimensions. We tried to avoid conditions that would place spheres deep into the cloth because this would be unrealistic with respect to explosive particle transfer onto clothing.
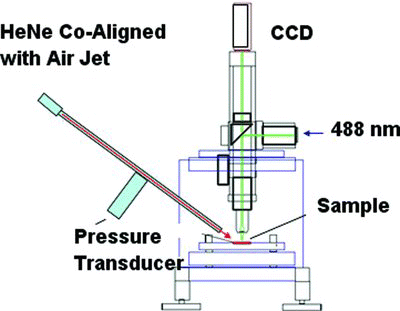
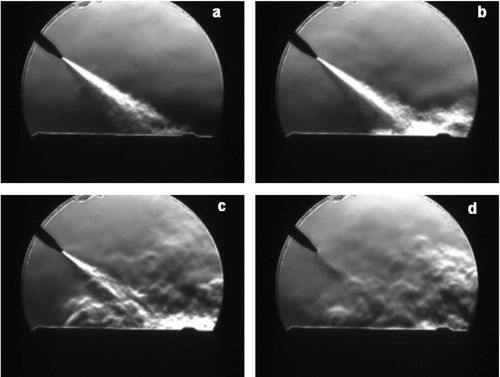
A schematic of the fluorescent microscope constructed for this work is shown in . The 488 nm illuminating radiation comes from an argon ion laser and is directed to the objective lens by fiber optics. We utilize two objective lenses with magnifications of 50× and 10×. The charge-coupled device (CCD) camera is filtered with a yellow-green transmitting filter to enhance the fluorescing sphere images while eliminating the excitation light. The nitrogen or air jet used is oriented at 45 degrees to the sample surface. The jet nozzle is 1 mm in diameter, positioned 10 mm above the surface and the jet pressure relative to atmospheric pressure is determined using a pressure transducer. The geometry of the microscope and jet are similar to previous work (CitationLiu et al. 1994). We obtained qualitative information about the size and impingement area of the jet by using helium in place of air to visualize the flow of the gas. Schlieren images of 4 stages of the air pulse, that illustrate the density or fluctuations in the gas flow causing refractive index differences (CitationSettles 2001), are shown in . The relative humidity and temperature in the laboratory was approximately 45% and 21°C to 24°C, respectively. A HeNe laser beam is directed down the jet centerline to facilitate precise jet alignment onto the sample. This beam exits the jet and is exactly co aligned with the air stream. It is critical that the microscopic field of view coincides with the gas jet interaction region. The jet interaction region is elliptical in shape (CitationSmedley et al. 2001). The majority of the experiments were done with a computer controlled solenoid that produced jet pulses that consisted of 3 consecutive jet pulses each 100 ms long. Between each pulse there was a 200 ms delay.
FIG. 3 Four frames of Schlieren images that capture the jet pulse sequence (a) developing jet, (b) the stream impacting the surface, (c) the jet dissipating, and (d) the end of pulse.
The gas jet velocity at the exit was calculated by using the ratio of the measured air jet pressure, Pjet, to ambient lab pressure, Patm. Knowing the ratio Pjet/Patm, we can calculate the velocity and dynamic pressure of the gas (Pai 1957; CitationSmedley et al. 1999). Our pressure transducer was verified by the NIST Process Engineering Division that has the responsibility for primary flow calibration. The transducer was compared with a Paroscientific Digiquartz pressure transducer that had a known total uncertainty of 0.05% at the 95% confidence level. Our total uncertainty was found to approximately 2.5% (κ=1) with the major factor being the variance in our shot-to-shot peak pressure measurements. The uncertainty in the number of microspheres was determined by comparing visual counts to counts obtained by image analysis. The result of the comparison of some 8000 microspheres that were 45 μm, 20 μm, and 10 μm in diameter indicated a 5% uncertainty. Since each particle removal efficiency measurement requires two count determinations, we are assuming a combined uncertainty of approximately 7%.
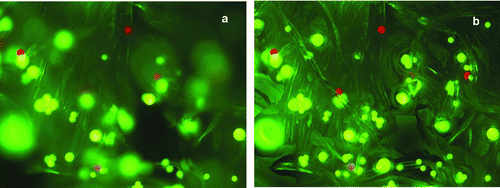
The 24-bit color images were acquired by the CCD camera (Evolution 5 MP digital camera) before and after air pulsing. The stored images were image analyzed using Image Pro image processing software (Media Cybernetics) and a NIST-based software, Lispix (CitationBright 1995). For spheres on muslin cloth, the most accurate method of sizing and counting fluorescent spheres was obtained by reconstructing the image for maximum contrast from 20 different focal planes (multi-z images taken at 20 heights). This technique provides better image quality, overcoming the issues of poorly focused particles residing at different heights in the fabric. An example of the effect of multi-z imaging is shown in for 45 μm, 20 μm, and 15 μm diameter fluorescent spheres dry transferred onto a muslin cloth. In all cases, human judgment and manual examination of the image data was required to minimize erroneous results in the image analysis. Our data is represented as plots of particle removal (percent loss) as a function of Pjet/Patm.
FIG. 4 Two optical fluorescence micrographs of the same field of view showing 45 μm (large, green), 20 μm (medium, green), and 15 μm (red) fluorescent polystyrene microspheres on muslin cloth. Frame (a) is a normal optical image (single focus) and (b) is a reconstructed image formed from multiple images obtained at successive focal lengths.
Analysis was also done on fingerprints that were formed on microscope glass slides and muslin cloth. The prints were made by rolling a finger onto a surface containing fluorescent polystyrene spheres and then depressing the finger onto the slide or cloth.
RESULTS AND DISCUSSION
Typical fluorescent micrographs of a mixture of 45 μm and 20 μm spheres are shown in . The bright yellow-green color of the particle makes identifying irradiated fluorescent spheres on polycarbonate surfaces easy. The particles are counted using an image processing approach known as blobbing (CitationRuss 1995). Blobbing identifies the number of contiguous pixels meeting a specified gray level criteria. The first image is taken before the jet is applied and the second image shows the particles remaining after application of the jet. The composite image illustrates the location of lost particles and is derived from the first two images. We can calculate the percent loss of particles from the blob analysis. A plot of percent loss results from the examination of many images and between 500 and 1000 particles for each data point. For purposes of analysis, the 6 μm and 10 μm data have been grouped together. presents the results for removal of the 45 μm, 20 μm, 15 μm, and 6 μm to 10 μm microspheres from a polycarbonate filter. Evident is the fact that removal efficiency increases as a function of both Pjet/Patm (the jet velocity) and the particle size as reported previously (CitationCorn and Stein 1965; CitationLiu et al. 1994; CitationRanade 1987; CitationZimon 1982). The explanation often provided is that larger particles extend farther into the viscous boundary layer (that increases linearly in magnitude from the surface) and experience more drag force (Equation [1]) imparted by the air stream.
FIG. 5 Fluorescent micrograph of 45 μm and 20 μm spheres on polycarbonate (a) before jetting, (b) after air jet, and (c) combined overlay image showing the removed particles as light blue or gray.
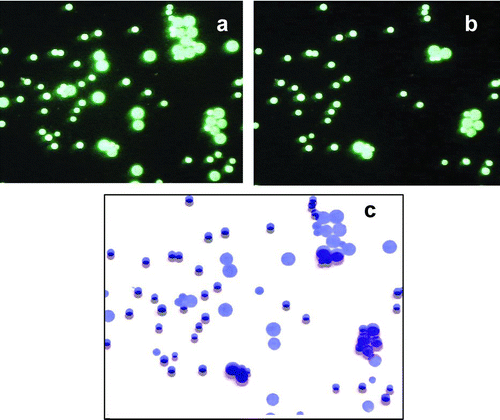
FIG. 6 Plot of removal efficiency from polycarbonate filters for (circles) 45 μm, (squares) 20 μm, grouped 6 μm to 10 μm, and (diamonds) 1 μm polystyrene spheres. Particles were wet collected from aqueous suspension onto the substrate. Lines are not fitted, but are present to show the general trend of the data.
In Equation (Equation1), F is the drag force on the particle in the boundary layer, η is the gas viscosity, v is the gas free stream velocity far from the surface, d is the particle diameter, and δ the boundary layer thickness (CitationZimon 1982). The spheres were collected from aqueous suspension and consequently were deposited on the substrate while wet. presents a summary of the data tabulated to provide the sphere size, number of spheres challenged by the jet, the pressure ratio of the jet pressure to the lab room pressure, the dynamic pressure at the jet, the jet Reynolds number and the percentage of particles removed from the polycarbonate surface.
TABLE 1 Compiled data for fluorescent spheres on polycarbonate filter material. Columns left to right are sphere diameter, number of particles before jet, ratio of measured jet pressure to ambient lab pressure, calculated gas velocity, dynamic pressure at the jet exit, jet Reynolds number, and percent of the spheres removed by jet. Spheres were collected by filtration from an aqueous suspension
The air velocity for a compressible gas exiting a jet with known pressure is (CitationPai 1954)
The jet Reynolds number, Re, is
The dynamic pressure, P, of the air exiting the jet is
The particle removal efficiency, E (%), due to the jet is
where nb is the number of spheres counted before the air jet encounters the surface and na is after jetting.
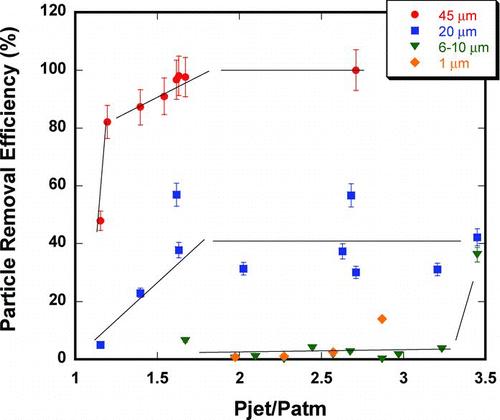
The results of the dry transfer of spheres to the polycarbonate surface in shows that the attachment forces for these spheres are greatly reduced over the polycarbonate substrates where the spheres were collected by filtration from an aqueous suspension. The dry transferred spheres appear to be approximately 40–50 times easier to liberate from the surface than the wet collected ones. This is especially evident from the 6–10 μm spheres from both data sets. An explanation of the reason is given later. contains a subset of the values and calculated parameters. In both the wet and the dry transfer cases, the large spheres are more readily removed than the small spheres.
FIG. 7 Plot of microsphere removal efficiency from polycarbonate filters. Spheres were dry transferred to the substrate. Lines are second order polynomial fits to the data and illustrate the trends for each particle diameter. The uncertainty in the jet pressure and the particle number is approximately 2.5% and 7%, respectively.
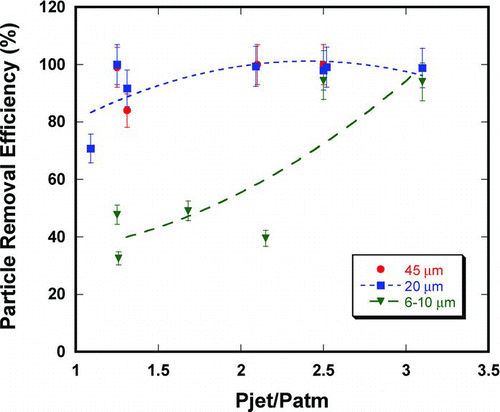
TABLE 2 Compiled data for dry transferred fluorescent spheres on polycarbonate filter material. Columns left to right are sphere diameter, number of particles before jet, ratio of measured jet pressure to ambient lab pressure, calculated gas velocity, dynamic pressure at the jet exit, Reynolds number, and percent of the spheres removed by jet
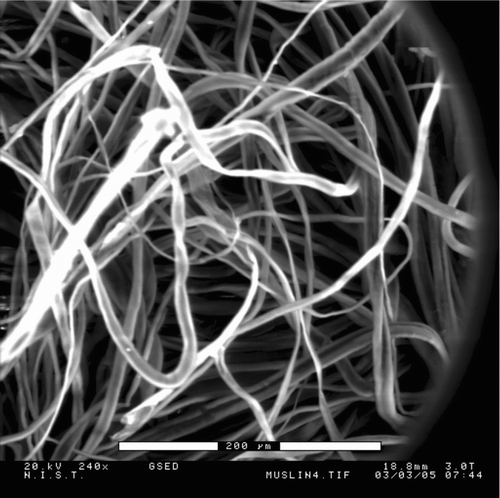
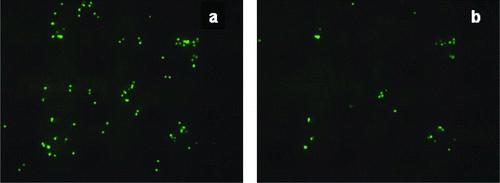
A similar set of measurements was undertaken using dry transfer of spheres onto a cloth surface. An ESEM image of the muslin cloth is shown in illustrating the complexity of this substrate material. Examples of fluorescent spheres on cloth are shown in . The cloth retains the spheres on the individual fibers both on the outer surface and further into the cloth. The spatial location makes image analysis more challenging than the simple planar two dimensional geometry. As can be seen in the image, some spheres are in the focal plane of the microscope while others appear distinctly out of focus. Also, the cloth fibers are illuminated by the fluorescing spheres and so the original spheres-containing cloth appears much “brighter” than the sister image produced after the air jet particle removal process.
FIG. 9 10 μm fluorescent spheres on muslin cloth (a) before jet removal and (b) post air jet removal.
Two methods were explored to process the images. First, an intensity map was made that provided the gray level of each pixel in the before and after jet images. Then the mean gray level value for each image was calculated and ratioed to determine the loss. The assumption in this method is that the loss in intensity is dependent upon the loss in particles only (that the intensity varies linearly with the number of particles). This assumption is only partially true (e.g., out of focus objects have reduced intensity), but the illuminated fibers, as can be seen from the image, introduce a bias in the intensity for the heavily loaded cloth filter. To avoid the bias, the individual particles were counted using Lispix (CitationBright 1995) employing a small smoothing graphic filter and discrimination on both intensity gradient and number of grouped pixels. The 10 μm polystyrene latex spheres on muslin were analyzed using Image Pro and the multi-height image reconstruction described above. The results shown in are derived from particle counting and are lower in magnitude than values obtained from average intensity ratios. The removal efficiency from the cloth for 6 μm and 10 μm spheres are some 20 to 80 times larger (respectively) than for the planar surface-wet collection, but comparable to the dry transfer method on polycarbonate. The 45 μm spheres are efficiently liberated from both types of surfaces. Spheres that are 20 μm in diameter come off the cloth with about 5 times the rate when compared to the wet collection planar surface. contains a subset of the data.
FIG. 10 Summary of percent losses from muslin cloth for 45 μm, 20 μm, 15 μm, 10 μm, and 6 μm spheres. The particle diameters are indicated in the plot legend. The error bars represent the uncertainty in the counting measurement. The uncertainty in the jet pressure and the particle number is approximately 2.5% and 7%, respectively.
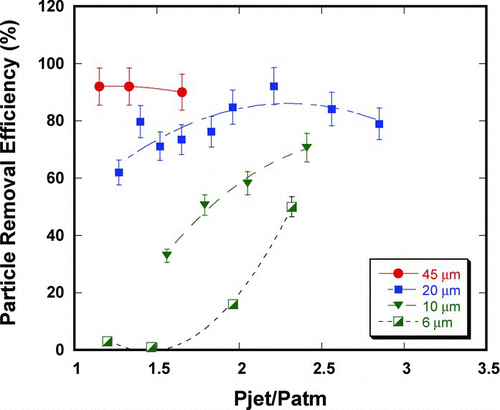
TABLE 3 Data for fluorescent sphere removal from muslin cloth. Columns left to right are sphere diameter, number of particles before jet, ratio of measured jet pressure to ambient lab pressure, calculated gas velocity, dynamic pressure at the jet exit, Reynolds number, and percent of the spheres removed by jet
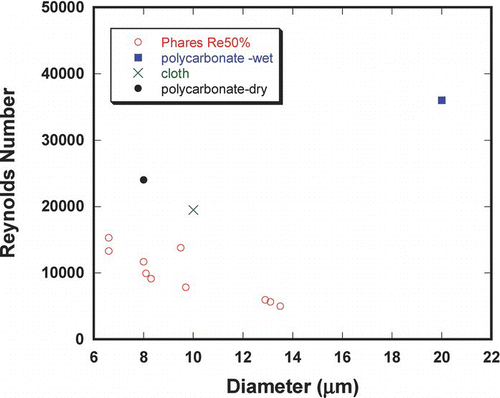
A qualitative comparison of our data with data taken for polymer spheres residing on glass slides by CitationPhares et al. (2000c) is possible. Results for the jet Reynolds number required to remove 50% of the spheres and the results of values of jet Re close to 50% liberation from both polycarbonate wet and dry transfer and cloth are shown in . The Phares et al. experiment utilized a normal incident jet. Later studies by this author showed that a 45° oriented jet has approximately 15% higher removal efficiency. As can be seen, the spheres on polycarbonate are considerably more tightly bound to the surface than the spheres on glass by Phares. A quadratic fit to Phares's data to extend their results to 20 μm diameter indicate that the wet transferred spheres on polycarbonate require approximately a factor of 10 higher Reynolds number to remove the particles. The agreement between Re of Phares with the cloth data is much closer. One possible explanation for the more tightly bound wet transferred spheres to planar polycarbonate surface is presented by CitationRanade (1987) where he observes that particles and surfaces that have a history of both being in contact with a liquid can cause the particles to remain tightly bound to the surface. This observation is irrespective of the amount of water vapor present after the particles are dried. The author states that residue (like a dried salt) can increase the binding energy of the particle to the surface; effectively gluing them to the surface. In our case, we perform a dry particle transfer to the cloth. The particle-liquid history is not a factor for the cloth experiments. Nor is it a factor for microspheres that are dry transferred to polycarbonate which have measured adhesion properties similar to the cloth.
FIG. 11 Comparison of CitationPhares et al. (2000c) data for polymer particles on glass slides normal incident jet, particle diameter versus jet Reynolds number and the comparable data presented here for polycarbonate (wet sphere collection), polycarbonate dry transfer, and cloth.
Another possible explanation for the enhanced removal efficiency may be related to the flow field around the fibers holding the particles and that the air pulses actually cause the fibers in the cloth to vibrate thus helping to liberate particles in the flowing gas stream. Larsen (1957) reported increases in release rates of glass spheres from glass fibers in low (22%) and moderate (40%) relative humidity. He quantified the force required to remove the spheres in terms of fiber vibration frequency. The amount of water vapor had a strong effect on the ease of particle removal from the fiber. The author observed that liquid adhesion forces played a larger role in maintaining particle attachment than van der Waals forces. In our case, the spheres experienced nearly the same relative humidity environments (≈45%) for both the planar polycarbonate surface and the cloth surface. Larsen presents a parameter, kd , that ratios the fiber diameter to the particle diameter. For kd =1, the adhesion force is 0.5 that of a particle on a plane undergoing a capillary adhesion mechanism. In our experiments with cloth, we have microspheres on fibers that are approximately (on average) 20 μm in diameter so that the particle and fiber geometry may play a role.
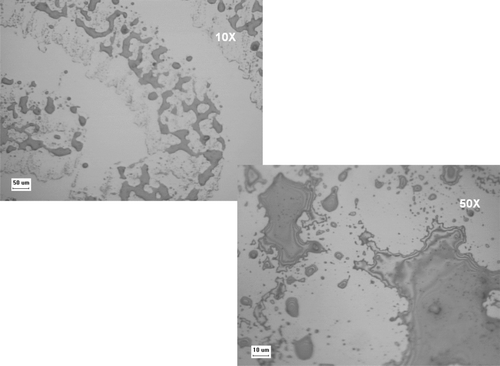
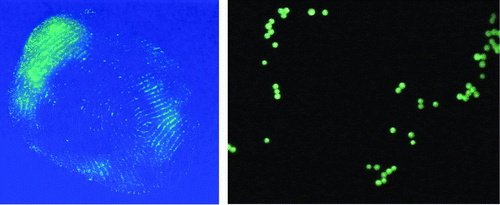
An effective and common method of transferring trace material is through fingerprints (CitationHallowell 2001). An example of a fingerprint made on a cleaned silicon surface is shown in the optical micrograph found in . Two magnifications are shown to illustrate the ridge pattern and a close up of the oil droplets from the skin (sebaceous secretion) making the ridges. One approach to examine the removal efficiency of fingerprinted material is to use the same spherical fluorescent particulate used above in the muslin experiments as the “fingerprint ink.” Fingerprints were made on glass slides as illustrated in that shows the overall fingerprint and a magnified swirl pattern. A similar fluorescent particle fingerprint was placed on muslin cloth and interrogated with the air jet. As can be seen in , the removal efficiency is a factor of 5 less for these large spheres. The fingerprint oil presumably increases the attachment of the spheres to the fibers.
SUMMARY
We have established a capability to measure particle release rates from surfaces under pulsed air jets. Our initial efforts presented here are for fluorescent spheres on polycarbonate filter and muslin cloth surfaces. Our results for dry transferred spheres are consistent with previous studies. Wet particle transfer resulted in microspheres that were less efficiently removed from the polycarbonate surface. To our knowledge, these are the first measurements for release rates from cloth. For both substrates, large particles are removed from the surfaces more readily than smaller particles. As an initial step into explosive particle analysis, we have examined fingerprints using microspheres as embedded particle. Our future plans include additional experiments using spherical particles and coated spheres on other substrates and geometries, and then an extensive effort on commonly used explosive particles. Our experimental design provides a test bench to explore optimization of air jet parameters for removing particles from surfaces.
The authors wish to acknowledge David Bright for help with the Lispix programming for image analysis, Aaron Johnson for the pressure transducer verification, and Steve Mates for help with the Schlieren imaging of the jets. Steve Stranick helped us with the fluorescent microscope construction.
Commercial equipment, instruments, and materials, or software are identified in this article to specify adequately the experimental procedure. Such identification does not imply recommendation or endorsement of these items by the NIST, nor does it imply that they are the best available for the purpose.
REFERENCES
- Bright , D. S. 1995 . MACLispix: A Special Purpose Public Domain Image Analysis Program for the Macintosh . Microbeam Analysis , 4 : 151
- Corn , M. and Stein , F. 1965 . Re-Entrainment of Particles from Plane Surface . Amer. Ind. Hyg. Assoc. J. , 26 : 325 – 336 .
- Hallowell , S. F. 2001 . Screening People for Illicit Substances: A Survey of Current Portal Technology . Talanta , 54 : 447 – 458 .
- Larsen , R. I. 1958 . The Adhesion and Removal of Particles Attached to Air Filter Surface . Amer. Ind. Hyg. Assoc. J. , 19 ( 4 ) : 265 – 270 .
- Liu , B. Y. H. , Yoo , S. H. , Davies , J. P. , Gresham , G. and Hallowell , S. F. 1994 . “ Development of Particle Standards for Testing Explosive Detection Systems: Characterization of the Adhesion Forces Between Composition 4 Particles and Polyethylene ” . In Cargo Inspection Technologies , Vol. 2276 , 45 – 55 . SPIE .
- Pai , S.-I. 1954 . Fluid Dynamics of Jets Edited by: Van Nostrand , D. 24 – 27 . New York
- Phares , D. J. , Smedley , G. T. and Flagan , R. C. 2000a . The Wall Shear Stress Produced by Normal Impingement of a Jet on a Flat Surface . J. Fluid Mech. , 418 : 351 – 375 .
- Phares , D. J. , Holt , J. K. , Smedley , G. T. and Flagan , R. C. 2000b . Method for Characterization of Adhesion Properties of Trace Explosives in Fingerprints and Fingerprint Simulation . J. Forensic Sci. , 45 ( 4 ) : 774 – 784 .
- Phares , D. J. , Smedley , G. T. and Flagan , R. C. 2000c . Effect of Particle Size and Material Properties on Aerodynamic Resuspension from Surfaces . J. Aerosol Sci. , 31 ( 11 ) : 1335 – 1353 .
- Ranade , M. B. 1987 . Adhesion and Removal of Fine Particles on Surfaces . Aerosol Sci. Technol. , 7 : 161 – 176 .
- Russ , J. R. 1995 . The Image Processing Handbook , 417 – 446 . Boca Raton, FL : CRC Press .
- Schlichting , H. 1955 . Boundary Layer Theory , 483 – 506 . New York : Pergamon Press .
- Settles , G. S. 2001 . Schlieren and Shadowgraph Techniques , 28 Berlin : Springer .
- Smedley , G. T. , Phares , D. J. and Flagan , R. C. 1999 . Entrainment of Fine Particles from Surfaces by Gas Jets Impinging at Normal Incidence . Experiments in Fluids , 26 : 324 – 334 .
- Smedley , G. T. , Phares , D. J. and Flagan , R. C. 2001 . Entrainment of Fine Particles from Surfaces by Gas Jets Impinging at Oblique Incidence . Experiments in Fluids , 30 : 135 – 142 .
- Verkouteren , J. R. 2007 . Particle Characteristics of Trace High Explosives: RDX and PETN . J. Forensic Sci. , 52 ( 2 ) : 335 – 340 .
- Zimon , A. D. 1982 . Adhesion of Dust and Powder , 307 – 325 . New York : Consultants Bureau .
