Abstract
We conducted a numerical simulation to quantify the number of particles emitted from a nurse that will enter the breathing zone or reach the body surface of a patient during patient care in an ISO Class-5 single-bed protective environment. Nurses may be the most likely source of infection for patients in this environment as they are typically single-bed rooms and visitors are forbidden. Four scenarios representing common nurse–patient interactions in a hospital protective environment were analyzed: a nurse standing next to a reclining patient; a nurse leaning over a reclining patient; a nurse standing next to an upright sitting patient and a nurse learning over an upright sitting patient. We applied computational fluid dynamics (CFD) methods to solve the governing equations of air flow, energy, and dispersion of different-sized airborne particles. We also carried out full-scale measurements in a hospital-based ISO Class-5 protective environment to validate simulations and determine the probability that particles emitted from the nurse's body will enter the patient's breathing zone or reach the patient's body surface. Our results indicate that particle dispersion is greatly influenced by the protective environment's downward air flow pattern. Particles from the body of a standing nurse seldom reach the patient, whereas particles are more likely to contact the patient in cases where the nurse is leaning over the patient. These results are useful for developing best practices for preventing cross-infection during patient care, particularly among immunocompromised patients.
1. INTRODUCTION
The design and maintenance of indoor environments and ventilation systems that can control transmission of airborne infectious diseases are important aspects of infection control and patient safety in health care facilities. Air flow pattern is believed to play an important role in airborne infectious disease outbreaks in hospital rooms (CitationLi et al. 2005, Citation2007). As air flow pattern is largely determined by ventilation strategy, it is reasonable to suggest that use of a proper ventilation system can reduce the risk of cross-infection in hospitals. Current guidelines recommend use of downward ventilation systems in airborne infection isolation rooms (ASHRAE 2003; CDC 2003). The basic function of this design is to supply clean air from a ceiling diffuser at a low velocity. The diffuser typically emits cooler, heavier clean air that presses down pollutants to floor level outlets. The “laminar” (i.e., unidirectional) air stream is expected to reduce flow mixing and thus minimize the risk of cross-infection.
A specialized patient-care area, or “protective environment,” with a positive air flow relative to the corridor (i.e., air flows from the room into the outside adjacent space) is needed to prevent infections, particularly patients whose immune mechanisms are compromised because of immunologic disorders (e.g., human immunodeficiency virus (HIV), infection, or congenital immune deficiency syndrome), chronic diseases (e.g., diabetes, cancer, emphysema, or cardiac failure) or immunosuppressive therapy (e.g., radiation, cytotoxic chemotherapy, anti-rejection medication, or steroids) (CitationCDC, 2003). An ISO Class-5 clean room is one type of protective environment for these patients. Twenty ISO Class-5 clean rooms were built in the Chinese PLA General Hospital in Beijing in an attempt to produce a safer patient environment.
Several studies have evaluated the performance of downward ventilation systems in reducing the risk of cross-infection in hospitals (CitationChow and Yang 2005; CitationKao and Yang 2006; CitationCheong and Phua 2006; CitationQian et al. 2008; CitationWalker et al. 2007; CitationBeggs et al. 2008). However, few address the potential risk of patient infection attributable to airborne particles from health care professionals during patient care. A positive pressure environment provides a protective setting for immunocompromised and other high risk patients (i.e., transplant recipients and post-intensive chemotherapy) through its safe ventilation design and air cleaning treatment during which airborne fungal spores can effectively be filtered by the HEPA air filtration system. Nurses may be the most likely source of infection in an ISO Class-5 protective environment since they are typically single-bed rooms and visitors are forbidden.
Our study aims to quantify the number of airborne particles emitted from a nurse that enter the breathing zone or contact the body surface of a patient in a single-bed protective environment. This research is an important first step in understanding the potential risk of patient infection attributable to airborne particles from health care providers in this setting. We chose to study the downward ventilation system because of its established efficacy and widespread use in airborne infection protective environments. Previous studies suggest that engineering simulations using computational fluid dynamics (CFD) are a valid method for investigating air flow behavior, temperature distribution and contaminant dispersion in hospital rooms using different ventilation systems (CitationChow and Yang 2005; CitationKao and Yang 2006; CitationCheong and Phua 2006; CitationQian et al. 2006; CitationQian et al. 2008; CitationBeggs et al. 2008; CitationChao et al. 2008; CitationRichmond-Bryant 2009). Further, many studies apply CFD for airborne particle transport simulations in indoor environments (CitationGao et al. 2008; CitationLai and Cheng 2007; CitationLai et al. 2008; CitationZhang and Chen 2007). We therefore used CFD methods to analyze the dispersion of different sized airborne particles emitted from nurses when caring for a patient in a single-bed hospital protective environment. We also performed full-scale measurements in an ISO Class-5 protective environment to validate the CFD simulations.
Based on results from a survey of health professionals, we determined four of the most commonly reported nurse–patient interaction scenarios: a reclining patient and standing nurse; a reclining patient and leaning nurse; an upright sitting patient and standing nurse and an upright sitting patient and leaning nurse. As health care providers are required to wear surgical masks inside a protective environment, we did not analyze exhaled droplets in this study. We instead concentrated on non-evaporating particles (i.e., inertial particles) adhering to the nurse's head and body. We calculated the probability that these particles would enter the breathing zone or body surface of the patient by simulating particle dispersion when using downward ventilation in a single-bed ISO Class-5 protective environment.
2. NUMERICAL METHODS
2.1. Air Flow Models
Particle motion is determined by various forces exerted from air flow and gravity, so it is important to accurately simulate the air flow field. In this study, we adopted the RNG k-ϵ turbulence model as previous studies suggest that it is suitable for indoor air flow simulation among several widely-used k-ϵ turbulence models (CitationChen 1995). We used the Fluent CFD program to solve the governing equations for fluid flow (CitationFluent Inc. 2005). We conducted a grid independence test by calculating the same mode with finer grids until the calculated results yielded only very small changes during simulations. The tested grid densities and their relative errors for the four scenarios are shown in . Using the Richardson extrapolation method (CitationRichardson 1910) as recommended by CitationRoache (1994), we calculated the grid convergence index (GCI) to determine the relative error of the grid independence test.
TABLE 1 Information on the four nurse–patient interaction scenarios
2.2. Particle Dispersion Models
The Eulerian and Lagrangian models are two of the most commonly used methods for calculating indoor particle dispersion. Recent studies demonstrate the successful application of these two approaches in simulating airborne particle transport in similar indoor environments (CitationGao et al. 2008; CitationLai and Cheng 2007; CitationLai et al. 2008; CitationZhang and Chen 2007; CitationZhao et al. 2008). For the purpose of our study, it is appropriate to use the Lagrangian approach, which tracks the particle trajectory, as shown by CitationChao et al. (2008) and CitationZhao et al. (2008).
The trajectory of each particle can be calculated using the momentum equation based on Newton's law:
The drag force follows the Stokes drag law for small Reynolds number (Re < 1) cases:
Results from CitationZhao et al. (2004) indicate that, for fine indoor particles, forces such as the Basset history, pressure gradient and virtual mass are negligible when compared with the drag force. In contrast, the Saffman lift force may be relatively large near a room's wall. Thus, we included the latter force in our study.
Turbulent dispersion of particles was modeled using a stochastic discrete-particle approach where the trajectory equations for individual particles are predicted by integrating the trajectory equations with the instantaneous fluid velocity, ![]() a
+
a
+ ![]() a
′. The time-averaged velocity of the air,
a
′. The time-averaged velocity of the air, ![]() a
, is computed by solving the Reynolds Averaged Navier Stokes (RANS) equation with the RNG k-ϵ turbulence model. Instantaneous velocity (
a
, is computed by solving the Reynolds Averaged Navier Stokes (RANS) equation with the RNG k-ϵ turbulence model. Instantaneous velocity (![]() a
′) is determined by applying the discrete random walk model (DRW) which assumes that the fluctuating velocities follow a Gaussian probability distribution. The fluctuating velocity components,
a
′) is determined by applying the discrete random walk model (DRW) which assumes that the fluctuating velocities follow a Gaussian probability distribution. The fluctuating velocity components, ![]() a
′, are in the following equation:
a
′, are in the following equation:
We conducted the DRW simulation of particle trajectories using Fluent and then implemented a post-processing program to record the position of each particle for further analysis.
Notably, the fine particles in our study behaved stochastically indoors due to turbulence fluctuation. As mentioned above, we used the DRW model to incorporate the stochastic characteristics of fine particles and subsequently tested different numbers of particle trajectories in the numerical simulation to obtain reliable results. For each simulation, we increased the number of emitted particle trajectories until the results varied little by trajectory number. The results of particle tracking tests in each of the four nurse–patient interaction scenarios are listed in . The relative errors of these tests, ϵp, are calculated by:
The relative errors between different tested particle numbers were less than 0.83%. and show the results as statistical values of the different tested particle numbers.
2.3. Boundary Conditions
For air flow simulation, all variables (air velocity, temperature, turbulent kinetic energy and its dissipation rate) were defined at the supply inlet. Outlet boundary conditions were set as the Neumann boundary condition; that is, mass flow boundaries were specified to ensure that the mass flow rate out of the flow domain corresponded with the mass flow rate into the domain. We applied wall functions to model the near wall turbulence in conjunction with the RNG k-ϵ turbulence model. The walls were stationary and adiabatic since protective environments are always situated within the hospital's inner zone.
During particle dispersion simulation, particles that exit the room subsequently terminate their trajectories. Airborne particles will typically attach to flat, rigid surfaces (CitationHinds 1982). Based on this, our simulation assumes that particles contacting a patient will attach to his or her body surface, corresponding with the “trap” boundary condition for particles reaching a wall.
The geometrical shape and size of particles for the four nurse-patient interaction scenarios are listed in .
3. VALIDATION OF THE NUMERICAL MODEL USING FULL-SCALE MEASUREMENTS
To validate the numerical methods described above, we performed full-scale measurements of air flow and airborne particle dispersion in a hospital-based ISO Class-5 protective environment equipped with a downward ventilation system.
3.1. Experimental Methods
The configuration of the hospital protective environment is shown in . The room is partitioned into two sections: a patient care area and a bathroom. The size of the room is Length × Width × Height = 3.3 m × 3.1 m × 2.5 m. Air is vented into the patient care area through a ceiling opening and vented out through 0.75 m × 0.3 m openings on the bottom of two side walls. A second air supply opening is on the bathroom ceiling and the space between the floor and door separating the two sections also functions as an opening. Clean air is supplied through an inlet with the size of 0.5 m × 0.5 m in the bathroom, creating a wind curtain that stops contaminants from entering the patient care area. To prevent air from flowing out of the bathroom, the patient care area is maintained at a positive pressure (5–10 Pa) using a centrifugal fan that is controlled by a variable frequency driver (VFD). The bathroom's air exhaust vent (0.2 m × 1.8 m) runs downward along the side wall.
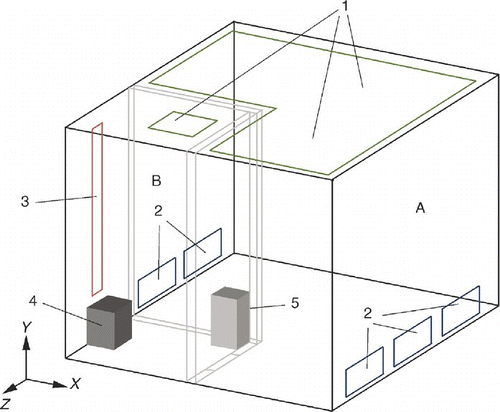
FIG. 1 Layout of the protective environment A: patient care area, B: bathroom, 1: air supply openings, 2: air return openings, 3: air exhaust, 4: toilet, 5: particle generator.
We measured air velocity in the hospital protective environment using hot-sphere anemometers (RHAT-301). The anemometers can measure velocities ranging from 0.05 to 5.00 m/s with a precision of 0.1 m/s (±3%) when velocity is faster than 0.1 m/s, but are less precise when velocity falls below 0.1 m/s. As hospital regulations prohibit the release of particles inside the patient care area, we were limited to measuring particles inside the bathroom. However, as the important characteristics of the downward ventilation system that greatly influence particle dispersion (e.g., the downward air flow and “laminar” streams) in the bathroom are similar to those in the patient care area, we assert that it is reasonable to validate the particle simulation model using measurements conducted inside the bathroom.
We used a condensation mono-disperse aerosol generator (TSI 3475, TSI Inc.) to continuously generate 0.75 μm fine diethylhexyl sebacate (DEHS) particles. The density of generated particles (914 kg/m3) is approximately equal to the density of water; thus, the particle diameter is approximately equal to its aerodynamic diameter.
Two FLUKE 983 optical particle counters (FLUKE Inc.) were used to measure particle concentration. The Fluke 983 simultaneously measures and records six channels of particle sizes (0.3–0.5 μm, 0.5–10.0 μm, 1.0–2.0 μm, 2.0–5.0 μm, 5.0–10.0 μm, and ≥10.0 μm). The counter has a coincidence loss of 5% when the particle concentration is 2,000,000 particles per cubic inch and a 100% counting efficiency when the measured particle diameter is larger than 0.45 μm (Fluke Inc 2005). We calibrated the counter using a Zero Counter Filter prior to each measurement. Since the TSI 3475 aerosol generator produces just one particle size (0.75 μm), the measurements recorded by the optical particle counter's 0.5 μm channel (i.e., the 0.5–1.0 μm diameter range) will be identical to the measured concentration of 0.75 μm particles produced by the generator (CitationFluke Inc. 2005).
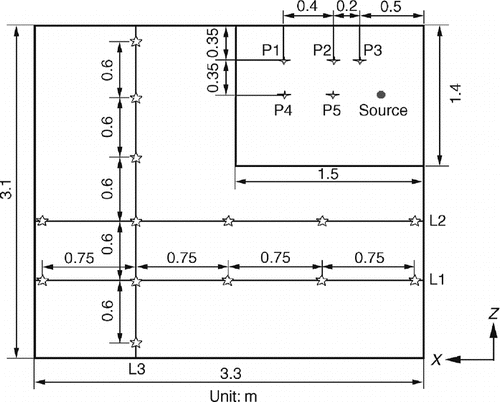
The measurement locations for velocity and particle concentration as well as the location of the particle generator (source) are shown in . The supply air rate was 341 air change per hour (ACH) and the supply air velocity was 0.28 m/s in the patient care area. This falls within the recommended velocity range (0.2–0.5 m/s) for unidirectional ISO Class-5 protective environments set by ISO Standard 14644-4 (2001) and IEST-RP-CC012.1 (1998). The supply air rate was 81 ACH and supply air velocity was 0.33 m/s in the bathroom. Due to the high ventilation rate and low heat generation rate, the temperature difference is negligible and can be treated as isothermal for measurement and validation. To avoid particle resuspension, we resumed measurements approximately 15 min after the technician had exited the room under the assumption that the particle concentration in the test room had returned to a constant level.
FIG. 2 Floor plan of the test points.
3.2. Measured Data and Validation of Simulation
We conducted a grid independence test with the method described in section 2.1 for the validation case. The value of GCI(u) for grid numbers 139,881 and 217,827 was 2.02%, and for gird numbers 217,827 and 258,900 was 0.53%, indicating that the grid number of 217,827 is sufficiently fine for the simulation. Thus, we simulated the tested cases with a grid number of 217,827. For the particle simulation, we increased the number of emitted particle trajectories until the results varied little by the trajectory number. The number of tested particles was 8,000, 10,000, 50,000, and 100,000. The relative error between different tested particle numbers was 0.58%, so the number of particle trajectories was set at 10,000 for the validation case. This corresponds with results from CitationLai and Cheng (2007) which also indicate that a particle number of 10,000 ensures sufficiently small error for indoor particle transport modeling.
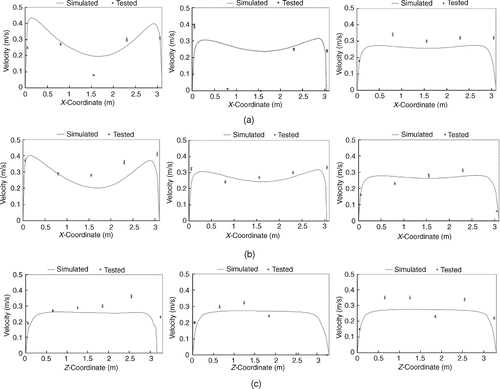
The simulated and tested particle velocities at measurement locations in the room are plotted in . The relative error is less than 10% at most points, indicating that the simulated velocity strongly correlates with the experimental data.
FIG. 3 Comparison of tested and simulated particle velocity at L1, L2, and L3. (a) L1 (Left: height of 0.8 m, Middle: height of 1.2 m, Right: height of 1.6 m). (b) L2 (Left: height of 0.8 m, Middle: height of 1.2 m, Right: height of 1.6 m). (c) L3 (Left: height of 0.8 m, Middle: height of 1.2 m, Right: height of 1.6 m).
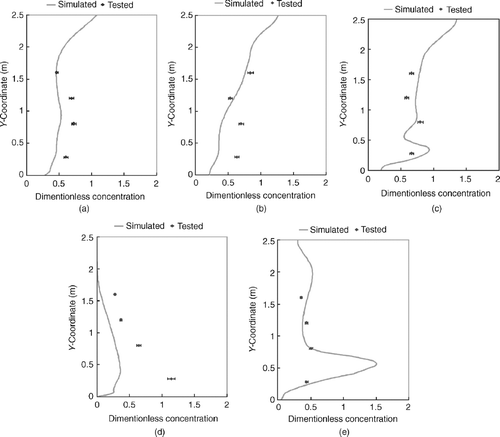
shows the comparison of simulated and tested particle concentrations. The results suggest that the simulation also provides a reasonable prediction of the particle concentration distribution. The simulation for P4 provided considerably lower estimates of particle concentration than the actual measurements, particularly in lower sections of the room. This is due to particle leakage from the connection between the generator and pipe during experiments, which is close to P4. This also resulted in lower predictions for P1 and P2 in the room's lower section. However, as P1 and P2 were located farther away from the leakage area than P4, the influence of the leakage was much smaller on P1 and P2. Still, the simulated prediction of the air flow field and particle distribution in our study is satisfactory and, thus, validates use of the numerical method for simulation of air flow and particle dispersion in similar protective environments.
FIG. 4 Comparison of the simulated and tested dimensionless particle concentration at (a) position P1, (b) position P2, (c) position P3, (d) position P4, (e) position P5. Dimensionless concentration is defined as the local concentration relative to the concentration at the outlet.
4. SCENARIO ANALYSIS
4.1. Scenario Descriptions
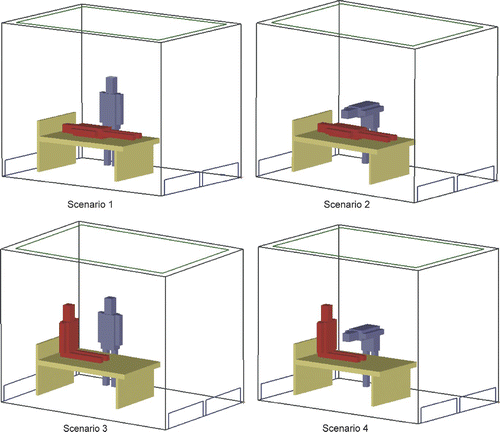
The nurse–patient scenarios used in this study are depicted in . Scenario 1 is a nurse standing next to a reclining patient, scenario 2 is a nurse leaning over a reclining patient, scenario 3 is a nurse standing next to an upright sitting patient and scenario 4 is a nurse learning over an upright sitting patient. provides a detailed description of these four scenarios. It should be noted that we studied the protective environment without a bathroom hereafter. The air flow in the bathroom is always negative and thus has no influence on the patient care area.
FIG. 5 The four simulated nurse–patient interaction scenarios.
We assumed that airborne particles were continuously and uniformly released from the nurse's head and body, excluding the legs. Particles were assumed spherical since it is not difficult to incorporate the dynamic characteristic of non-spherical particles by introducing the “dynamic shape factor” (CitationHinds 1982). Thus, particle diameter can be regarded as aerodynamic with a density of 1000 kg/m3. We studied four groups of particle sizes which are often observed indoors, specifically 0.1 μm, 0.5 μm, 1 μm, and 5 μm. The scenarios are steady-state as particles are assumed to be continuously emitted.
There are two primary routes of patient cross-infection. The first is infection from particles adhering to the patient's body; the second is a respiratory infection from particle inhalation. The probability that a particle will reach the patient's body surface or breathing zone can be analyzed based on the particle's dispersion trajectory.
The breathing zone in this study refers to the roughly 10 cm area around the patient's face. The measurement and simulation results from CitationRichmond-Bryant (2009) show that particle velocity is reduced to 5% of the inhaled velocity inside this zone.
4.2. Results and Analysis
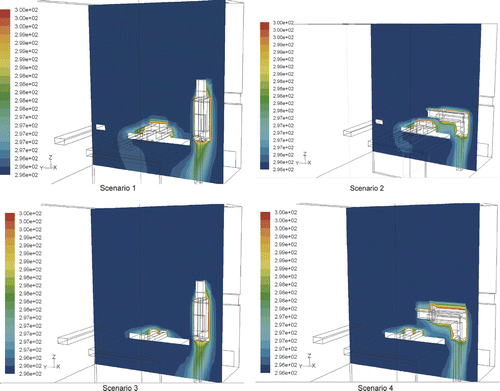
and show the simulated velocity and temperature distribution in the protective environment. It appears that the air flow field is minimally influenced by human bodies and that the temperature difference throughout the room is small. The indoor temperature is almost identical to the supply air temperature, except in areas close to the nurse and patient. This occurs because the ventilation rate is maintained at a high level in the protective environment. The downward air flow functions like a piston by pushing air from the ceiling downward towards the return air outlet and is powerful enough to offset the warm plumes from humans in the room. Thus, both the general velocity and temperature field are similar in the four scenarios, all of which have “laminar” streams. We analyzed particle dispersion as it is greatly influenced by the local air flow pattern around the nurse and patient.
FIG. 6 The velocity vector at plane x = 2.8 m. (Arrow length represents the magnitude of velocity, with scale indicated by the reference bar for 0.2 m/s.)
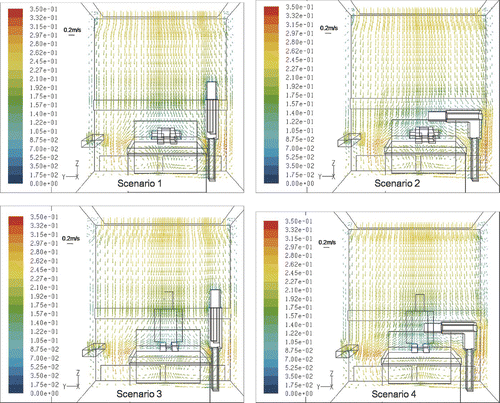
FIG. 7 The temperature distribution at plane x = 2.8 m.
and show the simulated particle distribution near the patient's breathing zone after particles were emitted from the body or head of nurse during the four scenarios. As there was little difference between the results of different particle sizes, we present the results for only one particle size (0.1 μm) during each scenario.
FIG. 8 Particle dispersion near the patient's breathing zone when the nurse's body is the particle source.
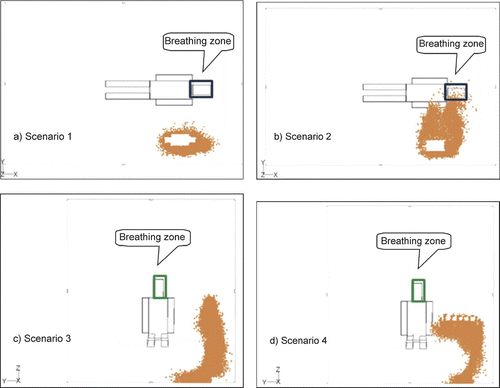
FIG. 9 Particle dispersion near the patient's breathing zone when the nurse's head is the particle source.
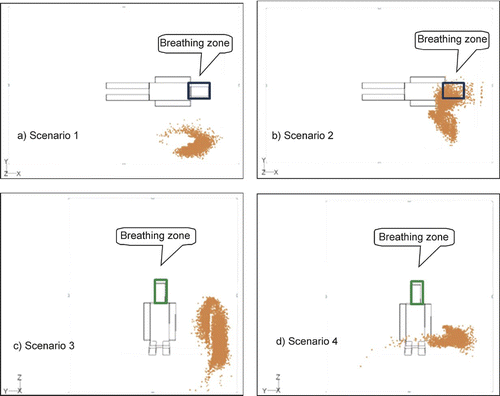
FIG. 10 Percentage of particles entering the breathing zone and reaching the body surface of the patient in scenario 2. (a) Emitted from head; (b) Emitted from body.
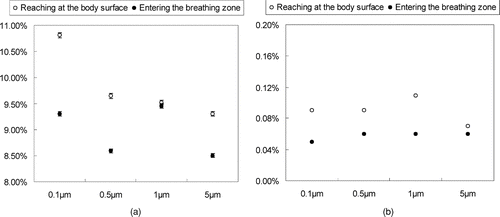
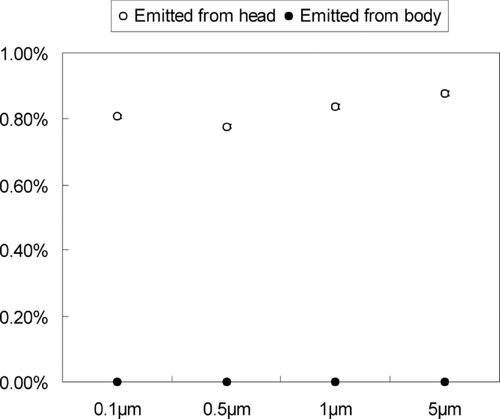
FIG. 11 Percentage of particles reaching the patient's body surface area in scenario 4.
The results indicate that particles enter the patient's breathing zone only in scenario 2 ( and ). In scenario 1 (, ) and scenario 3 (, ) where the nurse is standing, the air flow passes the nurse and moves down to the return outlet without exposing the patient (). For this reason, particles do not enter the patient's breathing zone in either scenario. During scenario 4 (, ), particles again miss the breathing zone since it is higher than the particle source (i.e., the nurse's head or body) and the air is flowing downward. However, some particles will attach to the section of the patient's body surface that is positioned lower than the particle source.
Comparisons of the distribution of different-sized particles yielded similar results. According to previous studies by CitationMurakami et al. (1992) and CitationZhao and Wu (2005), the dispersion characteristic is not affected by particle size if both the particle relaxation time and ventilation nominal time (the ratio of the room volume to the ventilation rate) are sufficiently short. The nominal time in our study is very short due to the rapid ventilation rate and a short relaxation time for particles smaller than 10 μm. Thus, it is not surprising that we observed little difference between the dispersion of different sized particles. Instead, we found that the combination of a strong downward air flow with little cross air flow was the largest determinant of particle dispersion.
shows the percentage of particles that either enter the breathing zone or attached to the patient's body surface during scenario 2. This percentage can be regarded as the probability of particles entering the breathing zone or reaching the body surface given that we performed a DRW simulation of particle trajectories that accounted for the effect of turbulent fluctuating velocity on particle dispersion. shows the percentage of particles that will reach the patient's body surface during scenario 4. The percentage is 0 during scenarios 1 and 3 since no particles come into contact with the patient when the nurse is standing upright during patient care. The percentage is also 0 in scenario 4 where the downward air flow pushes particles directly to the floor without contacting the patient. indicates that, in scenario 2 (nurse leaning over a reclined patient), particles emitted from the nurse's head are more likely to enter the breathing zone than those emitted from the body. These results were not sensitive to particle size as different-sized particles emitted from the nurse have almost the same probability of entering the patient's breathing zone.
shows that the particles emitted from nurse's head have a higher probability of contacting the patient's breathing zone or body surface when compared with particles from the nurse's body. This suggests that the particle dispersion for all particle sizes studied here is primarily determined by the local air flow pattern in this type of indoor environment. shows that only particles from the nurse's head can contact the body surface of the patient in scenario 4. As with scenario 2, these results did not change when we stratified the analysis by particle size. This again highlights the strong influence of the local air flow pattern on particle fate and transport. A larger proportion of particles will enter the breathing zone or reach the body surface of the patient during scenario 2 as compared with the other scenarios analyzed in this study.
5. DISCUSSION
Compared with previous studies on computational fluid dynamics (CFD) used in medical settings, this study presents a different perspective on airborne particle transport. Most existing studies evaluate methods for reducing cross-infection of airborne particles emitted by the patient to other individuals. For example, CitationCheong and Phua (2006) investigated airflow and pollutant distribution patterns in a “negative pressure” isolation room by means of objective measurement and CFD modeling using three ventilation strategies. CitationRichmond-Bryant (2009) examined which characteristics of particle spatial velocity and concentration profile impact health care workers' exposure to a pathogenic agent in an airborne infection isolation room. To minimize risk of cross-infections in hospital wards, CitationQian et al. (2006, Citation2008) studied the dispersion of exhaled droplet nuclei in a two-bed hospital ward using three different ventilation systems. CitationChow and Yang (2005) investigated the effectiveness of ultra-clean “laminar” air flow units in protecting the surgical team against bacterial infection from a patient's wound site and in preventing postoperative patient infection from bioaerosols emitted from the surgical staff. However, this study focused exclusively on operating rooms.
The present study focuses on how the airborne particles emitted from health care professionals may infect patients, particularly in a positive pressure environment with high level cleanliness (ISO Class-5). Health care professionals may be the most likely source of infection in this environment. It provides a protective environment for immunocompromised and other high risk patients through its safe ventilation design and air cleaning treatment. This unique perspective on airborne particle transport is intended to direct attention to the potential risk of patient infection attributable to airborne particles from health care professionals.
In this study, we assume that particles are uniformly emitted from the body or head of nurses. We also assume that the initial velocity of nurses' expiration is extremely small because they always wear a mask in the protective environment. Therefore, the impact of breathing airflow on the particle dispersion is negligible compared with the scenarios where the particles are uniformly emitted from the nurse's body or head. Similarly, CitationXie et al. (2007) found that the impact of breathing airflow on particle dispersion was not significant when particle diameter is less than 10 μm. The main objectives and hypothesis of this study were conceived by hospital-based physicians and based on a set of commonly-observed nurse–patient interactions during which the above assumptions can reasonably hold. However, we acknowledge that various behavioral factors may limit the validity of these assumptions in the protective environment. Many previous studies indicate that exhaled airflow must be accounted for when the exhaled behavior is a cough or sneeze (CitationZhao et al. 2005; CitationZhu et al. 2006; CitationLai and Cheng 2007; CitationXie et al. 2007; CitationChao et al. 2008; CitationRichmond-Bryant 2009).
In addition, we modeled scenarios 2 and 4 with a nurse leaning over the patient at a 90 degree angle; however, we recognize that this angle may vary during patient care. The influence of a wider range of nurse and patient behaviors on particle dispersion is an important issue requiring further study.
Despite these limitations, however, this study is an important first step in understanding the potential risk of patient infection attributable to airborne particles from health workers. Additional health studies are needed to understand the probability of infection from particles entering the patient's breathing zone or contacting their body surface.
5. CONCLUSIONS
We used three-dimensional CFD methods to solve the governing equations of air flow, energy and dispersion of different sized airborne particles. After validating the CFD calculation by comparing the simulated velocity and particle concentration with measured data, we numerically assessed four nurse–patient interaction scenarios using CFD. The following conclusions can be drawn from this study:
-
Where the nurse is standing (scenarios 1 and 3) or leaning over an upright-sitting patient (scenario 4), very few particles emitted from the nurse will enter into the patient's breathing zone. When the nurse leans over a reclined patient (scenario 2), the particles emitted from the nurse's head have a greater probability of entering the patient's breathing zone than do particles from the nurse's body. Analysis of particles of different sizes did not change these results.
-
Where the nurse is standing during patient care (scenarios 1 and 3), few emitted particles eventually contact with patient's body. In scenario 4, it is unlikely that particles emitted from the nurse's body will reach the patient's body surface; 5 μm particles have the greatest probability of doing so while 0.5 μm particles have the lowest. In scenario 2, 1 μm particles emitted from the nurse have the greatest probability of reaching the patient's body surface, whereas 5 μm particles have the lowest. The 0.1 μm particles emitted from the nurse's head have the highest probability of reaching the patient's body surface, whereas 5 μm particles have the smallest.
-
When providing patient care, a behavioral intervention for preventing cross-infection of airborne particles is for the nurse to avoid leaning over the patient. If the nurse must lean over the patient during care, an effort should be made to keep his or her position lower than the patient's breathing zone.
This study was supported by a grant from the National Key Technology Research and Development Program of China, Project No. 2006BAJ02A10. The comments and edits made by Jill Baumgartner are highly appreciated.
Related Research Data
REFERENCES
- ASHRAE . 2003 . HVAC Design Manual for Hospitals and Clinics , Atlanta, GA : American Society of Heating Refrigerating and Air-Conditioning Engineers Inc .
- Beggs , C. B. , Kerr , K. G. , Noakes , C. J. , Hathway , E. A. and Sleigh , P. A. 2008 . The Ventilation of Multiple-Bed Hospital Wards: Review and Analysis . Amer. J. Infect. Control , 36 : 250 – 259 .
- CDC . 2003 . Guidelines for Environmental Infection Control in Health-Care Facilities , Atlanta, GA : US Department of Health and Human Services, Public Health Service, Centers for Disease Control and Prevention .
- Chao , C. Y. H. , Wan , M. P. and Sze To , G. N. 2008 . Transport and Removal of Expiratory Droplets in Hospital Ward Environment . Aerosol Sci. Technol. , 42 : 377 – 394 .
- Chen , Q. 1995 . Comparison of Different k-ϵ Models for Indoor Airflow Computations . Numerical Heat Transfer, Part B, Fundamentals , 28 : 353 – 369 .
- Cheong , K. W. D. and Phua , S. Y. 2006 . Development of Ventilation Design Strategy for Effective Removal of Pollutant in the Isolation Room of a Hospital . Building and Environ. , 41 : 1161 – 1170 .
- Chow , T. T. and Yang , X. Y. 2005 . Ventilation Performance in the Operating Theatre Against Airborne Infection: Numerical Study on an Ultra-Clean System . J. Hospital Infect. , 59 : 138 – 147 .
- Fluent Inc. 2005 . Fluent 6.2 User's Guide , Lebanon, NH : Fluent Inc .
- Fluke Inc. 2005 . Manual for Fluke 983 Optical Particle Counter
- Hinds , W. C. 1982 . Aerosol Technology: Properties, Behavior, and Measurement of Airborne Particles , New York : Wiley .
- Gao , N. P. , Niu , J. L. and Morawska , L. 2008 . Distribution of Respiratory Droplets in Enclosed Environments Under Different air Distribution Methods . Building Simulation: An Intl J. , 1 : 326 – 335 .
- 1998 . Considerations in Cleanroom Design , Rolling Meadows, IL : The Institute of Environmental Sciences and Technology . IEST-RP-CC012.1
- 2001 . Cleanrooms and Associated Controlled Environments Part 4: Design, construction, and start-up , Geneva, , Switzerland : International Organization for Standardization . ISO 14644-4
- Kao , P. H. and Yang , R. J. 2006 . Virus Diffusion in Isolation Rooms . J. Hospital Infect. , 62 : 338 – 345 .
- Lai , A. C. K. and Cheng , Y. C. 2007 . Study of Expiratory Droplet Dispersion and Transport Using a New Eulerian Modeling Approach . Atmos. Environ. , 41 : 7473 – 7484 .
- Lai , A. C. K. , Wang , K. and Chen , F. 2008 . Experimental and Numerical Study on Particle Distribution in a Two-Zone Chamber . Atmos. Environ. , 42 : 1717 – 172 .
- Li , Y. , Huang , X. , Yu , I. T. S. , Wong , T. W. and Qian , H. 2005 . Role of Air Distribution in SARS Transmission During the Largest Nosocomial Outbreak in Hong Kong . Indoor Air , 15 : 83 – 95 .
- Li , Y. G. , Leung , G. M. , Tang , J. W. , Yang , X. , Chao , C. Y. H. , Lin , J. Z. , Lu , J. W. , Nielsen , P. V. , Niu , J. L. , Qian , H. , Sleigh , A. C. , Su , H. J. J. , Sundell , J. , Wong , T. W. and Yuen , P. L. 2007 . Role of Ventilation in Airborne Transmission of Infectious Agents in the Built Environment—A Multidisciplinary Systematic Review . Indoor Air , 17 : 2 – 18 .
- Murakami , S. , Kato , S. , Nagano , S. and Tanaka , Y. 1992 . Diffusion Characteristics of Airborne Particles with Gravitational Settling in a Convection-Dominant Indoor Flow Field . ASHRAE Transactions , 98 : 82 – 97 .
- Qian , H. , Li , Y. , Nielsen , P. V. and Hyldgaard , C. E. 2008 . Dispersion of Exhalation Pollutants in a Two-Bed Hospital Ward with a Downward Ventilation System . Building and Environ. , 43 : 344 – 354 .
- Qian , H. , Li , Y. , Nielsen , P. V. , Hyldgaard , C. E. , Wong , T. W. and Chwang , A. T. Y. 2006 . Dispersion of Exhaled Droplet Nuclei in a Two-Bed Hospital Ward with Three Different Ventilation Systems . Indoor Air , 16 : 111 – 128 .
- Richardson , L. F. 1910 . The Approximate Arithmetical Solution by Finite Differences of Physical Problems Involving Differential Equations, with an Application to the Stresses in a Masonry Dam . Philosophical Transactions of the Royal Society of London , 210 ( A ) : 307 – 357 .
- Richmond-Bryant , J. 2009 . Transport of Exhaled Particulate Matter in Airborne Infection Isolation Rooms . Building and Environ. , 44 : 44 – 55 .
- Roache , P. J. 1994 . Perspective: A Method for Uniform Reporting of Grid Refinement Studies . ASME J. Fluids Engineer. , 116 : 405 – 413 .
- Walker , J. T. , Hoffman , P. , Bennett , A. M. , Vos , M. C. , Thomas , M. and Tomlinson , N. 2007 . Hospital and Community Acquired Infection and the Built Environment Design and Testing of Infection Control Rooms . J. Hospital Infect. , 65 ( S2 ) : 43 – 49 .
- Xie , X. , Li , Y. , Chwang , A. T. Y. , Ho , P. L. and Seto , W. H. 2007 . How Far Droplets can Move in Indoor Environments—Revisiting the Wells Evaporation-Falling Curve . Indoor Air , 17 : 211 – 225 .
- Zhang , Z. and Chen , Q. 2007 . Comparison of the Eulerian and Lagrangian Methods for Predicting Particle Transport in Enclosed Spaces . Atmos. Environ. , 41 : 5236 – 5248 .
- Zhao , B. and Wu , J. 2005 . Numerical Investigation of Particle Diffusion in Clean Room . Indoor and Built Environ. , 14 : 469 – 479 .
- Zhao , B. , Yang , C. , Yang , X. and Liu , S. 2008 . Particle Dispersion and Deposition in Ventilated Rooms: Testing and Evaluation of Different Eulerian and Lagrangian Models . Building and Environ , 43 : 388 – 397 .
- Zhao , B. , Zhang , Y. , Li , X. , Yang , X. and Huang , D. 2004 . Comparison of Indoor Aerosol Particle Concentration and Deposition in Different Ventilated Rooms by Numerical Method . Building and Environ. , 39 : 1 – 8 .
- Zhao , B. , Zhang , Z. and Li , X. 2005 . Numerical Study of the Transport of Droplets or Particles Generated by Respiratory System Indoors . Building and Environ , 40 : 1032 – 1039 .
- Zhu , S. , Kato , S. and Yang , J. H. 2006 . Study on Transport Characteristics of Saliva Droplets Produced by Coughing in a Calm Indoor Environment . Building and Environ , 41 ( 12 ) : 1691 – 1702 .