Abstract
The Sunset Laboratory Carbon Aerosol Analysis Lab Instrument is widely used for thermal-optical analysis (TOA) of ambient particulate matter samples to measure total carbon (TC), organic carbon (OC), and elemental carbon (EC), and often thermal sub-fractions of OC and EC. TOA operating protocols include a series of plateau temperatures at which the thermal sub-fractions evolve. The temperatures have conventionally been measured by a sensor located in the sample oven but away from the filter sample. However, the TOA protocol used by the Interagency Monitoring of Protected Visual Environments (IMPROVE) network and recently adopted by the U.S. Environmental Protection Agency (EPA) Speciation Trends Network (STN) and Chemical Speciation Network (CSN) specify temperatures to be achieved at the filter. Our goal was to develop a simple calibration method to obtain the target filter temperatures in a Sunset Instrument. This method showed good agreement with the IMPROVE/STN/CSN method and has the advantages of not damaging oven components and of providing a direct comparison of sample oven sensor and filter temperatures at the TOA protocol-specified temperatures. Calibrations performed on four Sunset Instruments yielded different sensor/filter temperature relationships. Ambient PM 2.5 samples analyzed using IMPROVE_A temperatures at the oven sensor compared to IMPROVE_A temperatures at the filter yielded statistically insignificant differences for TC, OC, and EC but statistically significant differences for the carbon sub-fraction concentrations. Temperature calibrations should be performed on each Sunset Instrument to ensure comparability in the carbon sub-fractions being reported, and a simple method has been provided for performing these calibrations.
1. INTRODUCTION
Thermal and thermal-optical methods are commonly used to quantify the total carbon (TC) mass in ambient particulate matter samples and to characterize that carbon into various classes such as organic carbon (OC), elemental carbon (EC), carbonate carbon, and in some cases also more refined thermal sub-fractions of OC and EC (CitationBirch et al. 1996; CitationCachier et al. 1989a; CitationCachier et al. 1989b, CitationChow et al. 1993; CitationSchauer et al. 2003). Total carbon on the filter is a conserved quantity and the various thermal and thermal-optical methods should be equivalent for TC if they can evolve all the carbon from the filter and measure that carbon with 100% efficiency. However, the classification of TC into OC and EC (and sub-fractions of OC and EC) is operationally defined by the specific instrument design and operating protocol. For example, the NIOSH 5040 (CitationNIOSH 1996) and Interagency Monitoring of Protected Visual Environments (IMPROVE) (CitationDRI Standard Operating Procedure, 2008) methods for measuring OC and EC are distinguished by different time-temperature protocols, different approaches to determine the OC/EC split by optical measurement (transmittance versus reflectance), and different hardware configurations (CitationWatson et al. 2005). In addition, the relatively new IMPROVE_A temperature protocol (a modification to the original IMPROVE Method, CitationDRI Standard Operating Procedure, 2008) approved for use in the IMPROVE network and in the U.S. Environmental Protection Agency Speciation Trends Network (STN) and Chemical Speciation Network (CSN), is the first thermal-optical analysis method that requires a calibration be developed to obtain the relationship between the sample oven sensor temperature and the filter temperature so that the temperatures specified in the protocol are obtained at the filter.
Typically, the sample oven temperature is measured in thermal-optical instruments using a temperature sensor near, but not precisely at, the particle-laden filter (called the filter herein). However, temperature variability within the oven may produce a different temperature at the filter than at the temperature sensor. CitationChow et al. (2005) investigated relationships between sample oven temperature sensor measurements and filter temperatures in three thermal-optical instruments—the OGC/DRI Thermal/Optical Carbon Analyzer, the DRI Model 2001 Thermal/Optical Carbon Analyzer, and the Sunset Laboratory Carbon Aerosol Analysis Lab Instrument (called Sunset Instrument herein). These instruments have different hardware configurations ( in CitationChow et al. 2005) including the placement of the temperature sensor relative to the filter. Sample temperatures were characterized using temperature-indicating materials (Tempilaq° G) that melt and change optical properties at specified temperatures which can be detected by the instrument's optical measurement system. Five OGC/DRI Analyzers, five DRI Model 2001 Analyzers, and one Sunset Instrument were calibrated using six Tempilaq° G indicators that spanned the operating temperature range of the instruments. The calibrations showed that the sensor and filter temperatures were not equal (most had slopes different from unity and non-zero intercepts) and that the differences between the sample and sensor temperatures were not consistent within a given instrument type (i.e., the five OGC/DRI Analyzers had different calibration lines). Accurate measurement of the filter temperature in both the OGC/DRI and DRI Model 2001 Instruments revealed differences that motivated the adoption of the “IMPROVE_A” temperature protocol for routine carbon analysis of IMPROVE network samples in order to preserve method continuity as the OGC/DRI Instruments were phased out and replaced by the DRI Model 2001 Instruments (CitationChow et al. 2007). CitationChow et al. (2005) analyzed five ambient filter samples using a DRI Model 2001 Analyzer with a punch from each filter analyzed using the IMPROVE_A protocol temperatures at the sample oven temperature sensor (un-calibrated temperatures) and another punch from each filter analyzed using IMPROVE_A protocol temperatures at the filter (calibrated temperatures). TC, OC, and EC were not changed by the calibration but OC and EC sub-fractions were different. Thus, CitationChow et al. (2005) provide evidence that calibration of the temperature sensor in each thermal-optical instrument is important because the sample oven sensor temperature differs from the filter temperature, the filter/sensor temperature relationship can be different between instruments and the filter/sensor temperature differences can be large enough to produce differences in the reported carbon sub-fraction concentrations.
TABLE 1 The IMPROVE_A carbon sub-fraction measurement conditions including the target filter temperatures and the sample oven sensor setpoint temperatures (TSETPOINT) for the UCD Sunset Analyzer (S/N 119) that produce the IMPROVE_A temperatures at the filter
Calibration with Tempilaq° G liquids has several disadvantages. The Tempilaq° G ruins all quartz surfaces (sample oven, sample boat), poisons the catalyst in the oxidation oven, and contaminates downstream components. As a result, during Tempilaq° G calibration, a back-up oxidation oven with no catalyst is installed and the oven is vented directly to a hood to confine the damage to just the quartz components. Tempilaq° G materials are available at numerous melting temperatures but are not available for the precise filter target temperatures of the IMPROVE_A protocol. Thus, the filter/sensor calibration cannot be verified at the IMPROVE_A temperatures.
In this work, we developed and implemented an alternative temperature calibration procedure for the Sunset Instrument that did not damage any instrument components and was performed with the instrument configuration used for filter sample analysis. A temperature probe was designed and constructed to measure the temperature at the filter. Filter temperature measurements were conducted using both the probe and the Tempilaq° G method to ensure the two methods gave comparable results. Calibrations were performed with the instrument at operating conditions (e.g., gases flowing) to determine the filter/sensor temperature relationship over the entire instrument operating range. Ambient particulate matter samples were analyzed using the IMPROVE_A protocol (to the extent practicable on a Sunset Instrument) to determine whether the carbon concentrations assigned to TC, OC, EC, and their sub-fractions were different when achieving the protocol setpoint temperatures at the filter compared to at the sensor.
2. METHODS
2.1. Temperature Probe for the Sunset Instrument
A temperature probe was designed and constructed to directly measure the temperature at the filter in a Sunset Instrument. The probe was assembled from two components: a modified quartz boat handle/quartz oven cap to accommodate an external thermocouple and a temperature measurement and logging device.
shows the quartz boat handle and cap used during filter sample analysis. The role of the quartz handle is to load the filter into the oven and position it such that a laser beam, used to track the pyrolysis of carbon during analysis, passes through the filter. The modified quartz boat handle/quartz oven cap () enables an external thermocouple to be installed such that the thermocouple tip just touches the filter while maintaining the functionality of the original components. The modifications made to the original handle were the substitution of the solid-shaft with a hollowed-shaft that has two 0.025 inch diameter fissures where two thermocouple wires of 0.020 inch diameter are inserted, welded and positioned so the tip just touches the top of the filter sample. The thermocouple wires were type-K unshielded, the same type used for the temperature sensor in the sample oven. In the same manner as the original quartz boat (which holds the filter) quartz beads were placed on the boat to keep the filter in place during analysis. The same size filter samples should be used during the calibration procedure and during sample analysis. In this study, 0.5 cm2 circular punches were used. Gas flow through the system was the same during calibration and during sample analysis (). All down-stream components such as the oxidation oven were not modified during the calibration procedure.
FIG. 1 (a) The sample analysis configuration and (b) the temperature calibration configuration of a Sunset Laboratory Carbon Aerosol Analysis Lab Instrument. The temperature calibration apparatus consists of a modified quartz boat handle and quartz cap, which enables a thermocouple to be placed at the filter sample while maintaining the functionality of the original components. Details of the modification are labeled in blue in .
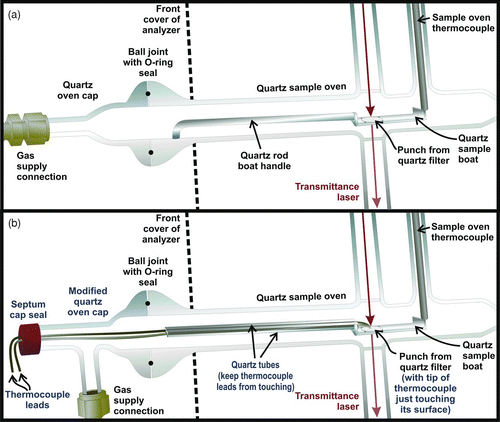
The temperature probe data were obtained using a NIST Traceable Digital Thermometer with Recordable Output (Fisher Scientific, Model 15–078-38) and a data logger (METEX Instrument, Model ME31). Temperature data were recorded every four seconds with a resolution of 0.1°C. The temperature probe thermocouple range are between −200°C and 1370°C with an accuracy of ±2%. The temperature probe can be readily inserted into the oven to measure the filter sample temperatures and was used with the temperature calibration procedure described in next section. The probe was not used during carbon analysis of filters.
For the temperature measurements discussed below, the following two definitions are used. The setpoint temperatures, TSETPOINT, are the temperatures that are programmed into the Sunset Instrument to control the sample oven sensor temperature. When the sample oven is at steady-state, the sample oven temperature (as measured by the sample oven sensor) is at TSETPOINT. TFILTER is the temperature measured at the filter. TFILTER is the average of the temperature readings obtained by the temperature probe when the sample oven sensor thermocouple and the temperature probe thermocouple responses are stable.
2.2. Method to Compare Filter Temperature Measurements Obtained Using an External Thermocouple and Tempilaq° G
A DRI Model 2001 Analyzer (Atmoslytic, Inc., S/N 005069), the type of thermal-optical instrument used to analyze IMPROVE network samples, was used to determine whether measuring the filter temperature using an external thermocouple located at the filter and the Tempilaq° G method (CitationDRI Standard Operating Procedure, 2008, CitationChow et al. 2005) provide comparable temperature calibration results. The DRI Model 2001 Analyzer was used to make this comparison because it is the instrument referenced in the CitationDRI Standard Operating Procedure (2008) that describes the Tempilaq° G method. It was not repeated on a Sunset Instrument because of the damage the Tempilaq° G causes to the instrument. A brief description of the Tempilaq° G method is given below. Further details are available in the CitationDRI Standard Operating Procedure (2008).
The DRI Model 2001 Analyzer was modified by removing the catalyst from the oxidation oven and venting the oven directly to a fume hood to minimize damage from the Tempilaq° G. Six NIST Traceable Tempilaq° G liquids that change optical properties at temperatures of 121°C, 184°C, 253°C, 510°C, 704°C, and 816°C with reported accuracy of ±1% were used to calibrate the instrument. Temperature calibration sandwiches for each Tempilaq° G liquid were prepared by placing a layer of Tempilaq° G on top of a quartz disc and then covering the Tempilaq° G with half-thickness punch from a quartz (Pall) filter. Each Tempilaq° G sandwich was analyzed using a temperature profile (TSETPOINT and time increments) developed specifically for that Tempilaq° G liquid. The profiles slowly incremented the temperature in a narrow range near the temperature of the optical change for the specific Tempilaq° G liquid to accurately determine the sensor temperature coincident with the change in transmittance and reflectance arising from the Tempilaq° G change. Three runs were conducted for each of the six Tempilaq° G liquids. The sample oven temperature values for the Tempilaq° G change were regressed on the corresponding quoted Tempilaq° G temperatures. Sample oven temperature sensor (TSETPOINT) values that correspond to IMPROVE_A temperatures at the filter were calculated from the regression.
The DRI Model 2001 Analyzer was returned to its original configuration with the catalyst in the oxidation oven and the oven connected to the rest of the instrument. A thermometer/datalogger (Omega OMEGAETTE® HH306) with a Type K thermocouple, which were calibrated together to NIST traceable standards, was installed in the upper arm of the quartz oven through a quartz tube of the same outside diameter (3 mm) as the upper quartz light pipe so that the thermocouple tip was just touching the filter sample. The instrument was operated in the same manner as during filter analysis (i.e., with gases flowing). TSETPOINT was set to the values obtained from the regression using Tempilaq° G and probe temperature values were recorded after the responses stabilized at each temperature step.
2.3. Temperature Calibration Procedure for the Sunset Instrument
A temperature calibration procedure was developed to determine the setpoint temperatures, TSETPOINT, for the oven temperature sensor to produce the desired temperatures at the filter sample, TFILTER, to within ±2% (the uncertainty in the thermocouple) in a Sunset Instrument. The Sunset Instrument located at University of California—Davis (S/N 119), called the UCD Sunset Instrument, was used to develop and demonstrate the temperature calibration procedure. The procedure was also performed on Sunset Instruments at Arizona State University (S/N 216–30; ASU Sunset Instrument) and RTI International (S/N 128A and S/N 160–1; RTI-1 and RTI-2 Sunset Instruments, respectively). The UCD Instrument measures pyrolysis using thermal optical transmittance (TOT) only while the other three instruments are equipped with dual optics which can track pyrolysis using TOT and thermal optical reflectance (TOR).
In the first step of the temperature calibration procedure performed on the UCD Sunset Instrument, the temperature probe was used to obtain the filter temperature for a range of sample oven temperature sensor values, in this case ramping the oven temperature sensor from 100°C to 900°C in 50°C increments. Both the sample oven sensor temperature (TSETPOINT) and filter temperature (TFILTER) exhibited a transient response after each change in the setpoint temperature. To obtain steady-state conditions, the residence time at each temperature step was 120 s except for TSETPOINT values of 100°C and 150°C, which were held for 240 s. The procedure was repeated three times, with the temperature probe removed and reinserted after obtaining each profile to account for the variability in positioning the probe in the oven. For the RTI Instruments, the same procedure was utilized but only the six IMPROVE_A TSETPOINT values were used.
Ordinary least squares linear regressions of TFILTER on TSETPOINT were used to calculate the calibration line parameters. The calibration line obtained for the UCD Instrument was used to obtain TSETPOINT values for the IMPROVE_A protocol filter temperatures. The IMPROVE_A protocol filter temperatures are given in . In the IMPROVE_A protocol, the temperature does not increase to the next higher temperature until all carbon ceases to evolve, with bounds on the length of time at each temperature step of 150 to 580 s. Carbon masses measured at each temperature in the heating sequence are the IMPROVE_A carbon sub-fractions: OC1, OC2, OC3, OC4, EC1, EC2, and EC3, which sum to the mass of total carbon on the filter sample. Organic pyrolysis (OP), or carbon that is charred during heating in the non-oxidizing helium environment, is estimated by the mass of carbon that evolves between the time when the oxygen is introduced and time when the intensity of light reflected from (or transmitted through) the filter returns to its initial value. In this work, OP was determined by laser transmittance rather than laser reflectance since the UCD Sunset Instrument is not equipped for laser reflectance measurements. The mass of organic carbon (OC) on the filter is the sum of OC1, OC2, OC3, OC4, and OP and the elemental carbon (EC) equals the sum of EC1, EC2, and EC3 minus OP.
The final step of the calibration was to verify, and modify as needed, the TSETPOINT values to obtain TFILTER values to within ±2% of the specified filter temperature in the IMPROVE_A protocol. In this step, three temperature profiles were obtained using the calculated TSETPOINT values. For any temperature steps with targeted- and measured-filter temperatures differing by more than ±2%, the oven temperature sensor TSETPONT was adjusted to reduce the observed difference and three more temperature profiles were obtained. This step was repeated until TSETPOINT values were obtained which produced the IMPROVE_A filter temperatures to within ±2%.
2.4. Comparison of IMPROVE_A Carbon Measurements with and without Temperature Calibration
Four ambient sampling events were conducted to compare the mass of IMPROVE_A TC, OC, EC, and sub-fractions on filter samples analyzed using two different temperature protocols: TSETPOINT equal to IMPROVE_A target filter temperatures (, column 3, which assumes negligible difference between sample oven sensor and filter temperatures) and TSETPOINT obtained from the calibration line setpoint refinement procedure to achieve IMPROVE_A temperature at the filter (, column 4, which accounts for temperature differences between the sensor and filter locations). For each sampling event, four parallel ambient PM2.5 aerosol samples were collected for 24 h on quartz fiber filters (25 mm diameter, all) using the quartz sampling channel of four collocated IMPROVE Version II samplers (Malm et al. 2003) operating at a nominal flow rate of 22.8 liters per minute. Two 0.5 cm2 circular punches were obtained from each filter and analyzed on the UCD Sunset Instrument. The first punch was analyzed using the IMPROVE_A target filter temperatures as the setpoint temperatures which produce IMPROVE_A temperatures at the sample oven thermocouple (, column 3) and the second punch was analyzed using the setpoint temperatures that produce IMPROVE_A temperatures at the filter (, column 4).
Analysis of Variance (ANOVA; CitationSteel et al. 1997) was performed to determine if the two temperature protocols resulted in statistically different carbon mass concentrations. An ANOVA was performed on TC, OC, EC, and each carbon sub-fraction using the measured concentrations from all punches analyzed for all four sampling events. The sampling date was used as a blocking variable within the ANOVA to remove the variability in atmospheric concentrations and isolate the variance associated with the setpoint temperatures. The ANOVA was performed on the natural log of the carbon concentrations expressed in ng/m3. This transformation provided homogeneous variances, which is a necessary condition for ANOVA, for TC, OC, EC, and all sub-fractions except OC1 and OC4. Concentration differences for OC1 and OC4 were analyzed by visual inspection of the data. The data also passed the normality test for all but OC3 but this is not expected to affect on the validity of the ANOVA results for OC3.
For each experiment, the null hypothesis is that there is no difference in the mean concentration reported by the two protocols. The ANOVA test gives the significance probability, or p-value, for the null hypotheses for each carbon fraction and sub-fraction. If the null hypothesis is rejected (confidence level of 95%, α= 0.05), the mean carbon mass concentrations are statistically different.
3. RESULTS and DISCUSSION
3.1. Comparison of Filter Temperature Measurements Obtained Using an External Thermocouple and Tempilaq° G
Tempilaq° G was used to determine filter temperatures corresponding to sample oven setpoint temperatures in a DRI Model 2001 Analyzer. A linear calibration using these data was used to estimate the setpoint temperatures (, column 2) needed to achieve the IMPROVE_A protocol filter temperatures (, column 3). Subsequently, the temperature probe was used to measure the actual filter temperatures (, column 4) at these setpoint values. The observed filter temperatures were within 1% of the IMPROVE_A target filter temperatures for all but the lowest IMPROVE_A sub-fraction (OC1, 140°C) demonstrating very good agreement between the Temilaq° G and external probe measurements of the filter temperature. The difference at the OC1 temperature may be due to the non-linearity of oven heating at low temperatures (this was observed in the Sunset Instrument, as described in section 3.2. or other possible explanations (CitationPeterson and Richards 2008). Regardless of the cause, the temperature probe can be used to iteratively refine the TSETPOINT needed to achieve the target filter temperature. Such refinements are not possible with the Tempilaq° G method because Tempilaq° G liquids are not available for the IMPROVE_A protocol filter temperatures. Further measurements and discussion of the small differences observed between the two methods can be found in CitationPeterson and Richards (2008).
TABLE 2 Filter temperatures achieved using a calibration based on Tempilaq° G data and measured at the filter by an external thermocouple probe. Measurements performed on a DRI Model 2001 Analyzer
3.2. Temperature Calibration Results
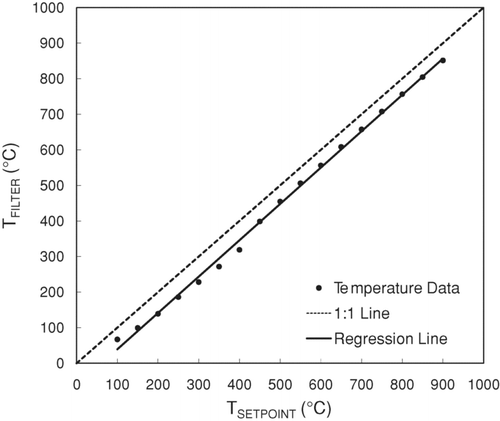
shows the TFILTER values measured at each TSETPOINT from 100°C to 900°C in 50°C increments on the UCD Sunset Instrument. Filter temperatures were lower than sample oven sensor temperatures over the entire temperature range examined. A likely explanation for lower temperatures at the filter is that the heating coils around the filter zone are less tightly packed to accommodate the quartz tube through which the transmittance laser passes ( shows the quartz tube and laser transmittance path) than the coils in the sample oven thermocouple zone. In contrast, using Tempilaq° G as the temperature measurement technique, CitationChow et al. (2005) observed that TFILTER could be higher or lower than TSETPOINT depending on the temperature region in a Sunset Instrument. lso shows the ordinary least squares regression line for the UCD Sunset Instrument. There is a change in slope at TSETPOINT ∼450°C with poorer regression fit at low temperatures compared to high temperatures. This behavior suggests the linear calibration may provide reasonable initial estimates of the sample oven sensor temperature needed to achieve a target filter temperature, but further refinements might be necessary depending on the desired tolerances.
FIG. 2 Temperature calibration data for the UCD Sunset Instrument. The regression parameters are listed in .
lists the linear calibration parameters for all four Sunset Instruments tested in this study. All four instruments exhibited filter temperatures lower than sample oven sensor temperatures over the entire calibration range. Regression slopes were statistically indistinguishable from unity in all but one case (ASU) which had a very small confidence interval about the slope. Similar to the UCD instrument, the RTI instruments exhibited a change in slope at TSETPOINT ∼ 350–550°C while the ASU instrument exhibited a slope change at TSETPOINT ∼ 250°C. Average temperature differences between the sample oven sensor and the filter locations, which are separated by about 1.5 cm, were 35–85°C, depending on the instrument. Studies performed independently by EPA scientists used an external thermocouple (without the quartz boat but with gases flowing) to measure temperatures at four points along the sample oven tube axis in a Sunset Instrument. Experiments conducted at sample oven sensor setpoint temperatures of 300, 500, 700, and 900°C each exhibited a monotonic decrease in temperature between the sensor and filter locations with the sample oven sensor temperature 22–50°C higher than the filter location temperature (Steve Taylor and Jewell Smiley, EPA, personal communication). These data are consistent with our observed temperature differences, providing additional support that these differences are real and not merely artifacts of the measurement techniques or specific thermocouples used in the study.
TABLE 3 Linear calibration constants (with ±95% confidence intervals) for Sunset Instruments at UCD, ASU, and RTI
The difference in calibrations for the four different instruments highlights the importance of calibrating each instrument. Periodic re-calibration, especially after the instrument has been dismantled for service or when the software is upgraded, is recommended to maintain accurate and consistent filter temperatures during analysis.
The setpoint temperatures, TSETPOINT, for the IMPROVE_A protocol were calculated from the regression line for the UCD Instrument. Filter temperatures were measured using the temperature probe with the oven temperatures at the calculated TSETPOINT values. All filter temperatures were within ±2% of the IMPROVE_A temperatures except for target temperatures of 140 and 280°C. The iterative procedure was performed for these two temperatures to obtain appropriate setpoint temperatures. The setpoint temperatures for the IMPROVE_A method for the UCD Sunset Instrument are given in .
3.3. Effects of Temperature Calibration on the IMPROVE_A Carbon Measurements
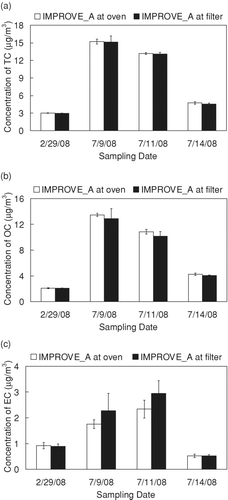
shows the mean concentration of TC, OC, and EC resulting from analysis of parallel filters on the UCD Sunset Instrument using IMPROVE_A target filter temperatures as TSETPOINT to obtain IMPROVE_A temperatures at the sample oven sensor and TSETPOINT values obtained from the calibration presented in this work to obtain IMPROVE_A temperatures at the filter. TC concentrations obtained using these two temperature protocols agreed within 2 ± 2% for all samples and were statistically indistinguishable (p = 0.17). OC and EC concentrations were also not significantly different between the temperature protocols. The insensitivity of TC, OC, and EC to these two temperature protocols is consistent with the analysis of ambient samples on the DRI Model 2001 Analyzer (CitationChow et al. 2005).
FIG. 3 Mean concentration and standard deviation of (a) Total Carbon (TC), (b) Organic Carbon (OC), and (c) Elemental Carbon (EC) for samples analyzed with IMPROVE_A target filter temperatures at the sample oven and IMPROVE_A target filter temperatures at the filter. TSETPOINT values used to obtain IMPROVE_A temperatures at the filter are given in . TC (p = 0.17), OC (p = 0.05) and EC concentrations (p = 0.06) are not significantly different from each other.
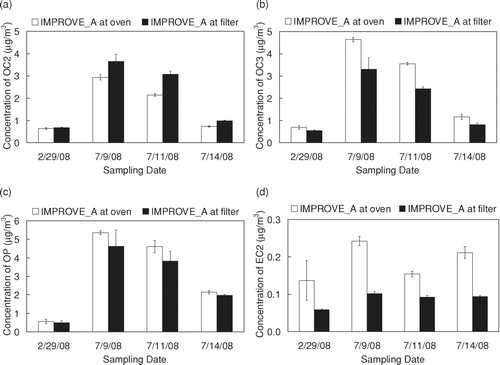
All thermal carbon sub-fractions except EC1 were different for the two temperature protocols (statistically significant for OC2, OC3, OP, EC2; inferred by visual inspection for OC1 and OC4). shows sample-specific results for three thermal sub-fractions (OC2, OC3, and EC2) and OP. For the OC sub-fractions, more carbon evolved at the low temperature plateaus (OC1 and OC2) and less carbon evolved at the higher temperature plateaus (OC3 and OC4) for IMPROVE_A temperatures at the filter compared to IMPROVE_A temperatures at the sample oven sensor. This is consistent with higher filter temperatures for the former than the latter, driving the OC off at the earlier temperature plateaus. OP ( c) was higher for IMPROVE_A temperatures at the sample oven sensor compared to IMPROVE_A temperatures at the filter. While higher OP is often associated with a higher maximum filter temperature plateau in the pure helium portion of the analysis (CitationSchauer et al. 2003), the conditions that lead to charring can be complex (CitationBoparai et al. 2008). Consistent with our findings, CitationChow et al. (2005) also observed higher OP when temperatures were lower at the filter for their temperature calibration of the DRI Model 2001 analyzer. A more-detailed investigation of this phenomenon is warranted. EC2 ( d) demonstrates that the EC sub-fractions are also susceptible to the differences between the two temperature protocols.
FIG. 4 Mean concentration and standard deviation of (a) OC2, (b) OC3, (c) OP, and (d) EC2 for filters analyzed with IMPROVE_A target filter temperatures at the sample oven and IMPROVE_A target filter temperatures at the filter. TSETPOINT values used to obtain IMPROVE_A temperatures at the filter are given in . OC2 (p < 0.01), OC3 (p < 0.01), OP (p = 0.01), and EC2 (p < 0.01) are statistically different under the two temperature profiles.
4. CONCLUSIONS
A temperature probe and calibration procedure were developed to obtain targeted temperatures at the filter in a Sunset Laboratory Carbon Aerosol Analysis Lab Instrument. The main feature of the temperature probe is an external thermocouple mounted at the filter. This approach yielded filter temperatures that agreed well with the IMPROVE/EPA method that utilizes a quick-drying liquid that changes optical properties at specified temperatures (Tempilaq° G). Two advantages of the temperature probe method compared to Tempilaq° G method are that it does not require disassembly of the instrument and does not ruin the quartz sample oven and the sample boat. In addition, the probe method can be used to verify the filter/sensor temperature relationship at the IMPROVE_A protocol temperatures whereas the Tempilaq° G method can be used only at those temperatures for which Tempilaq° G indicators are available.
In Sunset Instruments, the relationship between the filter temperature and the oven temperature measured by the oven temperature sensor varies between instruments, as shown by the four instrument calibrations reported in this article. Therefore, each instrument should be calibrated to obtain accurate filter temperatures. Concentrations of sub-fractions of OC and EC were statistically different for filter punches analyzed using IMPROVE_A target temperatures at the filter compared to punches from the same filters analyzed using IMPROVE_A target filter temperatures at the sample oven temperature sensor. The temperature probe and calibration procedure provide a method of obtaining the same temperature at the filter for samples analyzed on different instruments, thereby improving the comparability of sub-fraction concentrations.
Support for this research was provided by the IMPROVE Group at University of California—Davis and by the University of California Toxic Substances Research and Teaching Program (TSR&TP) through the Atmospheric Aerosols and Health Lead Campus Program (aah.ucdavis.edu). JT gratefully acknowledges the financial support of the Crocker Nuclear Laboratory during his sabbatical at UC Davis. The authors would like to thank Dr. Michael Kleeman for use of the UCD Sunset Instrument, Ashley Mefferd and Andrea Clements for performing the calibration on the ASU Sunset Instrument, and Skip Huckaby, Tim Essert, and Brian Devine for help in developing the temperature probe.
Notes
1Difference expressed as the target filter temperature from the calibration with Tempilaq° G minus TFILTER measured with temperature probe, divided by the target filter temperature.
1Regression equation is TFILTER= m × TSETPOINT + b.
2Linear regressions based on data obtained at 17 temperatures over the range 100°C to 900°C.
3Linear regression based on data obtained at the six IMPROVE_A temperatures. In practice, RTI applies a 4th order polynomial fit to determine the relationship between TFILTER and TSETPOINT.
Related Research Data
REFERENCES
- Birch , M. E. and Cary , R. A. 1996 . Elemental Carbon-Based Method for Monitoring Occupational Exposures to Particulate Diesel Exhaust . Aerosol Sci. Technol , 25 ( 3 ) : 221 – 241 .
- Birch , M. E. 1998 . Analysis of Carbonaceous Aerosol: Interlaboratory Comparison . Analyst , 123 : 851 – 857 .
- Boparai , P. , Lee , J. and Bond , T. C. 2008 . Revisiting Thermal-Optical Analyses of Carbonaceous Aerosol Using a Physical Model . Aerosol Sci. Technol. , 42 : 930 – 948 .
- Cachier , H. , Bermond , M. P. and Buat-Menard , P. 1989a . Thermal Separation of Soot Carbon . Aerosol Sci. Technol. , 10 ( 2 ) : 358 – 364 .
- Cachier , H. , Bermond , M. P. and Buat-Menard , P. 1989b . Determination of Atmospheric Soot Carbon with a Simple Thermal Method . Tellus , 41B ( 3 ) : 379 – 390 .
- Chow , J. C. , Watson , J. G. and Pritchett , L. C. 1993 . The DRI Thermal Optical Reflectance Carbon Analysis System-Description, Evaluation and Applications in United-States Air-Quality Studies . Atmos. Environ. Part A—General Topics , 27 ( 8 ) : 1185 – 1201 .
- Chow , J. C. , Watson , J. G. , Chen , L. -W. A. , Miranda , G. , Chang , M. -C. O. , Trimble , D. , Fung , K. K. , Zhang , H. and Yu , J. Z. 2005 . Refining Temperature Measures in Thermal/Optical Carbon Analysis . Atmos. Chem. Phys , 5 : 2961 – 2972 .
- Chow , J. C. , Watson , J. G. , Chen , L. W. , Arnott , P. W. and Moosmuller , H. 2004 . Equivalence of Elemental Carbon by Thermal/Optical Reflectance and Transmittance with Different Temperature Protocols . Environ. Sci. Technol. , 38 : 4414 – 4422 .
- Chow , J. C. , Watson , J. G. , Chen , L. -W. A. , Chang , M. -C. O. , Robinson , N. F. , Trimble , D. and Kohl , S. 2007 . The IMPROVE_A Temperature Protocol for Thermal/Optical Carbon Analysis: Maintaining Consistency with a Long-Term Database . J. Air Waste Manage. Assoc. , 57 : 1014 – 1023 .
- DRI Standard Operating Procedure . 2008 . “ DRI Model 2001 Thermal/Optical Carbon Analysis (TOR/TOT) of Aerosol Filter Samples—Method IMPROVE_A, DRI SOP #2–216.1r2 ” . Prepared by: Desert Research Institute . Revised July 2008. Available online at http://vista.cira.colostate.edu/improve/Publications
- Eller , P. M. and Cassinelli , M. D. 1996 . NIOSH Manual for Analytical Methods , 4th , Cincinnati : National Institute for Occupational Safety and Health . (1st Supplement)
- Peterson , M. R. and Richards , M. H. 2008 . “ Temperature Calibration for IMPROVE_A Analysis of Carbon Fraction in PM2.5, AWMA Symposium on Air Quality Measurement Methods and Technology ” . Chapel Hill, NC Paper No. 66
- Schauer , J. J. , Mader , B. T. , Deminter , J. T. , Heidemann , G. , Bae , M. S. , Seinfeld , J. H. B. J. , Bertram , T. , Howell , S. , Kline , J. T. , Quinn , P. , Bates , T. , Turpin , B. , Lim , H. J. , Yu , J. Z. , Yang , H. and Keywood , M. D. 2003 . ACE-Asia Intercomparison of a Thermal-Optical Method for the Determination of Particle Phase Organic and Elemental Carbon . Environ. Sci. Technol. , 37 : 993 – 1001 .
- Steel , R. G. D. , Torrie , J. H. and Dickey , D. A. 1997 . Principles and Procedures of Statistics, A Biometrical Approach , 3rd McGraw-Hill, Boston
- Watson , J. G. , Chow , J. C. and Chen , L. -W. A. 2005 . Summary of Organic and Elemental/Black Carbon Analysis Methods and Intercomparisons . Aerosol Air Qual. Res. , 5 ( 10 ) : 69 – 109 .