Abstract
The impaction behavior of agglomerates plays a significant role in nanoparticle technology. In order to be able to evaluate the process of de-agglomeration, the agglomerates are impacted onto a surface and forces are estimated from the breakup of the agglomerates. Several studies have used this principle; however, the simultaneous bounce and breakup of the agglomerates has received little attention. In this study, a method was devised to study both agglomerate breakup and bounce during impaction. In this method, the agglomerates were impacted onto an impaction plate located in a single stage micro-orifice uniform deposit impactor and the bounced particles were collected into a sampling chamber specially designed for this task. This way, the properties of the deposited and bounced particles can be examined with transmission electron microscopy, but in addition, the bounced particles can be analyzed with online measurement instruments, such as the scanning mobility particle sizer. Titanium dioxide (TiO2) and copper particles were used to test and validate the system, and the first impaction behavior results with this system were acquired using TiO2 agglomerates. It was evident that the agglomerates broke up during impaction under the conditions used in this study; the diameter of the particles decreased from 269 nm to 143 nm. It was found that half of the particles bounced. The particle diameter and the fractal dimension of the bounced particles were very similar to those of the particles that did not bounce.
Copyright 2012 American Association for Aerosol Research
1. INTRODUCTION
The impaction behavior of an agglomerate is an important phenomenon in many applications of nanoparticle technology and science. There are only few studies in which a relation between the impaction energy and interparticle forces in a submicron agglomerate has been estimated experimentally, yet this is a fundamental question in many applications in fields such as powder processing, nuclear safety, and health research. Nevertheless, the current research lacks a complete understanding on how to characterize agglomerate adherence on surfaces, bounce, and breakup simultaneously. This has proved to be a challenging task in particle sizes below 1 μm. Therefore, new methods for determining the impaction behavior of submicron agglomerates are needed.
John and Sethi (Citation1993) studied agglomerate breakup by impacting supermicron-sized latex doublets and measuring them optically before and after the impaction. They observed that the measured energy needed to break up half of the doublets was over 3000 times higher than the theoretical energy estimated from the pure van der Waals interface between the primary particles. They concluded that this was probably due to the formation of bridges between particles by residue left after droplet evaporation.
More recently, Seipenbusch, Froeschke et al. (Citation2002), Seipenbusch, Toneva et al. (Citation2007), and Froeschke et al. (Citation2003) studied de-agglomeration by impacting agglomerates of different materials and properties in a single-stage low-pressure subsonic impactor (SSLPI) onto an impaction plate with a transmission electron microscope (TEM) grid. In their experiments, Seipenbusch, Toneva et al. (Citation2007) found that the minimum kinetic energy to induce fragmentation of the agglomerate exhibited dependence on the size of the primary particles in the agglomerate; the smaller the size of the primary particle, the higher the minimum kinetic energy. They also found that the bonding energies of Ag agglomerates followed a theory based on the Weibull statistic as long as the Ag agglomerates were large enough (few hundred nanoparticles per agglomerate). However, the bonding energies of Pt agglomerates were one order of magnitude higher than predicted by the theory. It was hypothesized that this could be due to a possible sintering of Pt agglomerates, which would strengthen the bonds between primary particles. Instead, the Ag particles were far less prone to sintering, because the Ag particles were oxidized more easily. With respect to Ni, they noted that the relation of the minimum threshold energy for fragmentation to the primary particle size was not as linear, as it was for Ag and Pt. This was explained by magnetic dipole attractive forces, which were established between Ni primary particles exceeding a critical size of about 12 nm. Dependence of the kinetic energy required to induce fragmentation on primary particle size was also seen in the studies of Froeschke et al. (Citation2003). Furthermore, they found out that there was no fragmentation with Ni agglomerates even at the velocity of 120 m/s. Possible reasons for this behavior was estimated to be relatively small primary particle size (4 nm), the high fractal dimension (2.5), and the paramagnetic behavior of Ni nanoparticles. They also compared experimental fragmentation energies of Ag agglomerates with estimated bond energies, which were based on pure van der Waals interactions, and found that the measured energies were about five times higher than calculated values assuming only van der Waals interactions.
In addition to the impaction studies, the agglomerate breakup process has been examined with other methods. For example, Wengeler et al. (Citation2006) and Teleki et al. (Citation2008) used dispersion of agglomerates through a nozzle at high pressure to de-agglomerate the agglomerates. Lind et al. (Citation2010) studied the effect of turbulent flows on de-agglomeration in the steam generator tube rupture (SGTR) situation.
Whether or not the particles bounce during impaction has been investigated quite extensively for supermicron particles. Studies have been conducted to determine the probability of the particles bouncing and how the certain parameters, such as impaction angle and charge transfer, affect this probability (Dahneke Citation1995; John Citation1995; Konstandopoulos Citation2006). For submicron particle size, the studies have been restricted to applications, such as efforts to minimize the bouncing in impactors (Lai et al. Citation2008) or to studying the properties of the particles based on the bouncing behavior (Virtanen et al. Citation2010).
There are only a few publications on submicron agglomerate breakup and particle bounce, and to our knowledge, there are no publications addressing both phenomena simultaneously in the nanoparticle size range. This article presents a method for studying agglomerate impaction behavior, with the emphasis on the breakup and bounce of the particles. This enables an analysis of both the deposited and the bounced particles and provides a better understanding of the impaction behavior. In this article, the performance of the impaction measurement system was evaluated and titanium dioxide (TiO2) agglomerates were used for the first impaction experiments.
2. METHODS
2.1. The Impaction Measurement System
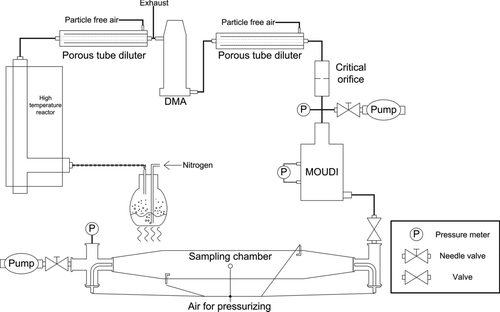
The impaction measurement system was developed to study the impaction behavior of agglomerates and to permit an estimation of the bonding energies between the primary particles in an agglomerate. The measurement setup is shown in , with the operation principle of the measurement system being described here.
The aerosols may be generated by different methods, e.g., chemical vapor synthesis (CVS), flame spray pyrolysis (FSP), or spark discharge. If high-temperature aerosol generation technique is used, a porous tube diluter can be used to quench the generation process by controlling the temperature and concentration of the aerosol (Lyyränen et al. Citation2004; Sippula et al. Citation2008). The generated aerosols are then size-classified with a differential mobility analyzer (DMA) so that only a narrow size range of agglomerates will be under study at one time.
In this article, copper and TiO2 particles produced with CVS were used as test aerosols. The monodisperse aerosol population was introduced into the impactor, in which the particles were impacted onto the impaction plate under low-pressure conditions. As the flow rate was higher through the impactor than through the DMA, another porous tube diluter was used to balance the flow rates. The pressure above the jet plate was regulated by a critical orifice. The pressure above the jet plate and the pressure difference were controlled with the pump after the chamber and with the size of the critical orifice upstream of the impactor. These pressure conditions determined the impaction velocity of the particles. The sample flow from the impactor was then introduced into the sampling chamber, in which the bounced particles were collected.
2.2. Micro-Orifice Uniform Deposit Impactor (MOUDI)
A single stage MOUDI (Marple et al. Citation1991) made by MSP Corporation was used in this study to evaluate the impaction of the particles. For the agglomerate size range of interest, the lowest stage with 2000 orifices, of diameter of approximately 55 μm, on the jet plate was chosen. The impaction plate was able to rotate, and therefore, particles impacting onto the plate were less prone to hit an already existing particle. This feature was used during the impaction measurements. Another advantage of this impactor was the small sizes of the orifices, which enabled the use of higher upstream pressures than in the case of larger orifices attempting to impact particles of the same size. The gas flow velocity, which determines the impaction velocity in the impactor, was controlled by the pressure above the jet plate and the pressure difference over the jet plate. The impaction velocity can be estimated through computational fluid dynamics (CFD) simulations, which is a work that will be conducted in the near future. The method used to determine the velocities will be similar to that used by Arffman et al. (Citation2011) to simulate particle trajectories in a low-pressure impactor.
In this investigation, an aluminum foil was used as the impaction surface. A square hole was cut into the aluminum foil and a TEM grid was placed between the aluminum foil and the impaction plate. As the hole in the aluminum foil was smaller than the TEM grid, the foil supported the TEM grid during the measurements.
2.3. The Sampling Chamber
2.3.1. Design of the Chamber
A sampling chamber was designed and built to enable determination of aerosol characteristics behind the impactor using ambient-pressure aerosol instruments. The scheme of the sampling chamber is shown in . It consisted of three main parts: a cylindrical pipe and two cones at both ends of the cylinder. The volume of the sampling chamber was about 60 L. Baffle plates were installed in the chamber inlet and outlet to ensure sufficient mixing of the sample flow entering the sampling chamber. The inlet baffle was a metallic disk covering the whole cross-sectional area of the cylindrical pipe, with a number of holes in rings of different radii. The outlet baffle was a metallic disc smaller than the cross-sectional area of the cylindrical pipe, with a hole in the center.
The basic principle of the operation of the sampling chamber was as follows:
| 1. | The low-pressure aerosol sample flow from the impactor was introduced into the sampling chamber (). | ||||
| 2. | The outlet of the chamber was closed with valves. | ||||
| 3. | The chamber was pressurized to the ambient conditions with filtered air. | ||||
| 4. | A sample was taken for the aerosol analyzers and the TEM grid. The chamber pressure was maintained with filtered air, which was introduced into the chamber at both ends. | ||||
For the pressurizing phase, there were three 6-mm gas inlets located in the middle of the chamber and at both ends of the chamber (). These plugs were at a 90° angle to each other. During pressurizing, a swirling motion was induced in the chamber by feeding the pressurizing gas through bent pipes that were attached to the gas inlets. In addition to these three gas inlets, the pressurizing gas was fed into the chamber from the chamber inlet and outlet. This was done to achieve optimal mixing during pressurizing. The gas inlet at the middle of the chamber was also used as a sampling port for the aerosol measurement devices.
Ober et al. (Citation2002) have also described a method for the low-pressure sampling. In the method, a foil bag was used to collect a sample under low-pressure conditions. The suction to the foil bag was generated by lowering the pressure outside the foil bag to the values below the pressure of the sampling point. The method would be feasible in many cases where a low-pressure sampling is required; however, it imposes instability into the flow system. Therefore, a different method was developed for the current study to minimize the disturbances to the flows, i.e., the variations of the pressures before and after the impactor.
The performance of the sampling chamber was tested in a number of experiments. There were three main questions regarding the performance itself. First, what is the gas volume that needs to be sampled in order to saturate the chamber to a uniform concentration of aerosol? Second, whether the number size distribution is constant after the pressurizing process, in which the sample is pressurized to the atmospheric pressure? Third, while taking the sample from the chamber, how does the number size distribution and particle concentration change over time due to particle losses? To answer these questions, several tests were carried out and the tests are explained in the following sections.
2.3.2. Numerical Simulations of the Flow in the Sampling Chamber
The sampling chamber design was optimized by CFD modeling to solve the flow field in the sampling chamber during sampling phase, i.e., under the conditions where the sample is introduced from the impactor into the chamber. This situation was modeled with and without baffles and the radial velocity field and gas streamlines were evaluated. The Navier–Stokes equations were solved numerically with Fluent 12.1.4 using the axisymmetric condition and k–ω turbulent model. Velocity inlet and pressure outlet boundary conditions were used. Flow rates of 10 and 60 NLpm through the sampling chamber were used.
2.3.3. The Saturation Rate of the Sampling Chamber
The volume of aerosol required to saturate the sampling chamber during impaction studies was investigated. Copper aerosol was fed through the sampling chamber and the aerosol concentrations at the inlet and outlet of the chamber were measured with condensation particle counters (CPCs) (TSI 3775 and 3776). When the stable outlet concentration reached the concentration of the inlet, the chamber was assumed to be fully saturated. The saturation of the sampling chamber was necessary for successful measurement conditions.
2.3.4. The Effect of Pressurization on Particle Size Distribution
The predictability and stability of the number size distribution after the pressurization were investigated with the following procedure. First, the chamber was saturated with copper aerosol with a known size distribution and concentration, and the pressure in the chamber was reduced by removing gas out of the chamber. Then, the chamber was pressurized back to atmospheric pressure with filtered air. The scanning mobility particle sizer (SMPS) was used to measure the number size distributions both before depressurization and after pressurization.
A dilution factor was determined to correct particle concentration due to the dilution during the pressurizing procedure. The dilution during pressurizing was considered as uniform in the chamber and the gas behavior was assumed as ideal. Therefore, the dilution factor DF was calculated as:
2.3.5. The Particle Losses in the Sampling Chamber
The particle losses in the sampling chamber were estimated by taking a sample with a CPC from the middle of the chamber, which was fully saturated with copper particles, while allowing filtered air to flow to the chamber at both ends to compensate for the pressure reduction. The concentration in the chamber, whether it is affected by the losses due to diffusion or gravimetric settling, was approximated to decrease as in stirred settling. The equation
2.3.6. Low-Pressure Sampling System and TiO2
To ensure that the previously described dilution factor and the loss rate measured with the copper aerosols were still valid for the TiO2 agglomerates that were used for the impaction behavior studies, the performance of the low-pressure sampling system was tested with TiO2. TiO2 agglomerates were introduced into the chamber at low pressure, reduced with the critical orifice before the chamber, and pressurization was carried out. After pressurization, the particle size number concentration was measured with the SMPS and this was compared with the size distribution measured before depressurization, i.e., before the critical orifice.
2.4. Breakup and Bouncing Measurements of the TiO2 Agglomerates
2.4.1. Parameters for the Impaction of TiO2
The MOUDI–sampling chamber measurement system was used for impaction of TiO2 agglomerates, with an electrical mobility diameter of 250 nm, to determine their impaction behavior. During these impaction measurements, the pressure above the jet plate was set to 500-mbar absolute pressure and the pressure difference over the jet plate was set to 100 mbar. The impaction velocity under these conditions and for the given particles was estimated to be 98 m/s. The estimation was based on the gas flow CFD and particle trajectory simulations in the impactor. This method is similar to the one used by Arffman et al. (Citation2011) and will be further discussed in the article published in the near future. After the sample collection and pressurization, an SMPS was used to measure number size distribution of the bounced particles from the chamber. The bounced particles, as well as particles before the impaction, were collected for a TEM (JEM-2100F, JEOL Ltd.) analysis using an aspiration sampler (Lyyränen et al. Citation2009), on holey carbon copper grids (Agar Scientific Inc., S147–400 Cu). The impacted particles were collected as well for TEM analysis on carbon film on copper mesh grids (S160–400 Cu) that were located on the impaction plate during the measurements.
The size distribution of the intact agglomerates was determined by feeding the aerosol through the jet plate of the MOUDI impactor when the impaction plate was removed from the impactor. Then, the size distribution was determined in a way similar to that for the de-agglomerated particles. In this way, the possible de-agglomeration of the particles in the jet was taken into account, i.e., the intact particles went through the jet plate before determination of their size distribution.
2.4.2. Fractal Dimension
The fractal dimensions of the agglomerates were determined by three methods. The first two utilized image analysis of the TEM micrographs: one method was similar to that described by Park et al. (Citation2004) and the other used a nested square method by Kulkarni et al. (Citation2011). The third method used the relationship of the mass and electrical mobility diameter of the agglomerates.
The method by Park et al. (Citation2004) defined the fractal dimension D fL based on the maximum length of the agglomerate L as:
3. RESULTS AND DISCUSSION
3.1. Sampling Chamber
3.1.1. Numerical Simulations of the Flow in the Sampling Chamber
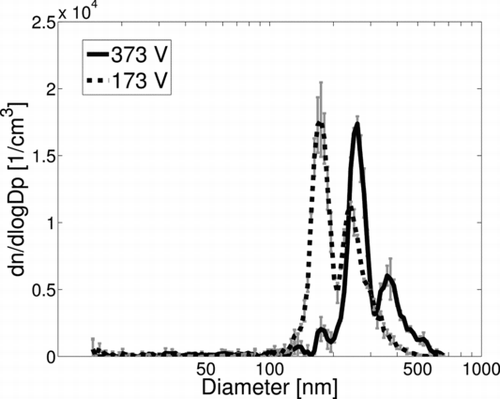
In order to ensure proper mixing in the sampling chamber, CFD simulations were used to estimate the radial velocities and streamlines in the sampling chamber when the gas was introduced into the chamber. The radial velocity component was used to indicate the vertical mixing in the chamber. After the radial velocity diminished, the flow in the chamber was estimated to be saturated. Cases in which 10 Lpm and 60 Lpm flow rates were used are shown in and . There were relatively high-radial velocity areas in the middle of the chamber in the case where the flow rate was 10 Lpm and no baffles were used. This indicates that the flow had not been fully developed until after the middle point of the chamber. This is also obvious from the streamlines: the attachment point of the flow, meaning the point where the streamlines “contact” the chamber walls, was reached after the midpoint of the chamber. On the other hand, in the case where baffles were used, the radial velocity component was close to zero after the inlet baffle. This indicates that the flow was saturated in the cylindrical section of the chamber and only minor vertical mixing occurred after the inlet baffle. As the flow was increased to 60 Lpm, similar behavior could be seen but to a lesser extent. The effect of the inlet baffle was smaller as the flow saturated much earlier than in the case of 10 Lpm.
FIG. 3 The radial (vertical) velocities in the chamber without baffles (above) and with baffles (below). The flow rate through the chamber was 10 Lpm on the left-side cases and 60 Lpm on the right-side cases. The unit for the velocity was meters per second. (Color figure available online.)

FIG. 4 The simulated gas streamlines in the chamber with a sample flow through the chamber (from left to right) without baffles (above) and with baffles (below). The sample flow was 10 Lpm on the left-side cases and 60 Lpm on the right-side cases. (Color figure available online.)
It should also be noted that the gaps of the inlet baffle in these two-dimensional simulations represent ring-type holes, but in the final product, this was approximated with a number of holes in rings of different radii ().
3.1.2. The Saturation Rate of the Sampling Chamber
The saturation in the chamber was investigated to determine the volume of aerosol needed to flow through the chamber in order to ensure that there was a representative sample in the chamber. The results of the chamber set experiment are shown in . The outlet concentrations increased as the sampled volume increased, and finally, the concentrations stabilized close to the value found at the inlet. Before the stabilization, the increase in the concentration was not monotonic, especially for the case of 10 Lpm. This behavior is most probably due to the baffles causing disturbances to the flow. The data show that the chamber was saturated with the aerosol sample when the volumes through the chamber were 113 L and 120 L for the flow rates of 10 Lpm and 60 Lpm, respectively. In other words, the volume of the aerosol needed to saturate the chamber is not strongly dependent on the flow rate. An aerosol volume of about two times the chamber volume had to be collected to saturate the chamber with the aerosol. During impaction measurements, at least 150 L of aerosol was taken to ensure that the sample was representative for the measurements.
3.1.3. The Particle Losses in the Sampling Chamber
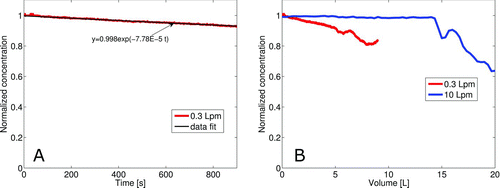
The evolution of the particle concentration in the sampling chamber during sampling is shown in . The concentration decreased nearly linearly in the first 15 min when a 0.3-Lpm flow rate was used and the relative concentration followed the function c(t) = 0.998exp(–7.78e–5 t). The relative losses were 1 – c(t), which was used to correct the measured concentrations. Even though the particle loss factor is strongly dependent on the particle size and the real loss factor will not be the same for all particles, this will give a reasonable correction factor when sampling from the chamber for longer periods, such as 15 min. If the flow rate out of the chamber were increased to 10 Lpm (), it was found that the concentration remained relatively constant for only about 90 s (15 L). Subsequently, the replacement air started to dilute the sample strongly and the concentration declined rapidly. In other words, if a sample from the chamber is introduced into an aerosol measurement device that uses relatively high flow rates, such as Dekati's electrical low-pressure impactor (ELPI; sample flow 10 Lpm), the sampling time will be relatively short. On the other hand, when the sample flow rate is low, the sampling time will be sufficiently long. It is also worth noting that beyond these time limits, the concentration declines due to the dilution but the mean diameter and the standard deviation are not affected by the dilution.
FIG. 15 The results of the saturation rate experiments. The concentration measured with a CPC at the outlet of the chamber while an aerosol sample flows through the chamber at two different flow rates. The x-axis indicates the volume of the aerosol introduced into the chamber. The concentration is normalized to the concentration of the aerosol at the inlet. (Color figure available online.)
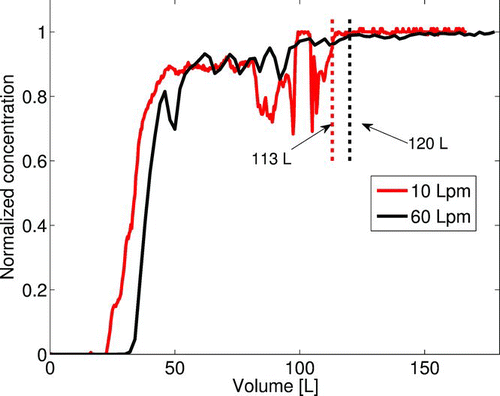
FIG. 6 (a) The normalized particle concentrations while taking a sample from the saturated sampling chamber at flow rate 0.3 Lpm. The data fit y = 0.998 exp(–7.78E–5 t), where t is in seconds, for 0.3-Lpm flow rate data is also shown. (b) The normalized particle concentration while the sample flow rates were 0.3 and 10 Lpm. The x-axis presents the sampled volume. (Color figure available online.)
3.1.4. The Effect of Pressurization on Number Size Distribution
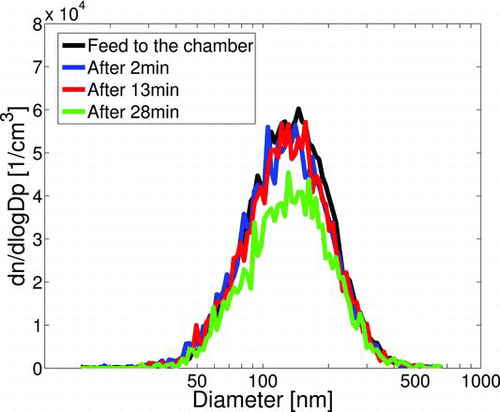
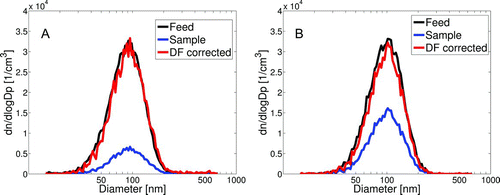
The effect of pressurization on particle size was studied by depressurizing the saturated aerosol sample in the sampling chamber and then re-pressurizing it back to atmospheric pressure. Two depressurization conditions were used: 500-mbar and 200-mbar absolute pressure. The number size distribution of the sample before depressurization was compared with that achieved after depressurization and re-pressurization. It was observed that by correcting the number size distributions measured after re-pressurization with a dilution factor, EquationEquation (1), the number size distributions and concentrations upstream of the chamber and after re-pressurization were consistent, as shown in .
FIG. 7 The number size distributions of the aerosol sample fed to the chamber, and after the depressurization to (a) 500-mbar and (b) 200-mbar absolute pressure, and re-pressurization to atmospheric pressure. Also shown are the number size distributions at 500 and 200 mbar, corrected with the dilution factors (DF), 2 and 5, respectively. (Color figure available online.)
3.1.5. Low-Pressure Sampling System and TiO2
Finally, the performance of the sampling chamber was tested with TiO2 agglomerates. These tests were carried out to ensure that the dilution factors and the loss factor, determined previously from experiments with copper, were also valid for the TiO2 agglomerates.
The aerosol sample was introduced into the chamber at 500-mbar absolute pressure until the chamber was saturated and then the chamber was pressurized to atmospheric pressure for the SMPS measurement. The results of the experiment are shown in and . The number size distributions measured from the chamber after pressurization were corrected with the dilution factor and the loss factor. The calculated data are an average of two number size distributions and the time is determined as a midpoint between the two measurements. The predictions made in previous experiments were apparent here. The concentration of the feed aerosol could be well estimated using the measured distributions, with the corrections determined previously, as long as the sampling time did not exceed 15 min. The geometric mean diameters (GMD) were quite stable, with only minor variations. In addition, there were only minor changes in the geometric standard deviations (GSDs). Overall, these results reveal that it was possible to determine the original number size distribution from the sample at low pressure.
3.2. Breakup and Bouncing Measurements of the TiO2 Agglomerates
3.2.1. The Size Distributions of the Impacted Particles
The breakup and bouncing of the TiO2 agglomerates were studied by impacting the TiO2 agglomerates onto an impaction plate located in a single-stage MOUDI. The particles before impaction (hereafter intact particles) and bounced particles were measured with an SMPS and they were also sampled onto a TEM grid. The particles deposited to the impaction plate were analyzed from the TEM grid. A pressure difference of 100 mbar over the jet plate of the impactor was used, while the pressure upstream of the jet plate was 500 mbar. shows the number size distribution of the intact and bounced particles measured with the SMPS. The size distribution of intact particles was narrow, the GSD being 1.31. The secondary peak (about 400 nm) on the right side of the main mode was due to the doubly charged particles during size classification. On the other hand, the peaks on the left side of the main mode were mainly attributable to the multiple charging of the 250-nm particles during the measurement; a minor part of the 250-nm particles were charged doubly or triply. The bounced particles were smaller but had a broader distribution than that of the intact particles. The GMD was reduced from 253 nm to 131 nm and GSD increased from 1.31 to 1.50. This was due to the breakup and bouncing of the agglomerates during impaction. It can also be seen from the size distributions that the breakup of the agglomerates was due to the impaction as the intact particles were measured using a similar measurement protocol as for the bounced particles, but without the impaction plate.
TABLE 1 The concentrations, geometric mean diameters (GMD), and geometric standard deviations (GSD) for the aerosol sample fed into the sampling chamber and collected from the chamber at 2, 13, and 28 min after pressurization
TEM micrographs of the intact (panel A), impacted and deposited (panel B), and impacted and bounced particles (panel C) are shown in . In order to achieve more precise analysis, ImageJ software (National Institutes of Health) was used to estimate the projected areas of the agglomerates. This enabled the calculation of the area-equivalent diameter. These data are presented in and . In , the intact particles display a fairly narrow size distribution, with GMD of 268nm and GSD of 1.27. This is in good agreement with the data measured with the SMPS. The number-based electrical mobility GMDs of the deposited and bounced particles measured with the SMPS were 143 nm and 145 nm, respectively, and the GSDs were 1.63 and 1.58, respectively. The primary particle diameter of the agglomerates was also analyzed from the TEM micrograph of the intact particles. On average, the primary particle diameter was 35 nm.
FIG. 9 The number size distributions of the intact and bounced TiO2 particles. (Color figure available online.)
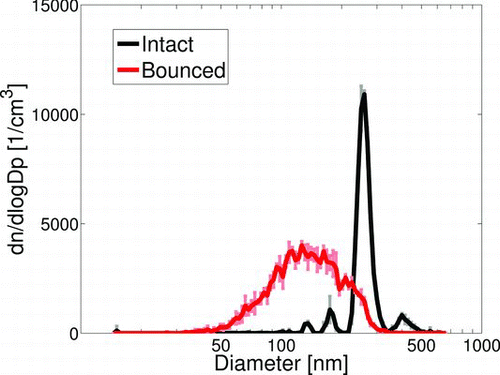
FIG. 10 TEM micrographs of the (a) intact, (b) impacted and deposited, and (c) impacted and bounced particles.

FIG. 11 The area-equivalent number size distributions of the intact, deposited, and bounced TiO2 agglomerates determined from TEM micrographs by image analysis. (Color figure available online.)
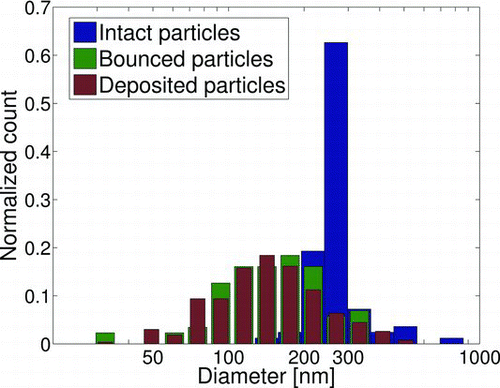
The TEM micrograph data reveal that the size distributions of the impacted and deposited particles are very similar to those of impacted and bounced particles. This would indicate that bouncing had no significant effect on the particle breakup.
It is also worth noting that the GMD values of the SMPS size distribution measurements and TEM micrograph area-equivalent diameter analyses are relatively close to each other. The mechanical mobility diameter measurements and TEM micrograph area-equivalent diameter analyses are known to be relatively close to each other (Rogak et al. Citation1993). We therefore state that the SMPS-determined electrical mobility diameter is also comparable to area-equivalent diameter, as the electrical and mechanical mobility diameters are equal for single-charged particles (Gwaze et al. Citation2006).
3.2.2. Fractal Dimensions
The fractal dimensions were estimated for the particles using three different approaches, two of them using TEM micrographs and the third one using APM and SMPS. The fractal dimensions determined for the intact, deposited, and bounced particles can be seen in and . The fractal dimensions were calculated for both “no overlap” and “overlap” cases, using values of ka = 1.17 and α = 1.07, and ka = 1.81 and α = 1.19, respectively, in EquationEquation (4). The fractal dimension calculated with APM and SMPS method was 2.09 ± 0.04 for intact particles ( and ).
TABLE 2 The geometric mean diameters (GMD) and geometric standard deviations (GSD) of the intact, deposited, and bounced particles determined from TEM micrographs and measured with SMPS
TABLE 3 The fractal dimensions of the intact, deposited, and bounced particles measured with APM and SMPS, and calculated from the TEM micrographs
The measured fractal dimension for the intact particles provides reasonably coherent results for both the APM and SMPS and the nested square method. On the other hand, the method used by Park et al. (Citation2004) estimated somewhat lower values, but this erroneous result is due to the very narrow size distribution of the intact particles. The method used by Park et al. (Citation2004) evaluates the fractal dimension through the relation of the number of primary particles and length of the agglomerate, and the number of primary particles is proportional to the size of the agglomerate. There were only minor variations in the number of primary particles, due to the very narrow size distribution of the intact particles, which can lead to large errors. Hence, this method was not used to calculate the fractal dimensions of the intact particles. This was not the case with the deposited and bounced particles. In these cases, the fractal dimensions calculated from the micrographs with different methods agreed well with each other. On the other hand, the particle concentration of the bounced particles was too low to permit a reliable measurement of the fractal dimension with APM and SMPS.
The fractal dimensions of the deposited and bounced particles are very similar, which indicates that in both cases, the structure of the agglomerates is very similar. In addition, the fractal dimension of the intact particles calculated with the nested square method was almost equal (3–4% higher) to that of the deposited or bounced particles.
Comparing the fractal dimensions of the intact particles calculated with the APM and SMPS method with those calculated with the nested squares method indicates that the overlap of the primary particles is close to the “no overlap” situation. However, more precise information on the overlapping is needed to be able to calculate the exact fractal dimensions from the TEM micrographs.
Another interesting aspect of the APM and SMPS measurements can be seen in . The SMPS size distribution reveals not only the mode of the singly charged but also the doubly charged agglomerates that pass through the APM. The particles that have two charges also have two times the mass of the singly charged particles due to the charge-per-mass classification of the APM. If the primary particle size d pp, prefactor km , and fractal dimension d f do not change for each electrical mobility d e, the fractal dimension can be defined from EquationEquation (8) as:
FIG. 12 The number of primary particles in an agglomerate as a function of agglomerate length per primary particle diameter in cases of (a) intact, (b) deposited, and (c) bounced particles. The dashed line represents the fitted data for the length-based fractal dimension. Values ka = 1.17 and α = 1.07 were used in EquationEquation (4) to calculate the number of primary particles.

3.2.3. Mass-Based Bounce Fraction
The mass fraction of the bounced particles was estimated from the previously presented (Section 3.2.1) size distributions of the intact and bounced particles measured with the SMPS. The density of the particles for each particle size was calculated from the intact particle fractal dimension measured with APM and SMPS method (Section 3.2.2). The mass fraction of the bounced particles was about 54%, in other words, about half of the particles bounced back to the jet stream.
3.2.4. Degree of Fragmentation
The breakup result was compared with those of earlier studies. The most rigorous way would be comparing the bond energy between the primary particles. However, such a detailed energy analysis is beyond the scope of this article. Instead, another variable that has been used to present the impaction breakup results was chosen, the degree of fragmentation F. F was defined by Froeschke et al. (Citation2003) as:
FIG. 13 The mass of the intact particles measured with APM as a function of particle diameter measured with SMPS. The dashed line represents the fitted data for mass-based fractal dimension.
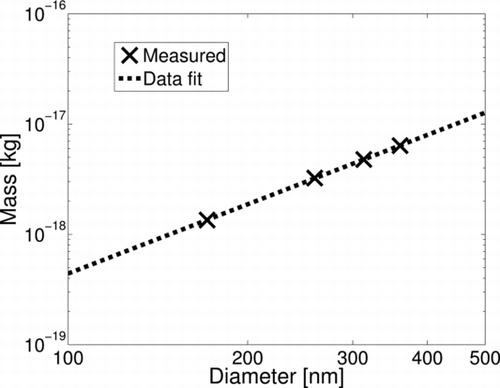
FIG. 14 The electrical mobility size distributions measured with SMPS after APM mass classification. Two cases are shown here, with different APM voltage settings, while the revolution rate was held constant.
An estimate was also given for the average number pieces the agglomerate broke up into. The GMDs, measured with the SMPS, of the intact and bounced particles were chosen to present average particles in both situations. The masses of those particles were estimated from the results of APM and SMPS (Section 3.2.2), and from these masses, it was estimated into how many fractions the agglomerate was divided, on average. The TiO2 agglomerates were broken up into 3.7 pieces, on average.
4. CONCLUSIONS
This article introduces a method to study impaction and bouncing of agglomerates. For this purpose, a single-stage MOUDI was coupled with a custom-made sampling chamber. This measurement system enables the analysis of the deposited and bounced particles with TEM, but the major advantage of this system is the analysis of the bounced particles with online measurement devices such as the SMPS. The study of the bounced particles is one of the key focus points of this study—a topic that has gained less attention in previous breakup and impaction studies.
The main principle behind the presented measurement system was as follows: the particles under study were impacted onto an impaction plate in the device and the bounced particles were collected into the sampling chamber located after the impactor. The particles from the impaction plate were analyzed with TEM, and the bounced particles were analyzed from the sampling chamber. In this case, an SMPS, an APM analyzer and a TEM were used.
TiO2 agglomerates were found to break up upon impaction under the conditions used in this study. The GMD of the agglomerates was 269 nm before the impaction, and the particles found on the impaction plate had a GMD value of 143 nm. GSD increased from 1.27 to 1.63 due to the break up of agglomerates. About half of the particles were found to bounce. The deposited and bounced particles had very similar GMDs, GSDs and fractal dimensions, which indicates that the particle bounce does not have a significant effect on the breakup process. There were no major differences observed in the fractal dimension before and after the impaction: bounced and deposited particles were found to have a 3–4% smaller fractal dimension than the intact particles.
The impaction velocities, which are crucial for the impaction energy estimations, need to be estimated for the further analysis of the bonding forces between the primary particles in an agglomerate. In the near future, a CFD simulation work will be conducted to determine the impaction velocities. Another point of improvement is the impaction plate material, which is anticipated to have an effect on the impaction behavior. This will also be studied in future work.
It was shown that online instruments can be used for the analysis of the bounced particles. In addition to the instruments used in this study, other aerosol measurement devices, such as an ELPI and a tapered element oscillating microbalance (TEOM), can be used for the characterization of the bounced particles. The use of online instruments enables more rapid analysis than has been previously performed.
Acknowledgments
This work was carried out in support of the international ARTIST II program. The authors express their gratitude to those members of the Laboratory for Thermal-Hydraulics at Paul Scherrer Institut (PSI) and of the Fine Particle and Aerosol Technology Laboratory at the University of Eastern Finland who participated in the experimental work and construction of the facility.
REFERENCES
- Arffman , A. , Marjamaki , M. and Keskinen , J. 2011 . Simulation of Low Pressure Impactor Collection Efficiency Curves . J. Aerosol Sci. , 42 ( 5) : 329 – 340 .
- Dahneke , B. 1995 . Particle Bounce or Capture – Search for an Adequate Theory .1. Conservation-of-Energy Model for a Simple Collision Process . Aerosol Sci. Technol. , 23 ( 1) : 25 – 39 .
- Froeschke , S. , Kohler , S. , Weber , A. P. and Kasper , G. 2003 . Impact Fragmentation of Nanoparticle Agglomerates . J. Aerosol Sci. , 34 ( 3) : 275 – 287 .
- Gwaze , P. , Schmid , O. , Annegarn , H. J. , Andreae , M. O. , Huth , J. and Helas , G. 2006 . Comparison of Three Methods of Fractal Analysis Applied to Soot Aggregates from Wood Combustion . J. Aerosol Sci. , 37 : 820 – 838 .
- John , W. 1995 . Particle-Surface Interactions – Charge-Transfer, Energy-Loss, Resuspension, and Deagglomeration . Aerosol Sci.Technol. , 23 ( 1) : 2 – 24 .
- John , W. and Sethi , V. 1993 . Breakup of Latex Doublets by Impaction . Aerosol Sci. Technol. , 19 ( 1) : 57 – 68 .
- Konstandopoulos , A. 2006 . Particle Sticking/Rebound Criteria at Oblique Impact . J. Aerosol Sci. , 37 ( 3) : 292 – 305 .
- Kulkarni , P. , Baron , P. A. and Willeke , K . 2011 . Aerosol Measurement: Principles, Techniques, and Applications (3rd ed , Hoboken , NJ : Wiley . (Eds.).
- Lai , C. , Huang , S. , Chang , C. and Lin , J. 2008 . Reducing Particle Bounce and Loading Effect for a Multi-Hole Impactor . Aerosol Sci. Technol. , 42 ( 2) : 114 – 122 .
- Lind , T. , Ammar , Y. , Dehbi , A. and Guentay , S. 2010 . De-Agglomeration Mechanisms of TiO(2) Aerosol Agglomerates in PWR Steam Generator Tube Rupture Conditions . Nucl. Eng. Des. , 240 ( 8) : 2046 – 2053 .
- Lyyränen , J. , Backman , U. , Tapper , U. , Auvinen , A. and Jokiniemi , J. 2009 . A Size Selective Nanoparticle Collection Device Based on Diffusion and Thermophoresis . J. Phys.: Conference Series. , 170 : 012011
- Lyyränen , J. , Jokiniemi , J. , Kauppinen , E. I. , Backman , U. and Vesala , H. 2004 . Comparison of Different Dilution Methods for Measuring Diesel Particle Emissions . Aerosol Sci. Technol. , 38 ( 1) : 12 – 23 .
- Malloy , Q. G. J. , Nakao , S. , Qi , L. , Austin , R. , Stothers , C. Hagino , H. 2009 . Real-Time Aerosol Density Determination Utilizing a Modified Scanning Mobility Particle Sizer Aerosol Particle Mass Analyzer System . Aerosol Sci. Technol. , 43 ( 7) : 673 – 678 .
- Marple , V. , Rubow , K. and Behm , S. 1991 . A Microorifice Uniform Deposit Impactor (Moudi) – Description, Calibration, and Use . Aerosol Sci. Technol. , 14 ( 4) : 434 – 446 .
- Oh , C. and Sorensen , C. 1997 . The Effect of Overlap between Monomers on the Determination of Fractal Cluster Morphology . J. Colloid Interface Sci. , 193 ( 1) : 17 – 25 .
- Ober , F. , Mayer , M. , Bütter , H. , and Elbert , F. 2002 . Aerosol Measurement in Low-Pressure System with Standard Scanning Mobility Particle Sizers . Part. Part. Syst. Charact. , 19 : 229 – 239 .
- Park , K. , Kittelson , D. and McMurry , P. 2004 . Structural Properties of Diesel Exhaust Particles Measured by Transmission Electron Microscopy (TEM): Relationships to Particle Mass and Mobility RID F-8366-2011 RID A-8245-2008 . Aerosol Sci. Technol. , 38 ( 9) : 881 – 889 .
- Rogak , S. , Flagan , R. C. and Nguyen , H. 1993 . The Mobility and Structure of Aerosol Agglomerates . Aerosol Sci. Technol. , 18 ( 1 ) : 25 – 47 .
- Seipenbusch , M. , Froeschke , S. , Weber , A. P. and Kasper , G. 2002 . Investigations on the Fracturing of Nanoparticle Agglomerates – First Results . Proc. Inst. Mech. Eng. Part E-J. Proc. Mech. Eng. , 216 ( E4) : 219 – 225 .
- Seipenbusch , M. , Toneva , P. , Peukert , W. and Weber , A. P. 2007 . Impact Fragmentation of Metal Nanoparticle Agglomerates . Part. Part. Syst. Char. , 24 ( 3) : 193 – 200 .
- Sippula , O. , Lind , T. and Jokiniemi , J. 2008 . Effects of Chlorine and Sulphur on Particle Formation in Wood Combustion Performed in a Laboratory Scale Reactor . Fuel , 87 ( 12 ) : 2425 – 2436 .
- Teleki , A. , Wengeler , R. , Wengeler , L. , Nirschl , H. and Pratsinis , S. E. 2008 . Distinguishing between Aggregates and Agglomerates of Flame-Made TiO2 by High-Pressure Dispersion . Powder Technol. , 181 ( 3) : 292 – 300 .
- Virtanen , A. , Joutsensaari , J. , Koop , T. , Kannosto , J. , Yli-Pirila , P. Leskinen , J. 2010 . An Amorphous Solid State of Biogenic Secondary Organic Aerosol Particles . Nature , 467 ( 7317) : 824 – 827 .
- Wengeler , R. , Teleki , A. , Vetter , M. , Pratsinis , S. E. and Nirschl , H. 2006 . High-Pressure Liquid Dispersion and Fragmentation of Flame-Made Silica Agglomerates . Langmuir , 22 ( 11) : 4928 – 4935 .
