Abstract
Nowadays, ventilation ducts, especially duct bends, play a significant role in filtering aerosol contaminant for the built environment. This article experimentally investigates practical averaged aerosol deposition in 90° ventilated bends of rectangular cross section by measuring particle concentration changes at bend inlet and outlet in steady state. The measured penetrations at Reynolds number Re = 17,900 and 35,600 are in good agreement with previously published data at small Stokes number, which justifies the effectiveness of the measurement process. Particle penetration decreases from approximately 100% for St = 5.2 × 10⁻⁴ particles to 64% for St = 0.55 particles in acrylic glass bends. For the particles of Stokes number larger than 0.089, particle penetration is much higher than that in previous studies. This behavior is believed to be caused by the consideration of particle rebounce from bend wall in the presence of centrifugal force. The changes in Reynolds number do not significantly alter the trend of deposition velocity and penetration. Deposition velocities are compared and verified with available droplet data and current numerical and analytical analysis. For the high deposition velocity increase compared to that in straight ducts, the major mechanism is attributed to the flow impaction onto outer bend wall. In this type of bend, secondary flows and streamwise eddies provide a further reason for distinct deposition increase of small particles. In a word, the deposition mechanisms are analyzed analytically and systematically, and then classified in order clearly. In addition, two empirical models were proposed in this article, which are valid for Stokes number St = 5.2 × 10⁻⁴–0.55 under the experimental conditions.
Copyright 2013 American Association for Aerosol Research
INTRODUCTION
Aerosol deposition onto a surface can be particularly significant for the health of occupants and modern equipment (WHO Citation2006; Chao et al. Citation2009; Yu and Lin Citation2010). Two significant examples are the demonstrated robust relationship between PM exposure and human morbidity/mortality (Pope and Dockery Citation2006), and the reported transmission of severe acute respiratory syndrome (SARS) on Nature News (Knight Citation2003). Through a ventilation system, outdoor air can be sucked into a building, and indoor air can be recirculated within it. In this way, considerable airborne contaminant particles are transported and their deposition happens at various places in a ventilation duct system (Li et al. Citation2007). The aerosol deposition onto duct causes pollution and affects the indoor environmental quality (Jin et al. Citation2009). However, the deposition has only been well investigated for straight ducts. Flow paths through ventilation ducts are complicated since the ventilation ducts include many branches and bends. One of the most important ventilation parts is duct bends that alter the flow direction and pattern (ASHRAE Citation2009). A large proportion of the total deposition is likely to occur in bends rather than surfaces of straight ducts. Thus, experimental evidence of the correlation of particle deposition to bend configuration and airflow is a principal necessity for assessing the traveling behavior of contaminant aerosols in bends.
Since the particle deposition is influenced by numerous factors on straight duct surfaces (Lin et al. Citation2003; Zhao and Wu Citation2007; Zhang and Chen Citation2009), the aerosol deposition in bends becomes more complex for different flow conditions and potential inertial impaction (Sippola and Nazaroff Citation2005). Up to date, limited experiments have been conducted to study aerosol deposition in a single bend. Existing reports of deposition from turbulent flow within bends are restricted to droplet studies in small diameter tubes (Pui et al. Citation1987; McFarland et al. Citation1997; Wilson et al. Citation2011). Particles of realistic composition and size distribution in ventilation ducts are rarely examined. In large industrial pipe bends, Peters and Leith (Citation2004a) studied the deposition of polydisperse glass particles with particular high Reynolds number of 203,000 and 368,000. The results were found to agree roughly with models in small tubes, but areas of disagreements existed due to the substantial difference among their experimental conditions.
Aerosol deposition in typical ventilation system of commercial or public buildings has been seldom examined. Sippola and Nazaroff (Citation2005) investigated two types of bends in this kind of ventilation system during their experiments. The bend deposition was found to be greater than that in straight ducts with fully developed turbulent flow. This investigation has raised the significant importance of ventilation bends of noncircular cross sections considering aerosol pollution transmission, but studies on particle deposition in bends with rectangular cross sections are far from fully understanding.
Most experimental reports available in the literature assumed no particle resuspension or rebounding from duct surfaces, but this assumption may not hold true for solid particles (Song et al. Citation1996; Brach and Dunn Citation1998). One of the main mechanisms to control particle deposition is particle-wall collision (Brach and Dunn Citation1998). However, the impact of this mechanism on particle deposition has been rarely investigated. Our recent numerical analysis has raised the importance bend-induced deposition in and behind ventilation bends due to the solid particle collision on outer bend wall (Sun et al. Citation2011, Citation2012).
This article aims to experimentally study the actual averaged aerosol deposition in ventilation duct bends of rectangular cross section with turbulent airflow. To match actual particle composites and distribution in ventilation bends, Arizona standard particle is chosen as the test aerosol in the experimental measurement. Systematic experiments are designed and conducted with moderate turbulent flows, which is practical for typical ventilation systems. The measured penetration and deposition velocity are compared with previously published data and our numerical analysis. The deposition mechanisms are analytically discussed in detail. Finally, two empirical models are proposed based on the measurement data.
RESEARCH METHODS
Definitions
The aerosol penetration, P, is determined from
The particle deposition velocity determines the rate of the deposition process and is given as
Summary of Experimental Approach
Particle deposition was measured in a 90° bent acrylic glass and galvanized steel ducts. Experiments were performed at two nominal Reynolds numbers Re = 17,900 and 35,600 for each of the six channels of nominal particle diameters: 0.3, 0.5, 1, 5, 10, and 25 μm. For each experiment, three groups of repeated data were sampled to test the reproducibility of the measurements. As a result, 36 series of particle penetration data were tested and analyzed in both acrylic glass and galvanized steel duct bends.
Experimental Setup
shows the setting of the schematic diagram of the experimental apparatus to measure the particle deposition in 90° bends of rectangular cross sections. Airflow was induced by means of a stable centrifugal fan whose speed could be adjusted by the speed controller. This type of airflow fan has been successfully adopted in previous studies (Lai et al. Citation1999; Peters and Leith Citation2004a). Spiral-wound flexible duct was adopted to connect the fan to reduce the transmission of vibrations (Sippola and Nazaroff Citation2005). The fan pulled room air through a high efficiency particulate air (HEPA) filter into a straight duct with a square cross section of side length D = 10 cm. The air passed through a grid to reduce the flow turbulence and to unify the flow field, and traveled a distance of 19D then entered a horizontal placed 90o bend. This distance is enough for particle deposition to develop to a condition as that in fully developed turbulent flow since Sippola and Nazaroff (Citation2005) find that after ten side length distance, the deposition velocities are approximately the same with those in fully developed turbulent flow. Peter and Leith (Citation2004a) also reported the suitability of a distance of 17.5D between particle injection position and bend entrance. In addition, bend curvature ratio, defined as the bend radius divided by the duct hydrodynamic diameter, was 3.4. The material of the straight ducts was clear acrylic glass, and both galvanized steel and acrylic glass were utilized in the tested bends. The interior surfaces of the ducts were assumed to be smooth except the seams of straight ducts to bends.
FIG. 1 Schematic diagram of the experimental apparatus (not to scale). (Color figure available online.)
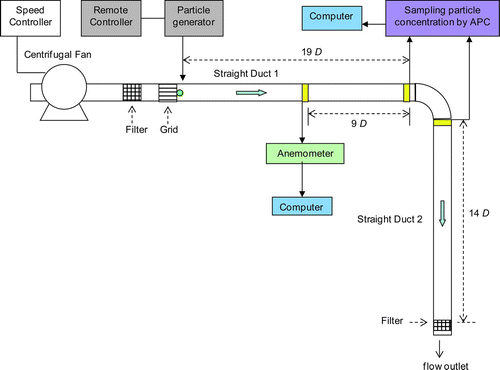
The reference air speeds were measured by a TSI anemometer (Model 8386A) in the midstream of straight duct 1 as seen in . The standard Arizona test particle (ISO 12103–1 A2) was chosen to fit the realistic aerosol in ventilation ducts. A kind of PALAS disperser (RBG1000) injected these particles into the duct airflow at a constant feeding rate. Related particle concentrations were determined by an aerosol particle counter (LASAIR II 310A) at the bend inlet and outlet. A detailed description of these equipment and materials is given in the online supplemental information.
Experimental Protocol
The detailed experimental protocol was followed for each measurement as below. The background temperature and humidity of this experiment were controlled by the air conditioning system in the laboratory. The room temperature (T) was 16–20°C and the corresponding air humidity (RH) was 40%–60% during the experimental period. This condition satisfied the generator operation environment, i.e., 10°C < T < 40°C and RH < 80%. Before each measurement, particle generator, testing ducts, sampling tubes and nozzles, particle counter, filters, and other assemblies were carefully cleaned and dried. After that, these test rigs were installed properly. The fan was then turned on and set to a suitable speed. The leakage test was conducted to examine any improper fittings (Sippola Citation2002). Bulk air velocities in the middle of straight duct 1 were measured until the airflow became stable. Sampling nozzle of the aerosol particle counter (APC) was placed in the duct and fixed in set points, and the generation started to inject particles at the inlet central point of straight duct 1. The aerosol mass injection rate was 0.283 mg/h according to the specification of particle generator and current experiment conditions. After particle generator and counter worked stable for about 15 min to become steady state, particle number concentrations were isokineticly sampled at the bend outlet plane and then at the plane of 0.04Dh ahead of bend inlet. The sampling nozzles were accurately adjusted and fixed by a scaled mechanical system to follow the isokinetic sampling procedure (Sippola Citation2002; Baron et al. Citation2011). The sampling transport line was carefully and precisely positioned in the same manner to reduce the differences of possible particle loss. The concentration measurements at each plane were conducted in sequence at nine uniformly distributed points on the horizontal symmetric line of the bend outlet and inlet (Sippola and Nazaroff Citation2004; Wang et al. Citation2012). The sampling order first at bend outlet and then at inlet can prevent the disturbance of sampling nozzle on particle flow downstream. Sampling at nine uniformly distributed locations at a cross section can effectively minimize the effect of air velocity variations and possible sampling loss onto the determination of averaged penetration in EquationEquation (1). The sampling time for the counter is 1 s, and every sample concentration was the average of six values during 6 s. The total sampling time for each point lasted for 2 min, and the net whole sampling duration was 36 min for the bend inlet and outlet. In addition, the sampled results at each point were recorded into connected computer simultaneously for data checking and postprocessing.
Data Analysis
Following the steady state concentration measurements in the experiments, time and space based average number concentration can be determined. In detail, the average concentration at the bend inlet Ci or outlet Co was estimated on the average concentration of three groups of repeated experimental data, each of which had nine sampling position concentrations and 120 time point concentrations. As a result, the penetration can be calculated according to EquationEquation (1). Similar penetration measurements have been proved in Sippola and Nazaroff (Citation2005) to obtain concentrations in straight duct and in McFarland et al. (Citation1997) to collect those data in small tube bends.
Since the test particle was injected at the straight duct entrance in the current experiment, the deposition velocity of a 90° bend can be determined by the following equation:
The particle deposition velocity is plotted in a dimensionless form V + d versus dimensionless relaxation time τ+ p , defined in the following manner:
RESULTS AND DISCUSSION
Experimental Condition and Evaluation
A clear specification of current experimental conditions was summarized in Table S1 (available online) for bend, airflow, and particle properties. Under these conditions, air velocities, particle number concentrations upstream and downstream of the bend were measured. The measured air velocity distributions have been verified with 96% consistency to numerical modeling in the previous study (Jiang et al. Citation2011). Current average turbulent intensity was measured to be 3% at the section of 9D ahead of the bend in straight duct 1, and the maximum value was 8% at 0.1D distance from duct wall surface. These good air velocity results and low turbulences confirm the proper experimental design and guarantee the particle measurement accuracy in bends.
TABLE 1 Measured aerosol deposition velocities throughout bends of rectangular cross section with 14Dh and 19Dh straight duct ahead of bends
Since the current investigation focuses on experimental determination of particle-phase movement, the following results concentrate on averaged particle concentration, penetration, and deposition analysis. A typical run at dpn = 10 μm for Re = 17,900 is presented in Table S2. It shows that all percentages of standard deviations to average values are within 5%. These average values together with error analysis show a low changeability of particle number concentration. Additionally, according to our previous study (Jiang et al. Citation2011) and the sampling correction equation in Baron et al. (Citation2011), the ambient air velocity difference at sampling nozzle only induces penetration deviations of 0.0%, 0.8%, 2.1%, and 4.5% for current Stokes numbers of St = 5.2 × 10⁻⁴, 2.3 × 10⁻², 8.9 × 10⁻², and 0.55, respectively. As a result, with the same sampling positioning and the averaging method of air velocities and particle concentrations at a cross section, the possible particle concentration loss in the sampling lines is basically ignored in current penetration estimation using EquationEquation (1). These phenomena indicate that the experimental setup, sampling, and protocol possess high precision and are reproducible.
The length of straight duct ahead of a bend may affect the turbulence level near the bend inlet and the particle deposition throughout a bend. Straight duct with enough length could minimize the turbulence at straight duct inlet and achieve fully developed flow. This study compares two straight ducts with length of 14Dh and 19Dh under injection rate of 1.415 mg/h. This length is the distance between the locations of particle injection and bend inlet. illustrates the averaged penetration comparison between the measured results with two lengths of straight duct ahead in 90o galvanized steel bends under turbulent flow of Re = 17,900. demonstrates the comparison of dimensionless deposition velocity V + d against dimensionless relaxation time τ+ p corresponding to the conditions above.
FIG. 2 Comparison of average penetrations of polydisperse particles in 90° bends of rectangular cross section under turbulent flow with two lengths of straight duct ahead (Re = 17,900). (Color figure available online.)
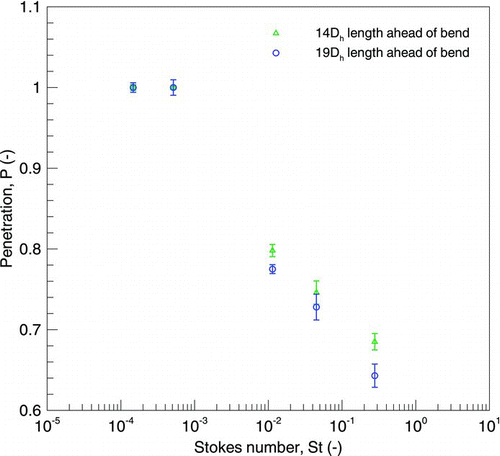
For straight duct with a length of 14Dh ahead, particle penetrations were measured from 1.0 to 0.685 for particles with Stokes number St = 1.47 × 10⁻⁴–0.278 as demonstrated in , and from 1.0 to 0.643 for that with a 19Dh length. The results show that the trend and magnitude of the two experimental results agree well with each other within a 98% consistency, which means that current particle penetration measurements are not influenced by developing flow turbulence near the inlet of straight duct 1. After developing 14Dh distance, particle flows are nearly fully developed. Therefore, the length of 14Dh is suitable long for locating the particle injection and measuring the bend penetration. This behavior partially supports Sippola's conclusion that the measured deposition velocity in developing turbulent flow change marginally with the length of straight duct when the length is larger than 10Dh (Sippola and Nazaroff Citation2005). Furthermore, also demonstrates that particles with smaller Stokes number agree much better than those with larger one. This is probably attributed to slightly higher deposition of larger particles ahead of bends because of traveling 5Dh longer distance.
The dimensionless deposition velocity V + d ranged from 1.68 × 10⁻³ to 0.598 under τ+ p = 0.015–8.22 for both conditions, as shown in . The deposition velocities of the two conditions show a good consistency of 93% in average. However, it can be found that a 2% discrepancy in expressing particle penetration would lead to an average difference of 7% in presenting deposition velocity. This behavior is attributed to the reason that the adopted deposition velocity EquationEquation (6) could expand the slight difference penetrations in between the two conditions as illustrated in , and particle deposition velocity is more sensitive to the condition difference ahead of bends than penetration.
FIG. 3 Comparison of dimensionless particle deposition velocity in straight duct of rectangular cross section with previous experimental data. (Color figure available online.)
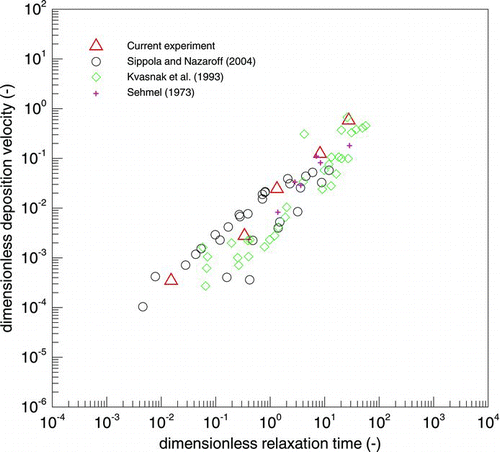
To be more confident with current deposition quantification method, additional experiment was conducted in typical horizontal straight duct 1 as shown in . During the measurement, the bend was excluded. Particle concentrations were measured at the cross sections of 14Dh and 19Dh to determine the deposition during this distance. All other measurement setup and procedures were the same with the measurements for bend in this article. After conducting the measurement, shows the experimental results between dimensionless deposition velocity and dimensionless particle relaxation time in horizontal straight duct. Measured particle sizes are the same with the range in bend experiments, i.e., τ+ p =0.015−27.6, and measured dimensionless deposition velocity varies from 3.48 × 10⁻⁴ to 0.58 correspondingly. To verify the deposition velocity data, this figure further presents three typical experimental results available in similar horizontal straight ducts or tubes (Sehmel Citation1973; Kvasnak et al. Citation1993; Sippola and Nazaroff Citation2004), where common fluorescence method and/or mass measurement are included. From the comparison, it can be found that current experimental data fall within their measurement results and the trend of current data fits well with previous ones. Therefore, this justification result further confirms the reliability of the deposition quantification method in this article.
Particle Penetration in Bends
shows the measured particle penetrations through 90° acrylic glass bends versus the bend Stokes number for two Reynolds numbers of Re = 17,900 and 35,600. The penetrations were calculated by EquationEquation (1) from average particle number concentration. Through repeated measurements, the standard deviations of the penetrations are also analyzed and demonstrated in the figure. A typical error analysis was presented before in Table S2. The bend penetration decreased from nearly 100% for St = 5.2 × 10⁻⁴ particles to 64% for St = 0.55 particles as shown in . The clear correlation trend of penetration and particle Stokes number implies that inertia is a significant factor to control particle deposition in bends. The standard deviation of penetration ranges from 0.5% to 2.5% for St = 5.2 × 10⁻⁴–0.55. This low variability associated with particle penetration provides good evidence of high accuracy of the measurement.
FIG. 4 Comparison of polydisperse particle penetration data and proposed model with previous ones in 90° bends of rectangular cross section under turbulent flow. (Color figure available online.)
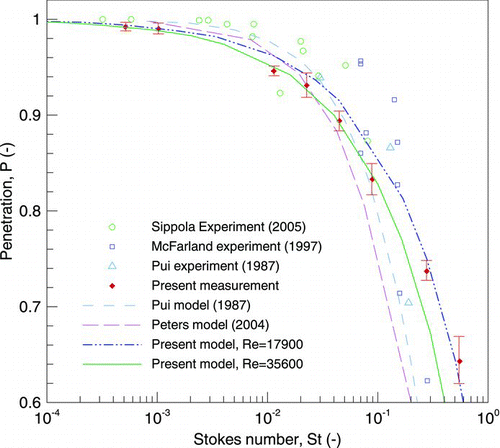
The measurement results were also compared to the previous experimental data or empirical models (Pui et al. Citation1987; McFarland et al. Citation1997; Peters and Leith Citation2004b; Sippola and Nazaroff Citation2005). These empirical models were assumed to be able to apply to current measurement environment, and their parameters were thus set as the same with present experimental conditions. It can be found that current measurement data are in good agreement with other models or experimental data in magnitude for small Stokes number St = 5.2 × 10⁻⁴–8.9 × 10⁻². This behavior justifies the effectiveness of the measurement method and procedure stated in previous sections. The comparison also indicates that the present trend of measurement results show considerable similarities with previous studies, even though their experimental conditions were obviously different. The analogical behavior among these diverse measurements suggests that experimental differences among droplet, fluorescent and solid particles for varied bend size and configurations are not the controlling factors for particle penetrations under small Stokes number St = 5.2 × 10⁻⁴–8.9 × 10⁻². The particle-wall collision in bends imposes minor influence on these particles' deposition (Sun et al. Citation2011). A possible explanation of this phenomenon would be that particles of extremely low Stokes number are easy to follow bulk fluid flow and hard to approach onto bend wall surfaces. For particles of large Stokes number (St > 0.089), however, current penetration is higher than the previous research. The relatively larger penetrations for particles of large Stokes number are probably attributed to the rebounding effect of solid particles approaching onto rectangular section bend wall as predicted in our previous numerical studies (Sun et al. Citation2011). Possible particle charges are also not the control factor for the bend penetration as analyzed in the online supplemental information. Although resuspension would happen simultaneously together with particle impaction and deposition in duct bend, this effect could be neglected on the basis of the following justifications. First, as shown in Table S2 for example, particle concentration is very low to induce small particle density on ducts compared to resuspended density in previous experiments (Zhou et al. Citation2011). Second, since experimental ducts are cleaned before test, resuspension will rarely happen (Sippola and Nazaroff Citation2004; Zhou et al. Citation2011). Furthermore, most resuspension phenomena appear only at the start of airflow when there are numerous particle accumulations on the ducts of realistic ventilation systems that are cleaned less frequently for a long time (Wang et al. Citation2012; Zhu et al. Citation2012). Therefore, particle resuspension is not obvious and not dominant in current study.
Particle Deposition Velocity in Bends
presents the composite dimensionless deposition velocities versus particle relaxation time. The measured data show that deposition velocity through the bend increased with an increase in particle relaxation time or air velocity. The range of dimensionless deposition velocities is from 0.091 to 0.65. The trends of deposition velocity are analogous for both Reynolds numbers for nonspherical polydispersed solid particles. This phenomenon seems to suggest a marginal influence of Reynolds number on trends of particle deposition velocity in 90° bends under the tested conditions of dimensionless particle relaxation time τ+ p =0.34−27.6. However, the average deviations of deposition velocities are 7% and 13% for Re = 17,900 and 35,600, respectively. This phenomenon reveals that standard deviation increases with Reynolds number. When Reynolds number is higher, turbulent fluctuations are more distinct and then the measurement uncertainty would be larger. In addition, compared to penetration deviation, these deviations reveal higher sensitivity of deposition velocities.
FIG. 5 Comparison of dimensionless deposition velocity data and proposed model of polydisperse particle in 90° bends of rectangular cross section with simulated results and previous experiments under turbulent flow. (Color figure available online.)
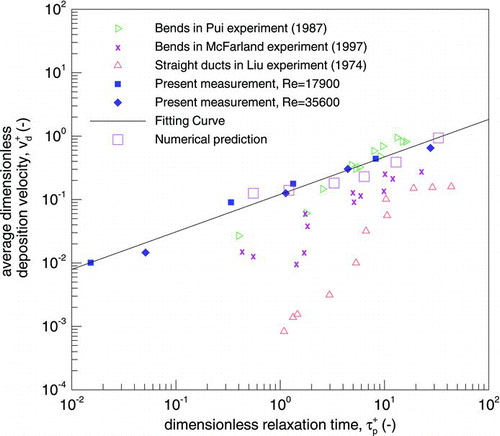
Deposition velocity in bends are approximately one to two orders of magnitude larger than those in straight ducts (Liu and Agarwal Citation1974) under τ+ p =0.34−27.6. The major reason of the magnitude increase would be the impaction between fluid flow and outer bend wall for particle flow in bends. For particles of small relaxation time, deposition velocity increase is more distinct due to bend induced higher turbulence than that in straight ducts. also shows previous experimental data (Pui et al. Citation1987; McFarland et al. Citation1997) in small tube bends for comparison. It can be seen that current solid particles of actual composition in ventilation bends show similarities in deposition trends, slight difference in the trend directions and generally larger deposition magnitude with those laboratory tests of droplets under their conditions. One of the main advantages of circular bends is that secondary flows are not serious in this type of bends. The observed higher deposition velocities in current measurement are probably caused by secondary flows in adopted ventilation bends of rectangular cross section. Turbulent eddies in secondary flows push particles onto bend wall surfaces, and the result of deposition is much severer for particles of small relaxation time as shown in . In other words, in the diffusion-impaction region of 0.1<τ+ p ⩽10 (Wood Citation1981), turbulent eddies and secondary flows control the particle deposition process in such type of bends besides impaction of the bulk flow onto outer bend wall. A further detail discussion about the influence mechanism of fluid on particles in bend is presented in the “Flow Structures through Bends” of the online supplemental information. With the increase of relaxation time, current deposition increase is slightly slower than that of previous measurements in small tube bends of circular section. This observation means that the slope of deposition velocity is smaller than those of previous data. One reason is that the turbulent eddies and secondary flows influence less on large particles, especially in the inertia-moderated region of τ+ p >10 (Wood Citation1981). A further reason may be contributed by increased particle-wall impact effect on large particles (Kliafas and Holt Citation1987; Sun et al. Citation2011). Although these particles reach the wall through momentum imparted by bulk flow or large eddies, a large proportion will rebound from the wall. Detailed numerical and analytical analysis about the mechanism of observed phenomena is demonstrated in the following section.
Numerical and Analytical Analysis of Measured Particle Deposition
To explain the measured results on a more physical basis, numerical approach was conducted to solve the governing equations of air and particle flow through bends. The air phase was predicted by Eulerian method with generic computational fluid dynamic (CFD) approach. Depending on an assumption of little influence of particle on airflow, the particle phase was solved by a one-way particle Lagrangian method. The solid particle collision on bend wall was modeled into the particle tracking method. Detailed descriptions have been reported of the numerical models and procedures, as well as validation with the measurement data using Laser Doppler Velocimetry (LDV) (Sun et al. Citation2012).
illustrates the comparison between predicted deposition velocity and the current experimental data. It is demonstrated that adopted numerical approach predicts particle deposition velocities with high consistency to measured values in trend and magnitude. This prediction confirms that solid particle deposition has varied trend and magnitude with that of droplet in bends of rectangular cross section as shown in . This phenomenon can be justified by analyzing the particle-wall collision analytically since the main mechanism of bend flow has been clarified as the impaction on the outer wall. Based on the particle-wall collision model (Brach and Dunn Citation1998; Sun et al. Citation2012), the coefficient of restitution, e, is defined as,
Empirical Model from Experimental Data
As demonstrated in , it is interesting to find that, the measured dimensionless deposition velocities on a log scale fall just on a straight fitting line. This trend phenomena can also be observed in the experimental reports of Sippola and Nazaroff (Citation2005) although some data scattered in one or two order of magnitude. This linear relationship can be described as following equation:
That the r2 value of this equation is 0.98, indicates a well-fitting between the curve and experimental data. Combining EquationEquations (6)–Equation(9), the deposition velocity can be deducted as,
This expression seems to infer that, under present experimental condition, the composite deposition velocity in 90° bends is only a function of air and particle properties and friction velocity. This behavior is probably attributed to the deduction process that, in EquationEquation (6), particle deposition velocity is formed through control volume method. Furthermore, the relationship above can be applied to EquationEquation (6) and EquationEquations (1)–Equation(3), and the following formulation of particle penetration is finalized as,
illustrates the comparison of this empirical model under two Reynolds numbers measured at the present experiment. The results from fitting model of EquationEquations (13) and Equation(14) are shown to be consistent with measurement data. For low Stokes number, the penetrations at two Reynolds number are almost the same. The maximum difference between the model and experimental data is about 0.03 (i.e., within 5%) at St=0.55. When Reynolds number changes from 17,900 to 35,600 (about two times), penetration only decreases about 10% at St = 0.55. This behavior confirms the statement that Reynolds number does not alter the penetration trend significantly. These empirical equations are practical and user-friendly for researchers and users in aerosol technology applications. The only input parameters are bend geometry and friction velocity. The model is valid under τ+ p =0.0152−27.6 or St = 5.2 × 10⁻⁴–0.55 for Re = 17,900–35,600 under the present measurement conditions.
CONCLUSIONS
This article investigated the particle deposition in 90° bends of rectangular cross sections by experimental method. Particle concentrations at bend inlet and outlet were measured and the averaged penetration and deposition velocity were determined and analyzed. All the air and particle flow evaluations with error analysis show confident reproducibility of the current experiments. The key experimental results are concluded as below:
| 1. | In current conditions, particle concentrations are nearly fully developed to determine bend deposition after traveling a straight duct of 14Dh distance. Compared to particle penetration in bends, the deposition velocity is more sensitive to small condition changes such as the length of straight duct ahead of bends and Reynolds number. | ||||
| 2. | The bend penetration reduced from approximately 100% for St = 5.2 × 10⁻⁴ particles to 64% for St = 0.55 particles in acrylic glass bends under Re = 17,900 and 35,600. This phenomenon indicates the key factor of deposition is inertia. | ||||
| 3. | Current results agree with previous studies for particles of small Stokes number St = 5.2 × 10⁻⁴–8.9 × 10⁻². This behavior justifies the effectiveness of the measurement process and reveals that turbulent transportation is the main reason for transporting particles through bends. | ||||
| 4. | The trend of average deposition velocities showed an unaffected manner with Reynolds number within τ+ p = 0.34–27.6, yet the measurement uncertainty increases with it. The dimensionless deposition velocity is found to be directly proportional to dimensionless relaxation time on log scales. | ||||
| 5. | The major mechanism for deposition velocity increase is the impaction between the particle flow and outer bend wall compared to that in straight ducts. For particles of small relaxation time, deposition velocity increase is more severe than that in straight ducts caused by higher turbulence levels, such as streamwise eddies and more distinct secondary flows in this type of bends. | ||||
| 6. | Deposition behavior of actual solid particle in rectangular section bends presents similar trend with the previous studies, yet the magnitude and direction vary, especially for particles with St larger than 0.089. These behaviors are confirmed by numerical prediction and analytical analysis. Weakened depositions of these large particles are probably attributed to the particle-wall collision effect along with the centrifugal force. | ||||
| 7. | Two empirical models are deducted from the experimental data. The empirical equation of deposition velocity gives a correlation with air and particle properties and friction velocity, yet the penetration formula is discovered to associate with bend dimensions. These empirical equations are proposed and valid under the present experimental condition with τ+ p =0.0152−27.6 or St = 5.2 × 10⁻⁴–0.55 for Re = 17,900–35,600. The models could be utilized to predict particle deposition in bends with rectangular cross sections, and to provide advices for designing the ventilation ducts to prevent airborne particle contaminant. | ||||
Supplementary Files.zip
Download Zip (113.6 KB)Acknowledgments
This work was financially supported by The Hong Kong Polytechnic University through research grants A-PJ61 and A-PJ12. The authors would like to thank Professor S. C. Lee from the Department of Civil and Structural Engineering and Professor H. X. Yang from the Department of Building Services Engineering, The Hong Kong Polytechnic University and their group members for their kind help.
[Supplementary materials are available for this article. Go to the publisher's online edition of Aerosol Science and Technology to view the free supplementary files.]
REFERENCES
- ASHRAE . 2009 . ASHRAE Handbook: Fundamentals. American Society of Heating, , Knovel : Refrigerating and Air-Conditioning Engineers .
- Baron , P. A. , Kulkarni , P. and Willeke , K. 2011 . Aerosol Measurement : Principles, Techniques, and Applications , Hoboken , NJ : Wiley .
- Brach , R. M. and Dunn , P. F. 1998 . Models of Rebound and Capture for Oblique Microparticle Impacts . Aerosol Sci. Technol. , 29 ( 5 ) : 379 – 388 .
- Chao , C. Y. H. , Wan , M. P. , Morawska , L. , Johnson , G. R. , Ristovski , Z. D. Hargreaves , M. 2009 . Characterization of Expiration air Jets and Droplet Size Distributions Immediately at the Mouth Opening . J. Aerosol Sci. , 40 ( 2 ) : 122 – 133 .
- Jiang , H. , Lu , L. and Sun , K. 2011 . Experimental Study and Numerical Investigation of Particle Penetration and Deposition in 90° Bent Ventilation Ducts . Build. Environ. , 46 ( 11 ) : 2195 – 2202 .
- Jin , H. H. , Li , Q. P. , Chen , L. H. , Fan , J. R. and Lu , L. 2009 . Experimental Analysis of Particle Concentration Heterogeneity in a Ventilated Scale Chamber . Atmos. Environ. , 43 ( 28 ) : 4311 – 4318 .
- Kliafas , Y. and Holt , M. 1987 . LDV Measurements of a Turbulent Air-Solid 2-Phase Flow in a 90° Bend . Exp. Fluids , 5 ( 2 ) : 73 – 85 .
- Knight , J. 2003 . Researchers Get to Grips with Cause of Pneumonia Epidemic . Nature , 422 ( 6932 ) : 547 – 548 .
- Kvasnak , W. , Ahmadi , G. , Bayer , R. and Gaynes , M. 1993 . Experimental Investigation of Dust Particle Deposition in a Turbulent Channel Flow . J. Aerosol Sci. , 24 ( 6 ) : 795 – 815 .
- Lai , A. C. K. , Byrne , M. A. and Goddard , A. J. H. 1999 . Measured Deposition of Aerosol Particles on a Two-Dimensional Ribbed Surface in a Turbulent Duct Flow . J. Aerosol Sci. , 30 ( 9 ) : 1201 – 1214 .
- Lai , A. C. K. and Nazaroff , W. W. 2000 . Modeling Indoor Particle Deposition from Turbulent Flow Onto Smooth Surfaces . J. Aerosol Sci. , 31 ( 4 ) : 463 – 476 .
- Li , Y. , Leung , G. M. , Tang , J. W. , Yang , X. , Chao , C. Y. H. Lin , J. Z. 2007 . Role of Ventilation in Airborne Transmission of Infectious Agents in the Built Environment—A Multidisciplinary Systematic Review . Indoor Air , 17 ( 1 ) : 2 – 18 .
- Lin , J. Z. , Shi , X. and You , Z. J. 2003 . Effects of the Aspect Ratio on the Sedimentation of a Fiber in Newtonian Fluids . J. Aerosol Sci. , 34 ( 7 ) : 909 – 921 .
- Liu , B. Y. H. and Agarwal , J. K. 1974 . Experimental Observation of Aerosol Deposition in Turbulent Flow . J. Aerosol Sci. , 5 ( 2 ) : 145 – 148 . IN141-IN142, 149–155
- McFarland , A. R. , Gong , H. , Muyshondt , A. , Wente , W. B. and Anand , N. K. 1997 . Aerosol Deposition in Bends with Turbulent Flow . Environ. Sci. Technol. , 31 ( 12 ) : 3371 – 3377 .
- Peters , T. A. and Leith , D. 2004a . Measurement of Particle Deposition in Industrial Ducts . J. Aerosol Sci. , 35 ( 4 ) : 529 – 540 .
- Peters , T. M. and Leith , D. 2004b . Modeling Large-Particle Deposition in Bends of Exhuast Ventilation Systems . Aerosol Sci. Technol. , 38 ( 12 ) : 1171 – 1177 .
- Pope , C. A. and Dockery , D. W. 2006 . Health Effects of Fine Particulate Air Pollution: Lines that Connect . J. Air Waste Manage. Assoc. , 56 ( 6 ) : 709 – 742 .
- Pui , D. Y. H. , Romaynovas , F. and Liu , B. Y. H. 1987 . Experimental-Study of Particle Deposition in Bends of Circular Cross-Section . Aerosol Sci. Technol. , 7 ( 3 ) : 301 – 315 .
- Sehmel , G. A. 1973 . Particle eddy Diffusivities and Deposition Velocities for Isothermal Flow and Smooth Surfaces . J. Aerosol Sci. , 4 ( 2 ) : 125 – 138 .
- Sippola , M. R. 2002 . Particle Deposition in Ventilation Ducts , Berkeley , CA : Ph.D. Diss., University of California .
- Sippola , M. R. and Nazaroff , W. W. 2004 . Experiments Measuring Particle Deposition from Fully Developed Turbulent Flow in Ventilation Ducts . Aerosol Sci. Technol. , 38 ( 9 ) : 914 – 925 .
- Sippola , M. R. and Nazaroff , W. W. 2005 . Particle Deposition in Ventilation Ducts: Connectors, Bends and Developing Turbulent Flow . Aerosol Sci. Technol. , 39 ( 2 ) : 139 – 150 .
- Song , X. Q. , Lin , J. Z. , Zhao , J. F. and Shen , T. Y. 1996 . Research on Reducing Erosion by Adding Ribs on the Wall in Particulate Two-Phase Flows . Wear , 193 ( 1 ) : 1 – 7 .
- Sun , K. , Lu , L. and Jiang , H. 2011 . A Computational Investigation of Particle Distribution and Deposition in a 90° Bend Incorporating a Particle-Wall Model . Build. Environ. , 46 ( 6 ) : 1251 – 1262 .
- Sun , K. , Lu , L. and Jiang , H. 2012 . A Numerical Study of Bend-Induced Particle Deposition in and Behind Duct Bends . Build. Environ. , 52 : 77 – 87 .
- Wang , S. , Zhao , B. , Zhou , B. and Tan , Z. C. 2012 . An Experimental Study on Short-Time Particle Resuspension from Inner Surfaces of Straight Ventilation Ducts . Build. Environ. , 53 : 119 – 127 .
- WHO . 2006 . Air Quality Guidelines for Particulate Matter, Ozone, Nitrogen Dioxide and Sulfur Dioxide, Global Update 2005, Summary of Risk Assessment , Geneva , , Switzerland : World Health Organization .
- Wilson , S. R. , Liu , Y. A. , Matida , E. A. and Johnson , M. R. 2011 . Aerosol Deposition Measurements as a Function of Reynolds Number for Turbulent Flow in a Ninety-Degree Pipe Bend . Aerosol Sci. Technol. , 45 ( 3 ) : 364 – 375 .
- Wood , N. B. 1981 . The Mass-Transfer of Particles and Acid Vapor to Cooled Surfaces . J. Inst. of Energy, , 54 ( 419 ) : 74 – 93 .
- Yu , M. Z. and Lin , J. Z. 2010 . Nanoparticle-Laden Flows Via Moment Method: A Review . Int. J. Multiph. Flow , 36 ( 2 ) : 144 – 151 .
- Zhang , H. F. and Ahmadi , G. 2000 . Aerosol Particle Transport and Deposition in Vertical and Horizontal Turbulent Duct Flows . J. Fluid Mech. , 406 : 55 – 80 .
- Zhang , Z. and Chen , Q. 2009 . Prediction of Particle Deposition onto Indoor Surfaces by CFD with a Modified Lagrangian Method . Atmos. Environ. , 43 ( 2 ) : 319 – 328 .
- Zhao , B. and Wu , J. 2007 . Particle Deposition in Indoor Environments: Analysis of Influencing Factors . J. Hazard. Mater. , 147 ( 1–2 ) : 439 – 448 .
- Zhou , B. , Zhao , B. and Tan , Z. C. 2011 . How Particle Resuspension from Inner Surfaces of Ventilation Ducts Affects Indoor Air Quality—A Modeling Analysis . Aerosol Sci. Technol. , 45 ( 8 ) : 996 – 1009 .
- Zhu , Y. Y. , Zhao , B. , Zhou , B. and Tan , Z. C. 2012 . A Particle Resuspension Model in Ventilation Ducts . Aerosol Sci. Technol. , 46 ( 2 ) : 222 – 235 .