Abstract
We report a protocol for using black carbon (BC) aerosol as the seed for secondary organic aerosol (SOA) formation in an environmental chamber. We employ a single-particle soot photometer (SP2) to probe single-particle SOA coating growth dynamics and find that SOA growth on nonspherical BC aerosol is diffusion-limited. Aerosol composition measurements with an Aerodyne high resolution time-of-flight aerosol mass spectrometer (AMS) confirm that the presence of BC seed does not alter the composition of SOA as compared to self-nucleated SOA or condensed SOA on ammonium sulfate seed. We employ a 3-wavelength photoacoustic soot spectrometer (PASS-3) to measure optical properties of the systems studied, including fullerene soot as the surrogate BC seed, nucleated naphthalene SOA from high-NOx photooxidation, and nucleated α-pinene SOA from low-NOx photooxidation. A core-and-shell Mie scattering model of the light absorption enhancement is in good agreement with measured enhancements for both the low- and high-NOx α-pinene photooxidation systems, reinforcing the assumption of a core-shell morphology for coated BC particles. A discrepancy between measured and modeled absorption enhancement factors in the naphthalene photooxidation system is attributed to the wavelength-dependence of refractive index of the naphthalene SOA. The coating of high-NOx α-pinene SOA decreases after reaching a peak thickness during irradiation, reflecting a volatility change in the aerosol, as confirmed by the relative magnitudes of f43 and f44 in the AMS spectra. The protocol described here provides a framework by which future studies of SOA optical properties and single-particle growth dynamics may be explored in environmental chambers.
Copyright 2013 American Association for Aerosol Research
1. INTRODUCTION
Refractory black carbon (rBC), alternately referred to as elemental carbon, is the dominant component of light-absorbing atmospheric aerosol. While rBC refers to the strongly light-absorbing component of soot, emission sources containing rBC, such as diesel exhaust, may contain other constituents such as polycyclic aromatic hydrocarbons (PAHs), aliphatic hydrocarbons, and other volatile compounds (Schauer et al. Citation1996; Kleeman et al. Citation2000; Fruin et al. Citation2004). These organic compounds co-emitted with rBC evaporate substantially upon dilution from the tailpipe to ambient conditions (Robinson et al. Citation2007).
The traditional understanding is that fresh, urban-emitted rBC is almost entirely composed of hydrophobic rBC and is unlikely to act as cloud condensation nuclei (CCN) (Weingartner et al. Citation1997). After emission, rBC particles can become coated by inorganic and organic non-light-absorbing components via coagulation with other particles and condensation of vapors (Abel et al. Citation2003; Pósfai et al. Citation2003; Riemer et al. Citation2004; Moffet and Prather Citation2009). Recent studies with a single-particle soot photometer (SP2) have revealed that fresh, urban-emitted rBC particles may be thinly coated with light-scattering material, while rBC in aged air masses tends to be more thickly coated (Moteki et al. Citation2007; Shiraiwa et al. Citation2007, Citation2008; Schwarz et al. Citation2008a; Subramanian et al. Citation2010; Metcalf et al. Citation2012). Timescales for the transition from a fresh to a more aged state have been estimated to range from 12 h to a day (Johnson et al. Citation2005; Moteki et al. Citation2007; Khalizov et al. Citation2009a; Park et al. Citation2012). Interactions with gas and aerosol species transform rBC into an internally mixed state, where it may eventually serve as a CCN (Zuberi et al. Citation2005). Hygroscopic coatings also enhance the wet deposition rate of these particles (Weingartner et al. Citation1997; Saathoff et al. Citation2003; Jacobson Citation2006; Stier et al. Citation2006). A coating of non-light-absorbing components onto rBC increases the light scattering and absorption cross sections of these particles (Fuller et al. Citation1999; Saathoff et al. Citation2003; Schnaiter et al. Citation2005; Bond et al. Citation2006; Mikhailov et al. Citation2006; Stier et al. Citation2006; Slowik et al. Citation2007a; Zhang et al. Citation2008; Wehner et al. Citation2009; Khalizov et al. Citation2009b; Cross et al. Citation2010; Lack and Cappa Citation2010; Shiraiwa et al. Citation2010). At least one ambient study, however, found no evidence of an enhancement of light absorption by condensation of secondary material (Chan et al. Citation2010b). A study of ambient rBC in Toronto showed no detectable change in absorption enhancement between fresh and aged aerosol but attributed this observation to the fact that the fresh rBC had a sufficient coating such that additional coatings did not further enhance absorption (Knox et al. Citation2009).
While ambient rBC measurements have revealed valuable insights into the aging process, namely coating thicknesses and growth timescales, important questions still remain. What mechanisms govern the transition from externally to internally mixed rBC aerosol? Does rBC, acting as a site for condensation of secondary organic aerosol (SOA), affect the composition of the SOA as compared to SOA condensed onto other aerosol types or nucleated homogeneous aerosol? To what extent are the coatings on rBC sufficiently volatile to evaporate upon dilution? Of what physical structure is the rBC and its “coating” and how might this affect interpretation of absorption enhancements seen (or not seen) in ambient data?
Controlled laboratory experiments of rBC aging can isolate some of the complexities of the aging process. The absorption enhancement that arises from coating nascent soot particles with a variety of non-light-absorbing materials is readily measured (Saathoff et al. Citation2003; Schnaiter et al. Citation2003, Citation2005; Mikhailov et al. Citation2006; Slowik et al. Citation2007a; Zhang et al. Citation2008; Khalizov et al. Citation2009b; Cross et al. Citation2010). Initially fractal soot agglomerates tend to compact substantially after a coating has formed (Saathoff et al. Citation2003; Slowik et al. Citation2007b; Zhang et al. Citation2008; Khalizov et al. Citation2009a,Citationb; Cross et al. Citation2010; Bueno et al. Citation2011). In addition, rBC and polystyrene latex spheres (PSL) of the same mobility are observed to acquire sulfuric acid coatings at the same rate, indicating that the coating mechanism is independent of particle composition and shape (Khalizov et al. Citation2009a).
Limited laboratory chamber studies of SOA growth in the presence of soot seed particles exist. Studies at the University of North Carolina Ambient Air Research Facility have focused on how the presence of soot affects gas-particle partitioning and found that diffusional mass transfer is the limiting control on gas-particle partitioning (Strommen and Kamens Citation1997, Citation1999), and that the polarity of the seed particles, including diesel and wood soot, and the gas-phase organic compounds can affect the gas-particle equilibrium partitioning (Leach et al. Citation1999). These studies have focused on the partitioning between gas and particle phases rather than any unique chemical or physical properties of either the gases or the soot. Studies at the Aerosols, Interactions and Dynamics in the Atmosphere (AIDA) chamber facility report the enhancement of light absorption by soot seed particles coated with α-pinene ozonolysis SOA (Saathoff et al. Citation2003) and evaluate absorption enhancements by particle coagulation and growth of SOA (Schnaiter et al. Citation2003, Citation2005). These studies have focused primarily on the optical and morphological properties of the soot as growth of SOA or coagulation with other particles occurs in the chamber. Studies at the Carnegie Mellon University environmental chamber found that SOA formed by the photooxidation of evaporated diesel exhaust exceeded by a wide margin the SOA mass predicted by a model including the classified hydrocarbons (Weitkamp et al. Citation2007). A study at the Paul Scherrer Institute (PSI) smog chamber characterized the chemical composition and emission factors of primary and secondary organic aerosol from three diesel vehicles with various engine after-treatment systems (Chirico et al. Citation2010). These studies have focused on characterizing SOA from the many gas-phase precursors found in diesel exhaust or on the efforts to clean up the exhaust from diesel engines. Most of the studies listed above used fresh diesel or wood soot, which typically has a thin layer of nonrefractory material on the rBC or has soot co-emitted with many gas-phase species, such as PAHs. Uncoated spark-generated soot was also used and has been found to be chemically and optically different than diesel soot and is, therefore, not a good surrogate for atmospheric rBC (Kirchner et al. Citation2003; Schnaiter et al. Citation2003). Commercially available fullerene soot is a fractal, hydrophobic particle that most resembles ambient rBC in the SP2 instrument (Moteki and Kondo Citation2010; Laborde et al. Citation2012) and is structurally similar to diesel soot (Moteki et al. Citation2009), although chemical and optical comparisons to ambient soot have yet to be reported.
TABLE 1 Summary of experiments
A principal goal of this study is to demonstrate the utility of chamber experiments that employ fullerene soot as a refractory black carbon seed aerosol in conjunction with the single-particle soot photometer, the photoacoustic soot spectrometer, and the aerosol mass spectrometer to probe the dynamics of secondary aerosol formation. Three SOA systems were studied to demonstrate the utility of this experimental protocol on a variety of chemical and optical properties. To distinguish this study from previous chamber studies with soot, the rBC surrogate used in this study is dry, uncoated fullerene soot to avoid artifacts from coatings and additional hydrocarbons that are present with, for example, diesel soot. Particle-by-particle measurements of the coating thickness of SOA on the rBC seed by the SP2 directly reveal dynamic growth and evaporation processes. Once SOA growth has reached a point at which the coating thickness is no longer changing appreciably, chamber dilution can be used to provide a driving force for SOA evaporation and an assessment of SOA volatility through decrease of coating thickness. Simultaneous particle optical property and coating composition measurements provide data that can relate growth and evaporation behavior to SOA chemical composition. A fundamental chemical examination of the composition changes during SOA growth is beyond the scope of this study; however, demonstrating that composition changes occur coincidentally with changes in rBC coating thicknesses and aerosol optical properties provide a framework by which future mechanistic studies may be carried out.
2. METHODS
2.1. Experimental Protocols
Experiments () were conducted in the Caltech dual 28-m3 Teflon chambers. Details of the facilities are given elsewhere (Cocker et al. Citation2001; Keywood et al. Citation2004). Before each experiment, the chambers were flushed with dried, purified air for >24 h, until the particle number concentration (<10 cm−3), mass concentration (<0.1 μg m−3), and hydrocarbon mixing ratios were below detection limits of the instruments. Seeded experiments were conducted with two types of seeds; fullerene soot (stock #40971, lot #L20W054, Alfa Aesar, Ward Hill, MA, USA) as a fractal, rBC surrogate and ammonium sulfate (AS) as a spherical inorganic particle alternative. Fullerene soot particles were generated by nebulizing a suspension of fullerene soot and milliQ water until the desired particle volume concentration in the chamber was reached. Prior to nebulizing, the fullerene soot suspension was sonicated for ∼20 min to facilitate the mixing of the hydrophobic soot particles in water and to break up any large agglomerates. Ammonium sulfate (AS), a commonly used seed particle in environmental chambers, was injected into the chamber by atomizing a 0.015 M aqueous ammonium sulfate solution. In the “AS + rBC” experiments denoted in , ammonium sulfate was injected into the chamber and allowed to mix for ∼30 min while gas-phase species were loaded into the chamber before injection of the fullerene soot. Upon injection of rBC in these dual seed experiments, an attempt was made to match the calculated particle surface areas of the AS and rBC from online scanning mobility particle sizer measurements. The median mobility diameter of the AS seed was ∼90 nm while for the fullerene soot the median mobility diameter was ∼140 nm (Figure S1b).
Experiments were run under both low- and high-NOx conditions using hydrogen peroxide (H2O2) and methyl nitrite (CH3ONO) as the OH sources, respectively. H2O2 was injected into the chamber by evaporating 280 μL of 50% wt aqueous solution into the chamber with 5 L min−1 of purified air. CH3ONO was vaporized into an evacuated 500 mL glass bulb and introduced into the chamber with 5 L min−1 of purified air. CH3ONO was synthesized following the method described by Taylor et al. (Citation1980) and modified by Chan et al. (Citation2010a).
Two SOA precursors were studied: naphthalene and α-pinene. Naphthalene is an important polycyclic aromatic hydrocarbon (PAH) that, like rBC, is a product of incomplete combustion in diesel engines and biomass burning (Schauer et al. Citation1999, Citation2001; Ravindra et al. Citation2008). PAHs, in general, may account for as much as one-half of SOA from diesel emissions (Chan et al. Citation2009). Napthalene (99%, Sigma-Aldrich, St. Louis, MO, USA) was introduced into the chamber by flowing 1 L min−1 purified air through an FEP Teflon tube packed with solid naphthalene (Chan et al. Citation2009). α-Pinene, the most abundantly emitted monoterpene, is an important biogenic volatile organic compound (VOC), with global emissions of 34–50 Tg C yr−1 (Guenther et al. Citation1995; Chung and Seinfeld Citation2002; Pye et al. Citation2010). α-Pinene was introduced into the chamber by injecting a volume of liquid into a glass bulb, and the vapor was carried into the chamber with 5 L min−1 of purified air. All naphthalene experiments were conducted in the same chamber, while all but one α-pinene experiment (Experiment 8 in ) were conducted in the other chamber. In all experiments, the chamber contents, seed particles, parent hydrocarbon, and OH source, were allowed to mix for 1 h before beginning irradiation. In most experiments, after maximum particle growth was obtained, the UV lights were turned off and the chamber was diluted ∼12–18 h while sampling continued. After irradiation was stopped and before chamber dilution began, cyclohexane, injected by a method similar to α-pinene injection, was introduced to the chamber to be used as a tracer for dilution.
2.2. Instrumentation
A suite of instruments was used to study the evolution of the gas and particle phases. The parent hydrocarbons and dilution tracer were measured using a gas chromatograph with flame ionization detector (GC/FID, Model 6890N, Agilent Technologies, Inc., Santa Clara, CA, USA), equipped with an HP-5 column (15 m × 0.53 mm ID × 1.5 μm thickness, Agilent). The GC/FID response to naphthalene was calibrated by dissolving a known mass of naphthalene in dichloromethane and vaporizing into a 55 L Teflon chamber. The GC/FID response to α-pinene and cyclohexane was calibrated by vaporizing a small volume of liquid into a 50 L chamber and diluting aliquots of that sample into a 55 L chamber. NO and NOx were measured with a chemiluminescence NO/NOx analyzer (Model APNA 360, HORIBA Instruments Incorporated, Irvine, CA, USA). Relative humidity (RH), temperature (T), and O3 were continuously monitored. RH of the chamber was typically <5% during irradiation periods, rising to ∼10% during the overnight chamber dilution. The initial chamber temperature was typically ∼20–24°C; however, heating from the UV lights caused a rise in temperature of ∼4–6°C during irradiation. Initial O3 concentration was typically <5 ppb. Varying amounts of NO were added from a gas cylinder (Scott-Marrin, Riverside, CA, USA) to ensure high NOx conditions at the start of most experiments, except where noted in . Aerosol size distribution and number concentration were measured continuously using a custom-built scanning mobility particle sizer consisting of a differential mobility analyzer (DMA, Model 3081, TSI Incorporated, Shoreview, MN, USA) coupled to a condensation particle counter (CPC, Model 3010, TSI), henceforth referred to as the DMA.
Refractory black carbon (rBC) mass measurements were made with a Droplet Measurement Technologies (DMT, Boulder, CO, USA) Single Particle Soot Photometer (SP2). The SP2 affords measurements of both the particle-by-particle rBC mass as well as the thickness of non-rBC coating on each particle (Stephens et al. Citation2003; Baumgardner et al. Citation2004; Schwarz et al. Citation2006; Moteki and Kondo Citation2007; Slowik et al. Citation2007a). This particular SP2 was used in a previous study (Metcalf et al. Citation2012) and the only difference in configuration was an increase in the gain setting on the narrowband incandescence channel to increase sensitivity to rBC mass. Calibrations, as detailed by Metcalf et al. (Citation2012), were repeated just prior to this set of chamber experiments. Aquadag (Aqueous Deflocculated Acheson Graphite, Acheson Colloids Company, Port Huron, MI, USA) was mobility-selected by a DMA and sampled by the SP2. Because the SP2 is known to be more sensitive to Aquadag than to other rBC standards (Laborde et al. Citation2012), a correction factor of 25% is used to relate the SP2 signals to fullerene soot mass (Baumgardner et al. Citation2012). Estimated uncertainty in single-particle mass determination is ∼40%, based largely on the uncertainty in Aquadag mass during calibration and the relationship to fullerene soot mass. To relate rBC mass to particle size, the volume-equivalent diameter (VED) is calculated assuming the rBC is a void-free sphere with an effective mobility density given by Gysel et al. (Citation2011). Note that there is additional uncertainty in the fullerene mobility density because not all batches of fullerene soot have the same effective density (Laborde et al. Citation2012); the batch used in this study differs from that measured by Gysel et al. (Citation2011). With propagation of errors through the calculations, estimated uncertainty in VED is ∼12%.
Real-time particle mass spectra were collected continuously by an Aerodyne high resolution time-of-flight aerosol mass spectrometer (AMS) (Jayne et al. Citation2000; DeCarlo et al. Citation2006; Canagaratna et al. Citation2007). The AMS was operated predominantly in the lower resolution, higher sensitivity “V-mode,” but was manually switched periodically to the high resolution “W-mode.” “V-mode” data were analyzed using a fragmentation table to separate sulfate, ammonium, and organic spectra and to time-trace specific m/z ratios. “W-mode” data were analyzed in IGOR Pro (Wavemetrics, Inc., Lake Oswego, OR, USA) using the PIKA 1.10H module to determine the chemical formulas contributing to distinct m/z ratios (DeCarlo et al. Citation2006). The AMS ionization efficiency was calibrated at the beginning of the study using dried, 350 nm NH4NO3 particles. AMS collection efficiency is assumed to be 0.5 to account for particle bounce off the heater inside the instrument (Huffman et al. Citation2005; Middlebrook et al. Citation2012); however, because the collection efficiency could not be explicitly determined for the systems studied, the mass-weighted optical properties calculated in this work use aerosol mass calculated from particle volume concentrations determined by the DMA measurements. Aerosol densities were determined by comparing DMA volume distributions with AMS particle time-of-flight mass distributions following the method described by DeCarlo et al. (Citation2004). AMS mass loadings reported in the figures and in have an overall uncertainty of ∼30% (Bahreini et al. Citation2009). AMS bulk masses are averaged over 3 min intervals.
Aerosol absorption and scattering coefficients (b abs and b sca) were measured with a DMT 3-λ photoacoustic soot spectrometer (PASS-3), which is an instrument based on several previous prototypes (Lewis et al. Citation2008, and references therein). Briefly, submicron aerosol scattering coefficient is determined by an integrating sphere/photodetector at each wavelength, 405 nm, 532 nm, and 781 nm. Aerosol absorption is determined by the photoacoustic method, which uses a microphone to measure sound/pressure waves emanating from heated gas around aerosols absorbing laser light. The PASS-3 scattering signal was calibrated with a concentrated stream of 220 nm polystyrene latex spheres (PSL) and the absorption signal with aerosol from a concentrated Nigrosin dye (product #198285 lot #MKBD9679V, Sigma-Aldrich) solution. Calibrations were performed at particle concentrations much higher than those used in the chamber experiments in order to make use of the laser power meter onboard the instrument and calculate extinction using Beer's Law. The linear response of the PASS-3 is appropriately extrapolated to experiment-relevant values because of the linearity of the detectors (Cross et al. Citation2010, supplement). During this study, data from the λ = 532 nm channel were deemed unreliable due to a hardware malfunction and have been omitted from the analysis. Lower detection limit is estimated by three times the standard deviation of signal noise during particle-free sampling. The lower detection limits for b abs are 24.62 ± 0.36 and 3.89 ± 0.65 Mm−1 and for b sca are 10.40 ± 1.42 and 8.20 ± 1.64 Mm−1 for λ = 405 and 781 nm, respectively. Absolute accuracy at aerosol levels relevant to this study was not determined; however, other PASS-3 instruments have reported absolute accuracy well within 20% (Flowers et al. Citation2010, supplement). In this work, measured absorption enhancement, Em abs,λ, is defined as
A prototype instrument was used to detect particle sphericity by single-particle laser light scattering (see the online supplemental information). Briefly, single particles are brought into a circularly-polarized laser beam (λ = 532 nm) and the angular pattern of light scattered off the particle is detected with a photomultiplier tube (PMT) assembly. Eight detectors positioned at a polar angle of 50° in the forward scattering direction measure light scattered onto lenses at one end of fiber optic cables, the other ends of which are mounted in front of a PMT assembly that has a single channel devoted to each cable.
According to Mie theory, homogeneous spherical particles scatter circularly polarized light uniformly around the azimuth of a given polar angle. Particle sphericity, the degree to which a given particle acts like a sphere when scattering light, has been measured and analyzed previously with instruments similar to that used here (Dick et al. Citation1994, Citation1998; Sachweh et al. Citation1995). Our analysis follows the same logic as that of previous authors, although our mathematical formulation of sphericity is different (see the online supplemental information). To determine the degree of sphericity, we quantify the deviation among eight sensors at a fixed polar angle, which we call “nonsphericity” (Φ). Little deviation and smaller nonsphericity values are indicative of a spherical particle, while a large deviation and larger nonsphericity values indicate a nonspherical particle. Because the optical fibers differ in length and in radii of curvature between the lenses and the PMT, these artifacts are accounted for in the nonsphericity calculation by quantifying the extent to which each channel has the same deviation from its respective median signal.
2.3. Mie Scattering Model
For determination of single-particle coating thicknesses from SP2 light-scattering measurements and for comparison to bulk optical properties measured by the PASS-3, the Mie scattering model is used to calculate scattering and absorption cross sections for single particles. The Mie scattering model in this study (used previously by Metcalf et al. Citation2012) was adapted from a version of BHMIE (Bohren and Huffman Citation1998) to compute scattering coefficients for a stratified sphere (Toon and Ackerman Citation1981). For interpretation of SP2 scattering signals, the scattering function is integrated over the solid angles subtended by the SP2 detectors to compare the measured and modeled signals (scattering cross section) to derive an optical diameter, from which the coating thickness on the rBC core is determined. Note that coating thicknesses reported in this work are in terms of diameter and are, thus, the particle diameter increase as a result of the coating. Mean coating thicknesses are reported as a number-weighted mean over all detected coating thicknesses over all rBC core sizes. The measured peak scattering signal is derived from a leading edge-only (LEO) fit of the scattering signal in order to correct for evaporating coatings as particles traverse the laser in the SP2 (Gao et al. Citation2007). The rBC refractive index is assumed to be 1.95 + 0.79i (Bond and Bergstrom Citation2006), and a coating refractive index of 1.5 + 0.0i is used, matching previous studies (Schwarz et al. Citation2008a,Citationb; Metcalf et al. Citation2012). Uncertainty in retrieved coating thickness from the SP2 scattering signal is ∼40% (Metcalf et al. Citation2012). The Mie scattering model of SP2 signals is also used to determine the size of purely scattering particles. Again, a refractive index of 1.5 + 0.0i and the LEO fitting method on the measured scattering signal are used, and the optical size range of detection is 169–600 nm. Estimated uncertainty in retrieved optical diameter is ∼5% for purely scattering particles.
For comparison to the measured absorption enhancement factors, the Mie model is used to calculate a time-dependent absorption enhancement factor from the mean coating thicknesses retrieved from SP2 measurements. Because total scattering and absorption is considered, integration over the SP2 detection angles is not carried out in this calculation. At each time interval, rBC core sizes from SP2 incandescence signals are binned into 36 core size bins spanning 90–265 nm VED and into 37 coating thickness bins of −60–300 nm diameter, based on the detected scattering cross sections. Note that negative coating thicknesses at a given rBC VED represent scattering cross sections smaller than what the core-shell Mie model calculates for a particle with zero coating thickness on those rBC cores. These values are necessary to include due to the uncertainties in assumed refractive index and in SP2 calibration. From these binned number of particles, N, a time- and rBC-core-size-dependent mean coating thickness, ![]() , is calculated, from which the Mie model is used to calculate the absorption cross sections, σ
abs,λ
, at λ = 405 and 781 nm. The rBC core-size-dependent enhancement factors,
, is calculated, from which the Mie model is used to calculate the absorption cross sections, σ
abs,λ
, at λ = 405 and 781 nm. The rBC core-size-dependent enhancement factors, ![]() , are calculated from these mean coating thicknesses by
, are calculated from these mean coating thicknesses by
3. RESULTS
3.1. Fullerene Soot Characteristics
3.1.1. Sphericity
presents distributions of nonsphericity values calculated for dry, uncoated fullerene soot (BC), ammonium sulfate (AS), and polystyrene latex spheres (PSL). Lognormal fits to each histogram were calculated to determine the mean nonsphericity values for these populations of particle types (). PSL exhibits the smallest mean nonsphericity value (0.070), while dry, uncoated rBC has the largest (0.353), indicating nonsphericity. The AS sample in was taken from a chamber wall-deposition experiment in which AS seed was injected into a dry (<10% RH) chamber. AS mean nonsphericity is slightly larger than that for PSL, likely indicating that some AS particles do not retain water in the dry chamber. Calibrations with oxalic acid particles (data not shown in , but statistics reported in ) generated with a collision atomizer and sampled directly into the prototype instrument yield a mean nonsphericity similar to that of AS. Dried, cubic salt particles (statistics reported in ), generated by atomizing a solution of NaCl and water and sampling through a nafion dryer directly into the instrument, yield a nonsphericity similar to that for rBC. Like the AS sample, the fullerene soot sample was measured during wall-deposition experiments in which only rBC was present in the chamber. These measurements confirm that the fullerene soot, as we have prepared and loaded into the chamber as seed particles, is nonspherical.
FIG. 1 Distributions of nonsphericity values for ammonium sulfate (AS), fullerene soot (BC) particles, and polystyrene latex spheres (PSL). Each distribution represents ∼10,000 particles sampled at various times throughout the respective experiments. “Relative number” is the number of particles in each bin divided by the maximum number in any bin for the given distribution. Solid lines denote a lognormal fit to a single distribution; only one fit per particle type is shown. Mean nonsphericity values corresponding to lognormal fits to all distributions are given in Table 2. (Color figure available online.)
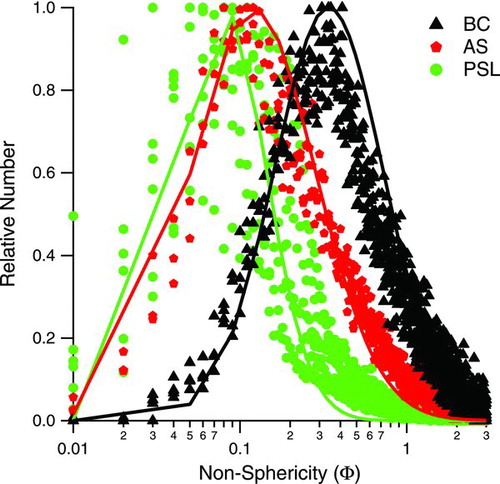
TABLE 2 Summary of nonsphericity values
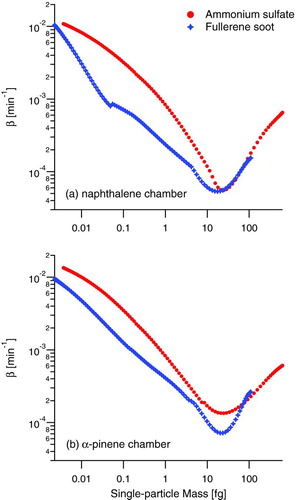
FIG. 2 Particle wall deposition rate coefficients, β, for the two chambers with ammonium sulfate and fullerene soot as the seed particles. Data are displayed by single-particle mass rather than mobility diameter to directly compare AS and BC. Ammonium sulfate mass is calculated from mobility diameter assuming a spherical particle and a density of 1.77 g cm−3. Fullerene soot mass is calculated from mobility diameter using the relation reported by Gysel et al. (Citation2011). (Color figure available online.)
3.1.2. Particle Wall Deposition
In environmental chamber studies, wall-deposition rates must be known in order to calculate SOA yields from a parent hydrocarbon (Keywood et al. Citation2004; Ng et al. Citation2007; Loza et al. Citation2012). Wall deposition processes have been well-described in the literature (Crump and Seinfeld Citation1981; McMurry and Rader Citation1985; Park et al. Citation2001; Pierce et al. Citation2008). Particles in the bulk of the chamber can diffuse or settle through a boundary layer near the chamber wall and deposit on the wall. Electrostatic effects can enhance deposition rates, especially for intermediate-sized particles (50–1000 nm diameter) (McMurry and Rader Citation1985).
Typically, wall-deposition rates are determined by atomizing seed aerosol into a clean chamber and measuring the decay of particle concentration over ∼24 h. From these data, size-dependent, first-order loss coefficients, β, are obtained. Measured wall-deposition rates for both AS seed and fullerene soot seed exhibit differences, as shown in . The wall-deposition rates presented in , calculated from DMA size distribution data, are presented with respect to particle mass rather than mobility diameter in order to better relate the nearly spherical AS with the nonspherical rBC. The different range of masses for the two particle types in is the result of the smaller effective density (0.6–0.35 g cm−3 for mobility diameters 300–800 nm [Gysel et al. Citation2011]) for fullerene soot than for AS (1.77 g cm−3) over all mobility diameters displayed.
The characteristic “V”-shape of the wall deposition rate curves in arises because of two competing processes: diffusion dominates wall deposition at smaller-size (and mass) particles and gravitational settling dominates wall deposition at larger-size (and mass) particles. The fact that the rBC deposition rate achieves a minimum at nearly the same single-particle mass as that for AS particles indicates a similar balance between these effects. At larger masses, where gravitational settling dominates, AS and rBC have similar values of β, indicating reduced effect of particle shape in this range. At smaller masses, however, the significant difference in β reflects differences in diffusion rates to the chamber walls or an invalid assumption of a first-order wall-deposition rate with unit sticking probability.
Because effective density measurements from a coupled DMA-SP2 system are used (Gysel et al. Citation2011), any artifacts in the DMA data used to calculated β in these experiments due to particle nonsphericity should be consistent during the entire wall-deposition experiment. Therefore, the differences in wall-deposition rates between AS and fullerene soot are likely not the product of measurement artifacts. The diffusion rate of the fullerene soot could be less than that for AS particles of the same mass owing to the larger size of the fullerene soot particles. Sticking probabilities may also be smaller for the dry fullerene soot than for the AS particles, which likely retain some water, even in a dry chamber. The implication for the current chamber experiments is that the rate of wall deposition can be expected to change over the course of an experiment as initially uncoated rBC particles become coated. For this reason, SOA yields are not calculated in this study.
3.2. General Experimental Results
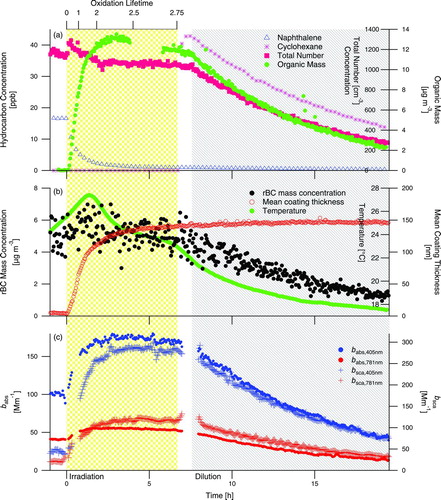
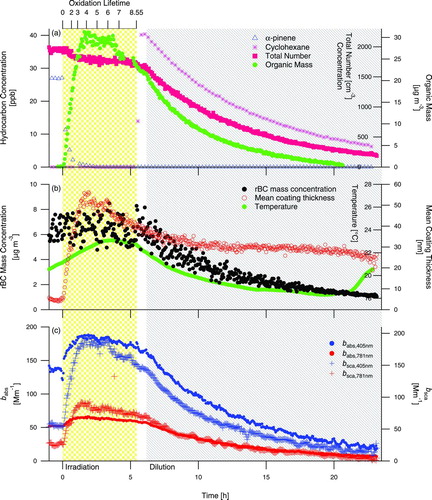
shows the reaction profile during naphthalene photooxidation, Experiment 1 (), in the presence of rBC seed particles. The rapidly formed SOA deposits onto the fullerene soot, as indicated by the immediate increase in mean coating thickness. A modest amount (∼30% by number in the SP2 detection range) of purely scattering particles, presumably from nucleation, are present after growth initiates, indicated by an increase in total number concentration just after the start of irradiation (). Despite the temperature increase that occurs once the UV lights are turned on (), the coating thickness rapidly increases early in the irradiation. Temperature decreases once the lights are turned off, accompanied by only a small increase in mean coating thickness. Single-particle mean coating thickness does not decrease at any point during Experiment 1, indicating that the decrease of aerosol mass during dilution of the chamber is the result of flushing the particles out of the chamber and wall deposition within the chamber and is not due to evaporation of the aerosol itself. The temperature decrease during dilution favors condensation and could influence mean coating thickness; however, the rate of temperature decrease varies during Experiment 1 while the rate of mean coating thickness increase does not vary in the same manner. Thus, it is unlikely that temperature alone is the dominant control of condensation of SOA in this system.
FIG. 3 Experiment 1, naphthalene photooxidation in the presence of rBC seed particles. The shaded regions denote periods of irradiation and dilution of the chamber. (Color figure available online.)
The evolution of coating thickness as a function of rBC core diameter is presented in . About 30 min after the start of irradiation (), rBC particles of all core sizes already have an organic coating growing. As organic growth progresses ( and ), the smaller rBC cores have markedly thicker coatings than the larger rBC cores. After ∼7.5 h of chamber dilution (), there is no clear, systematic evidence of evaporation of these coatings.
FIG. 4 Evolution of coating thickness in Experiment 1, presented as 2-D histograms of coating thickness determined by fitting the SP2 scattering signal to a core-and-shell Mie model binned versus rBC volume-equivalent diameter. The times are in hours after the onset of irradiation. The gray lines are diffusion-controlled growth laws matched to the coating thickness diameter at an rBC VED of 160 nm. (Color figure available online.)
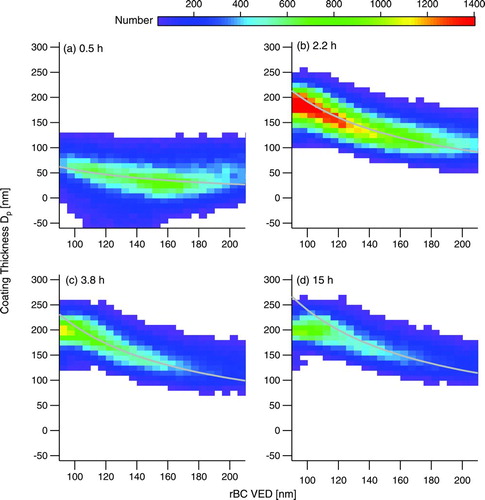
In , lines representing a diffusion-controlled growth law (Seinfeld and Pandis Citation2006) are shown,
presents results from Experiment 5 (), high-NOx α-pinene photooxidation in the presence of fullerene seed particles. Growth of SOA is rapid, indicated by immediate increase of organic mass (), coating thickness (), and change in optical properties (). What differentiates this experiment from the others is that mean coating thickness reaches a peak and then decreases during the irradiation period. Throughout the irradiation period, temperature in the chamber increases, but there is no distinct change in temperature near the peak in coating thickness that would indicate that the aerosol should suddenly start evaporating. Thus, it is likely that the evaporation of coating material is indicative of a chemical change causing particle-phase loss of higher-volatility species. During the irradiation period of Experiment 5, a greater number of oxidation lifetimes (defined in Section 3.4.1) were reached, which may have provided the necessary conditions to allow more chemical aging than the other experiments. The coating evaporation continues after irradiation is stopped, and mean coating thickness does not level off until ∼4.25 h into the dilution period. Examination of the evolution of coating thickness for this system (not shown) reveals that a diffusion-limited growth law continues to be valid, and all rBC core sizes exhibit evaporation of coatings. At the very end of the dilution period, a temperature increase of ∼2°C over the final 2 h of the experiment leads to a coating thickness decrease of ∼5 nm (calculated from 10-min averaged data, not shown), possibly highlighting the role of temperature in SOA volatility. SOA evaporation during chamber irradiation in this system will be further discussed in Section 3.4.2.
FIG. 5 Experiment 5, high-NOx α-pinene photooxidation in the presence of rBC seed particles. The shaded regions denote periods of irradiation and dilution of the chamber. (Color figure available online.)
presents the results from Experiment 7 (), low-NOx α-pinene photooxidation in the presence of fullerene seed particles. In this system, SOA growth proceeds more slowly than in the high-NOx photooxidation systems as a result of a lower OH concentration produced by H2O2 versus CH3ONO. Total particle number concentration () gives no evidence of SOA nucleation and shows a steady decline during irradiation, owing to wall-deposition and particle coagulation. Wall- deposition rates are slightly faster in the α-pinene chamber versus the naphthalene chamber () and characteristic time for coagulation is shorter (∼1.8 d versus ∼3.4 d, respectively) (Seinfeld and Pandis Citation2006) owing to higher initial particle number concentration. Despite a temperature decrease, which favors condensation of SOA (), there is a slight decrease in mean coating thickness during chamber dilution (∼8 nm in ∼10 h). The flushing rate of the chamber does not change during dilution (see cyclohexane curve in ), and the rate of decline in mean coating thickness remains constant as well () despite the change in temperature trend from the first 5 h of flushing (−6.2°C) to the second 5 h of flushing (−0.2°C). A distinguishing feature of this SOA system is the change in SOA growth rate (see organic mass trace in ) coincident with a change in optical properties (see the change in slope of the curves in ) ∼4 h into the chamber irradiation. The change in particle composition during SOA growth in this system will be discussed in Section 3.4.3.
FIG. 6 Experiment 7, low-NOx α-pinene photooxidation in the presence of rBC seed particles. The shaded regions denote periods of irradiation and dilution of the chamber. (Color figure available online.)
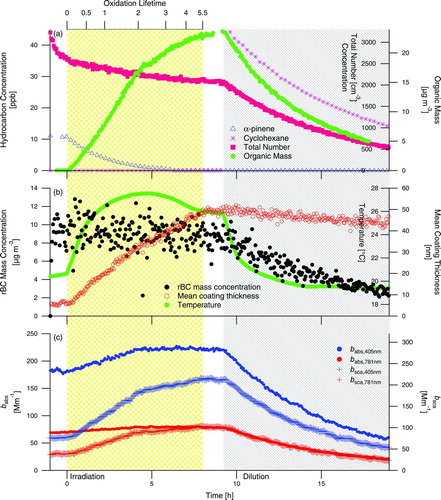
TABLE 3 Optical properties of particles in this study (mean ± 1σa )
In this work, we focus on results from these three SOA systems in the presence of rBC seed aerosol. For completeness, lists all experiments performed for this study. Although not shown in this work, each experiment in was characterized by growth of organic layers on the rBC aerosol. In Experiment 3, the growth of coating by coagulation is estimated to be small (∼20 nm coating diameter in ∼16 h), owing to the modest particle number concentration (∼11,000 cm−3) and coagulation timescale (∼1.3 d). In the dual seed experiments with rBC and AS (Experiments 2, 6, and 8) and with rBC and nucleated SOA (Experiments 4 and 9), growth of coatings occurred during irradiation of the chamber at a faster rate than during the period of mixing prior to irradiation, indicative that growth by condensation of SOA was dominant.
3.3. Aerosol Optical Properties
presents optical properties of the seed particles and nucleated SOA in this study, including the mass scattering cross section (MSC), mass absorption cross section (MAC), single-scatter albedo (ω0), and scattering and absorption Ångström exponents (Åsca and Åabs, respectively), defined as
where bsca/abs is the observed scattering/absorption coefficient at the specified wavelengths. The fullerene soot and ammonium sulfate values are averages of measurements taken during the hour of chamber mixing prior to the start of irradiation on Experiments 1, 5, and 7 for fullerene soot and Experiments 2, 6, and 8 for ammonium sulfate (before injection of fullerene soot). The nucleated naphthalene and α-pinene SOA values are taken before rBC was injected into the chamber on Experiments 3, 4, and 9. The mass absorption cross sections of uncoated fullerene soot (20.23 ± 1.08 m2 g−1 and 7.84 ± 0.26 m2 g−1 at λ = 405 nm and 781 nm, respectively) are higher than reported ensemble averages for uncoated ambient rBC (7.5 ± 1.2 m2 g−1 at λ = 550 nm; Bond and Bergstrom Citation2006), but is certainly within the range of ambient measurements (Kirchstetter et al. Citation2004). In addition, the mass scattering cross section of ammonium sulfate is higher than previously reported ambient values of 2–4 m2 g−1 at λ = 530 nm (Malm et al. Citation2005a,Citationb). Thus, it is possible that the PASS-3 measurements are biased high due to an offset, perhaps the result of calibrating at much higher aerosol concentrations than those used in the chamber experiments. This bias should not affect the calculations of absorption enhancement presented below.
The value of Åabs for fullerene soot (1.44 ± 0.03) is slightly higher than Åabs = 1 recommended for uncoated rBC (Bond and Bergstrom Citation2006) but lies within the range of modeled conditions (Lack and Cappa Citation2010) and ambient measurements of rBC (Gyawali et al. Citation2009).
Nucleated naphthalene SOA exhibits a small absorption signal at λ = 405 nm; these particles may be classified as “brown carbon,” a mildly absorbing carbonaceous aerosol that is distinct from black carbon but has progressively stronger absorption at UV wavelengths as compared to visible wavelengths (Andreae and Gelencsér Citation2006; Wonaschütz et al. Citation2012). Nakayama et al. (Citation2010) found a similar value for MAC at λ = 355 nm for SOA from the photooxidation of toluene, also an aromatic hydrocarbon. Some authors have detected absorption from gaseous PAH's (Weiner and Harris Citation1989; Schoemaecker Moreau et al. Citation2004), but in the present experiments the initial concentration of naphthalene gave no measurable absorption signal in the PASS-3. The measured value of the MAC of 0.81 m2 g−1 at λ = 405 nm for naphthalene SOA is within range of previously measured MAC values for brown carbon (Kirchstetter et al. Citation2004; Hoffer et al. Citation2006; Yang et al. Citation2009; Nakayama et al. Citation2010). For naphthalene SOA, Åabs cannot be explicitly determined due to absorption at λ = 781 nm below PASS-3 detection limits, but it is estimated to be >∼3.5, which is indicative of brown carbon (Flowers et al. Citation2010).
3.3.1. Evolution of Aerosol Optical Properties During SOA Growth on rBC Seed
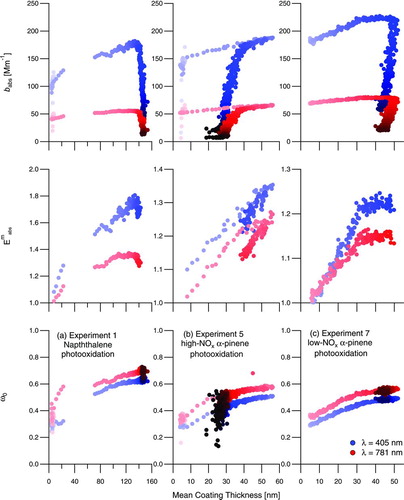
, , and show the absorption and scattering coefficients of the rBC-coated SOA during Experiments 1, 5, and 7, respectively. For all experiments, after UV lights are turned on, a clear increase in absorption coefficients at all wavelengths occurs, while rBC mass remains constant or slightly decreases due to wall deposition. displays absorption coefficient (b abs), measured absorption enhancement (E abs m ), and single-scatter albedo (ω0) as a function of mean coating thickness for Experiments 1, 5, and 7, respectively. Time is shown by marker shading on each figure, generally increasing from left to right because the coating thickness grows during irradiation. For the α-pinene systems ( and ), the coating thickness eventually decreases, slightly during dilution of the low-NOx system () and more dramatically during irradiation of the high-NOx system ().
FIG. 7 Aerosol optical properties as a function of mean coating thickness on the fullerene soot seed during Experiment 1, naphthalene photooxidation (a), Experiment 5, high-NOx α-pinene photooxidation (b), and Experiment 7, low-NOx α-pinene photooxidation (c). Marker shading is a function of time after onset of irradiation, with later times indicated by darker colors. Measured absorption enhancement, E abs m (middle), is presented for the irradiation time period only. (Color figure available online.)
As noted above, there is a small absorption signal from the naphthalene SOA at λ = 405 nm, but not at λ = 781 nm. We expect that naphthalene SOA condensed onto seed particles will exhibit optical properties similar to nucleated naphthalene SOA, and, therefore, that the absorption enhancement in Experiment 1 (, middle) at λ = 781 nm is a result of the lensing effect of the coatings on the rBC seed particles, while at λ = 405 nm there is additional absorption from the coating itself (Fuller et al. Citation1999; Lack and Cappa Citation2010). In Experiment 1, Åabs increased from 1.37 ± 0.029 to 1.76 ± 0.026 during irradiation, indicating that the aerosol absorption at peak growth is more sensitive to wavelength than the uncoated fullerene soot seed. This is consistent with a small absorption coefficient at λ = 405 nm of the condensed naphthalene SOA () and exceeds the threshold (1.6) for which attribution of brown carbon to observed absorption can be made (Lack and Cappa Citation2010). The sharp decrease in b abs (, top) occurs simultaneously with the start of chamber dilution. The apparent gap in data between ∼25 and 75 nm thickness is a result of the rapid growth of the coatings during irradiation and the timing of an automatic background signal correction on the PASS-3.
In Experiment 5 (high-NOx α-pinene photooxidation; ), absorption and scattering coefficients increase rapidly with formation of SOA, then decrease during irradiation as the SOA evaporates. shows the rather dramatic decrease in coating thicknesses by the end of the experiment. Note that after reaching the peak in coating thicknesses, b abs and ω0 decrease along the same trajectory as the coatings evaporate. The sharp decreases in b abs that deviate from this trajectory occur when dilution is initiated, because the decrease in total particle concentration has a larger influence on b abs in this experiment than the evaporation of coatings. Single-scatter albedo continues its decline along the same trajectory because ω0 is an intensive property whereas b abs is an extensive property.
In Experiment 7 (low-NOx α-pinene photooxidation; ), absorption and scattering coefficients increase steadily with the slowly forming SOA. During irradiation, there is a clear change in the rate of increase of these properties, coincident with a change in rate of growth of organic mass (). This change in growth is not seen in the mean coating thickness of 160–180 nm VED rBC cores (). In the absorption coefficient and absorption enhancement especially (), this change indicates that additional absorption enhancement has nearly stopped despite continued growth of organic mass and coating thicknesses. Previous studies have speculated that absorption can be no further enhanced after an extremely thick (>300 nm) coating is present on an absorbing core because the shell may actually shield the core from receiving photons (Bond et al. Citation2006; Knox et al. Citation2009; Cross et al. Citation2010; Lack and Cappa Citation2010). Because the coatings in Experiment 7 are still relatively thin as compared to those in Experiment 1 (), it is unlikely that further absorption enhancement is being thwarted by an exceptionally thick scattering shell in this experiment.
In all experiments presented, coatings on the rBC cores enhance the light absorption of these particles. Single-scatter albedo increased in all systems as the organic coating thicknesses on the fullerene soot grew. In the naphthalene system, there is clear wavelength dependence of the absorption enhancements (, middle), owing to the wavelength dependence of refractive index of naphthalene SOA. In the α-pinene systems, evaporation of the coatings leads to a decline of ω0 from its peak value, indicating that the changes in optical properties can be considered reversible as the coating material is removed from the rBC cores. The absorption enhancements reported here provide further evidence that the mixing state of rBC in the atmosphere is an important consideration for the radiative forcing by these particles.
3.3.2. Comparison of Measured and Modeled Absorption Enhancements
presents a comparison of a core-and-shell Mie model of absorption enhancement, calculated from SP2 measurements as detailed in Section 2.3, to measured absorption enhancement, calculated from PASS-3 measurements, for Experiments 1 (), 5 (), and 7 ().
FIG. 8 Comparison of Mie-modeled absorption enhancement to measured absorption enhancement. The measurements are enhancements of b abs at λ = 405 nm and λ = 781 nm measured by the PASS-3 relative to the values measured for the fullerene soot seed particles prior to irradiation. The Mie model enhancements are calculated by the increase in absorption cross section from uncoated rBC cores to rBC cores with the mean coating thickness measured by the SP2 (see text for details). Results for (a) Experiment 1, naphthalene photooxidation, (b) Experiment 5, high-NOx α-pinene photooxidation, and (c) Experiment 7, low-NOx α-pinene photooxidation are presented. Marker shading is a function of time after onset of irradiation, with later times indicated by darker colors. Data during chamber irradiation only are shown. The solid line is a 1-to-1 line. (Color figure available online.)
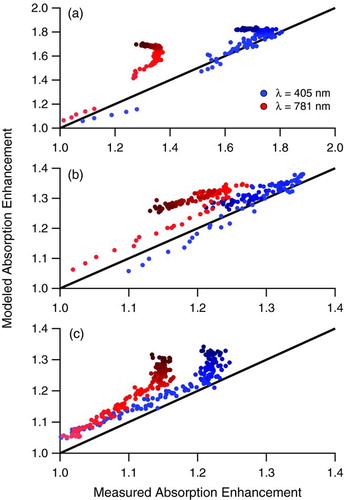
The rapid increase in absorption enhancement and large enhancement factor (∼1.8) at λ = 405 nm in Experiment 1 () are represented by the Mie model, despite the known limitation that the refractive index used in the Mie scattering model does not include an absorbing (imaginary) part. Modeled absorption enhancement at λ = 781 nm does not match the measured enhancement well. This discrepancy indicates a wavelength-dependence of the real part of the refractive index of the naphthalene SOA, which we have not captured with our assumed refractive index. If an absorbing refractive index is considered, then we would expect that the real part of refractive index would need to be smaller than 1.5 in order to keep good agreement at λ = 405 nm. A further reduction in the real refractive index at λ = 781 nm is also necessary to bring modeled and measured enhancement factors into better agreement. The strong wavelength-dependence of the optical properties of naphthalene SOA is supported by the large Åabs in . In addition, Lack and Cappa (Citation2010) found that coatings on rBC by mildly absorbing material reduces the absorption enhancement relative to rBC coated by non-absorbing material, which further explains why the measured absorption enhancements should be lower than modeled enhancements lacking an absorbing part of refractive index and suggests that any agreement between the model and measurements at λ = 405 nm is by coincidence.
In Experiment 5 (), the measured increase and decrease in absorption enhancement due to the increase and decrease of coating thickness during irradiation are captured by the model. We expect fairly good agreement using a coating refractive index of 1.5–0.0i based on a recent finding of no significant absorption for α-pinene SOA (Nakayama et al. Citation2010) and on recent measurements of α-pinene SOA refractive index in the range of 1.42–1.56 for λ = 450–700 nm (Barkey et al. Citation2007; Yu et al. Citation2008). The small wavelength-dependence of refractive index (increasing refractive index with decreasing wavelength) reported by Yu et al. (Citation2008) explains the small difference in the measured enhancement factors in this system.
In Experiment 7 (), there was a change in optical properties during the irradiation period ( and ). This change, in which the measured absorption enhancement ceases to increase, is not reflected by the Mie model because organic coatings are continuing to grow (). To reconcile the differences between the measurements and model, a change in refractive index of the coating material at the time of this deviation needs to be considered. It is possible that a change in the physical properties of the aerosol is occurring as well; however, it is expected that as coatings deposit, the rBC core will collapse so that the aerosol will become more like a core-shell morphology, which should bring the model and measurements into better agreement rather than worse agreement as is observed.
The results presented here, of a core-and-shell Mie scattering model of absorption enhancement during these single-hydrocarbon SOA systems, suggest that a careful treatment of SOA refractive index is needed to fully model aerosol optical properties. SOA from the photooxidation of naphthalene under dry, high-NOx conditions has a refractive index with a strong wavelength-dependence which, if not included in the model, will lead to large discrepancies between modeled and measured absorption enhancements. In the α-pinene system, for which measured refractive indices from previous studies exist, a change in optical properties during photooxidation causes discrepancies between the modeled and measured light absorption to arise during growth of coatings on rBC.
3.4. AMS Measurements
3.4.1. Naphthalene SOA
presents normalized (signal at each m/z is divided by the total organic signal) unit-mass resolution AMS organic mass spectra of SOA formed by the photooxidation of naphthalene in the presence of rBC seed particles (Experiment 1; ), of nucleated naphthalene SOA (Experiment 3; ), and the difference spectrum between the two (). The data are taken at the “peak growth” periods of each experiment, defined as the time after the parent hydrocarbon has either been consumed or has ceased to decrease (presumably due to OH being fully consumed) and when growth of suspended particle volume concentration has leveled off through reaching a balance with wall deposition. The number of oxidation lifetimes is defined as ki [OH]Δt, where ki is the second-order rate constant of species i reaction with OH, [OH] is the gas-phase concentration of OH, and Δt is the exposure time (Kroll et al. Citation2009). In , the data were taken at an oxidation lifetime of about 2.5 in both cases, and there was about 1.3 (7.8% of initial) and 2.1 ppb (9.6% of initial) naphthalene remaining in the chamber at peak growth for Experiments 1 and 3, respectively.
FIG. 9 Normalized unit-mass resolution AMS organic mass spectra at peak growth of (a) naphthalene SOA condensed on rBC seed (Experiment 1), (b) nucleated naphthalene SOA (Experiment 3), and (d) the difference spectrum, calculated relative to the mass spectrum from Experiment 1. On the difference spectrum, positive values denote m/z's enriched in the rBC-seeded experiment and negative values denote m/z's enriched in the nucleation experiment. (Color figure available online.)
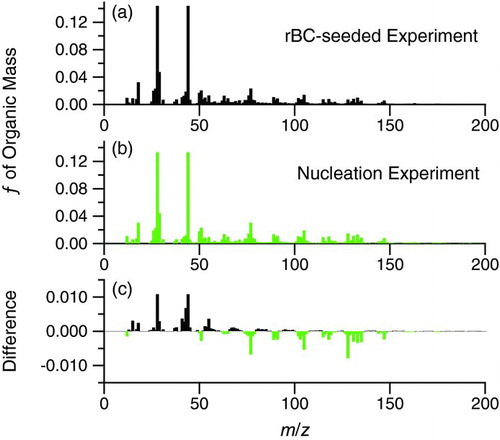
Masses larger than about m/z 275 from the nucleation experiment and masses larger than about m/z 200 from the fullerene soot-seeded experiment are generally at or near the detection limit of the AMS for those individual masses. The detection limits at each m/z are calculated as three times the standard deviation of the measured signal during sampling with a particle filter in front of the inlet before the start of the experiment. For Experiment 1, a background spectrum, defined as the average mass spectrum during the hour of chamber mixing prior to irradiation, is subtracted from the raw spectra during the rest of the experiment. Thus, the small signal resulting from the fullerene soot seed is removed from the spectrum in .
There is a small difference between the SOA composition formed by nucleation and condensation onto fullerene soot for this system. The largest change in mass fraction at any given m/z is about ±1% of total organic mass. This difference is most prominent at m/z 44, which is the mass with the largest fraction in the organic spectra (Figures and ). The discrepancies in the particular m/z's between the two experiments may arise owing to a different organic loading at the times of interest (which could force the chemistry through a different pathway); for Experiment 1, organic mass was 6.5 ± 0.08 μgm−3, while for Experiment 3, organic mass was 18.2 ± 0.22 μgm−3. Because the spectra are reported at the same oxidation lifetime, it is expected that these are reported at the most comparable conditions possible. Due to the uncertainty of AMS measurements, a change of ±1% should be viewed as small.
Although not shown in this work, similar AMS mass spectra comparisons were made at peak growth for the AS + rBC seeded experiment (Experiment 2 in ) compared to the two experiments presented above. The largest difference in the mass spectra arises from interferences from sulfate at m/z 48 and 64, which is remedied by properly adjusting the AMS fragmentation table. After adjustment, mass spectral differences are on the order of those shown in . These small differences in mass spectra may mean that the optical properties of the nucleated SOA reported in may differ from the condensed SOA onto rBC seed. However, because the mass spectral differences are small among all experiments compared, one concludes that the fullerene soot seed does not affect the composition of the condensed naphthalene SOA more so than condensation on the more conventional AS seed as compared to nucleated SOA.
3.4.2. High-NOx α-pinene SOA
During high-NOx α-pinene photooxidation (Experiment 5), the mean coating thickness initially increases rapidly, achieves a maximum, then decreases for the remainder of the irradiation period (). and present normalized AMS mass spectra at two times during irradiation in Experiment 5, at oxidation lifetimes of 9, near the end of the irradiation period, and 1, during the early rapid growth of SOA, respectively. presents the difference between these two mass spectra, relative to the earlier mass spectra, where positive values denote mass fragments enriched at the end of irradiation. Typically, the dominant mass fragments in AMS organic mass spectra of ambient aerosol are at m/z 44, which represents highly oxygenated organic species with low volatility, and at m/z 43, which represents less oxygenated semivolatile species (Ng et al. Citation2010). The mass fractions of these m/z, f44, and f43, are defined as the mass at m/z 44 and m/z 43, respectively, divided by the total organic mass, which is the sum of masses at all m/z in the AMS organic spectra. f43 is initially ∼15% of the total organic mass () and decreases to ∼13% () near the end of the irradiation period. Simultaneously, f44 increases from ∼8% () to ∼12% () of total organic mass during the irradiation period. These results indicate that the aerosol is transitioning from a semi-volatile to a lower volatility state, as is commonly observed during chemical aging of aerosol (Ng et al. Citation2010).
FIG. 10 Normalized unit-mass resolution AMS organic mass spectra from Experiment 5, high-NOx α-pinene photooxidation in the presence of fullerene soot, at (a) oxidation lifetime = 9 (after peak growth has been reached) and (b) oxidation lifetime = 1 (during rapid growth), (c) the difference spectrum, calculated relative to the earlier mass spectrum, and (d) comparison of AMS m/z 43 and 44 and ratio of m/z 43/44 with mean coating thickness measured by the SP2. On the difference spectrum, positive values denote m/z's enriched in the later condensed SOA and negative values denote m/z's enriched in the earliest condensed SOA. Note that dilution of the chamber began at an oxidation lifetime of approximately 9. (Color figure available online.)

From the time series traces () of AMS m/z 43 and 44 and mean coating thickness on rBC as measured by the SP2, AMS m/z 43 clearly traces the mean coating thickness (R 2 = 0.97), capturing the decrease in thickness with time quite well, deviating only after chamber dilution has begun. AMS m/z 44 lags behind m/z 43 in formation, and, therefore, does not trace coating thickness as well (R 2 = 0.89). Note that even though m/z 44 decreases during the experiment, f44 is continuously increasing, as stated above, meaning that the other mass fragments in the AMS mass spectra are decreasing more rapidly than m/z 44. This is shown in by the signals of m/z 43 and 44 approaching a similar value towards the end of the irradiation period. After the initial rapid growth, the m/z 43/44 ratio continuously decreases due to f44 continuously increasing throughout the experiment. While chemical aging in such a way that converts species yielding high f43 to higher f44 in the AMS may explain these trends, the combination of single-particle coating thickness measured by the SP2 and the bulk organic mass spectra measured by the AMS suggest that the more semivolatile species are actually evaporating from the aerosol. The SP2 unambiguously shows changes in single particles, whereas AMS measurements of small decreases in organic mass alone may have been attributed to other processes, such as chamber wall deposition.
3.4.3. Low-NOx α-pinene SOA
In the evolution of various measured parameters during the low-NOx α-pinene photooxidation (Experiment 7), mean coating thickness steadily increased as SOA was formed (). About halfway through the irradiation period, a decrease in the rate of change of the absorption and scattering coefficients occurred (), coincident with a decrease in the growth rate of total organic mass concentration measured by the AMS (). This change during irradiation occurred at an oxidation lifetime of ∼2 (∼4 h after the onset of irradiation).
Figures and present normalized AMS mass spectra at oxidation lifetimes of 3 and 1, respectively, on either side of the change in aerosol growth rate. presents the difference spectrum relative to the earlier spectrum and shows a decrease in f43. shows the evolution of various AMS mass fractions with oxidation lifetime in addition to the absorption and scattering coefficients at λ = 405 nm measured by the PASS-3. A shift in optical properties is evident at an oxidation lifetime of 2, while f43 and f44 continually change during the experiment and show no clear shift. The other mass fractions presented in also change continually throughout the experiment, although at different rates relative to each other. Some mass fractions, namely f1–50 and f50–100, change much more rapidly during the early part of irradiation and then begin to approach a relatively constant value after an oxidation lifetime of 2. Throughout the entire period displayed in , organic mass is growing and the raw m/z's are increasing; thus, the changes in mass fractions reflect the fact that different mass fragments are growing at different rates relative to each other, rather than by loss of certain fragments.
FIG. 11 Normalized unit-mass resolution AMS organic mass spectra from Experiment 7, low-NOx α-pinene photooxidation in the presence of fullerene soot, at (a) an oxidation lifetime = 3 (during the slower growth rate after the shift in optical properties) and (b) an oxidation lifetime = 1 (during the more rapid growth rate before the change in optical properties), (c) the difference spectrum, calculated relative to the earlier mass spectrum, and (d) comparison of f43, f44, f1–50 (scaled by 0.2), f50–100, and f100–150 (scaled by 5) from the AMS with the scattering and absorption coefficients at λ = 405 nm measured by the PASS-3. On the difference spectrum, positive values denote m/z's enriched in the later condensed SOA and negative values denote m/z's enriched in the earliest condensed SOA. (Color figure available online.)
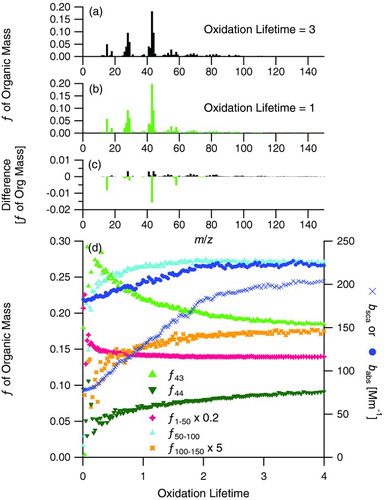
While m/z 43 and 44 are important individual mass fragments in the AMS mass spectra, they fail to capture the change in aerosol behavior that occurs at an oxidation lifetime of 2 in this system. Examining a wider range of mass fragments in the AMS mass spectra reveals that the aerosol composition is continually evolving during the irradiation period. This change in composition is likely accompanied by a change in refractive index, explaining the shift in optical properties despite steady growth of rBC coating thicknesses. This experiment demonstrates that measurement of aerosol optical properties can help guide the analysis of data from other instruments, namely the AMS. In the low-NOx α-pinene photooxidation system, the SOA optical properties change with time, and could be used as a model system to help understand the evolution of atmospheric SOA optical properties.
4. CONCLUSIONS
In this work, we demonstrate the utility of employing fullerene soot, a surrogate for refractory black carbon, as a seed aerosol in chamber studies of secondary organic aerosol formation, when done in conjunction with the single-particle soot photometer. Particle-by-particle measurement of the dynamics of the organic coating thickness on the rBC seed over the course of SOA formation allows evaluation of the rate of growth as a function of particle size. An experimental strategy is implemented in which a period of VOC oxidation and SOA growth is followed by one in which growth is quenched while the chamber undergoes dilution. The dilution phase is used as a means to assess SOA volatility by measuring the possible evaporation of coatings on the rBC seed. In the experiments presented here, a 3-λ photoacoustic soot spectrometer is used to measure the optical properties of the uncoated rBC seed, initially, and the coated rBC seed during the course of SOA formation. These measurements, coupled with the application of a core-and-shell Mie scattering model, allow one to infer the optical properties of the SOA. Application of a prototype single-particle angularly-resolved light scattering instrument confirms that the uncoated rBC particles are nonspherical. Important to understanding the effect rBC has on SOA formation is whether or not SOA condensed onto rBC seed is chemically and optically similar to nucleated SOA under dry conditions. High-resolution Aerodyne aerosol mass spectrometer measurements for the three systems considered here, naphthalene photooxidation and photooxidation of α-pinene under both high- and low-NOx conditions, confirm that the composition of SOA coating rBC seed particles differs from homogeneously nucleated SOA by no more than condensing SOA on the more conventional ammonium sulfate seed used in many chamber experiments, so that the use of rBC as a seed is not expected to alter the basic chemistry of SOA formation under dry conditions. Both SP2 and PASS-3 measurements reveal a change in the SOA coating and particle optical properties during SOA growth in the high-NOx α-pinene system, which is mirrored by a corresponding change in the AMS mass spectra. The combination of SP2 and AMS measurements in this system suggest that semivolatile species are evaporating from the aerosol during chemical aging. A change in optical properties during SOA growth in the low-NOx α-pinene system is mirrored by a change in organic growth rate and AMS mass spectra, but not in single-particle coating thicknesses. Exploration of a fundamental explanation of the chemistry leading to these changes lies beyond the scope of the present work. We have provided a framework by which future studies of SOA optical properties and single-particle growth dynamics may be explored in environmental chambers.
uast_a_750712_sm1246.zip
Download Zip (187.1 KB)Acknowledgments
This work was supported by the U.S. Department of Energy grant DE-SC0006626.
[Supplementary materials are available for this article. Go to the publisher's online edition of Aerosol Science and Technology to view the free supplementary files.]
Related Research Data
REFERENCES
- Abel , S. J. , Haywood , J. M. , Highwood , E. J. , Li , J. and Buseck , P. R. 2003 . Evolution of Biomass Burning Aerosol Properties from an Agricultural Fire in Southern Africa . Geophys. Res. Lett. , 30 ( 15 ) : 1783 doi: 10.1029/2003GL017342
- Andreae , M. O. and Gelencsér , A. 2006 . Black Carbon or Brown Carbon? The Nature of Light-Absorbing Carbonaceous Aerosols . Atmos. Chem. Phys. , 6 : 3131 – 3148 . doi: 10.5194/acp-6-3131-2006
- Bahreini , R. , Ervens , B. , Middlebrook , A. M. , Warneke , C. , de Gouw , J. A. , DeCarlo , P. F. , Jimenez , J. L. , Brock , C. A. , Neuman , J. A. , Ryerson , T. B. , Stark , H. , Atlas , E. , Brioude , J. , Fried , A. , Holloway , J. S. , Peischl , J. , Richter , D. , Walega , J. , Weibring , P. , Wollny , A. G. and Fehsenfeld , F. C. 2009 . Organic Aerosol Formation in Urban and Industrial Plumes Near Houston and Dallas, Texas . J. Geophys. Res. , 114 : D00F16 doi: 10.1029/2008JD011493
- Barkey , B. , Paulson , S. E. and Chung , A. 2007 . Genetic Algorithm Inversion of Dual Polarization Polar Nephelometer Data to Determine Aerosol Refractive Index . Aerosol Sci. Technol. , 41 ( 8 ) : 751 – 760 . doi: 10.1080/02786820701432640
- Baumgardner , D. , Kok , G. L. and Raga , G. B. 2004 . Warming of the Arctic Lower Stratosphere by Light Absorbing Particles . Geophys. Res. Lett. , 31 : L06117 doi: 10.1029/2003GL018883
- Baumgardner , D. , Popovicheva , O. , Allan , J. , Bernardoni , V. , Cao , J. , Cavalli , F. , Cozic , J. , Diapouli , E. , Eleftheriadis , K. , Genberg , P. J. , Gonzalez , C. , Gysel , M. , John , A. T. W. , Kirchstetter , T. A. , Kuhlbusch , J. , Laborde , M. , Lack , D. , Müller , T. , Niessner , R. , Petzold , A. , Piazzalunga , A. , Putaud , J. P. , Schwarz , J. , Sheridan , P. , Subramanian , R. , Swietlicki , E. , Valli , G. , Vecchi , R. and Viana , M. 2012 . Soot Reference Materials for Instrument Calibration and Intercomparisons: A Workshop Summary with Recommendations . Atmos. Meas. Tech. , 5 : 1869 – 1887 . doi: 10.5194/amt-5-1869-2012
- Bohren , C. F. and Huffman , D. R. 1998 . Absorption and Scattering of Light by Small Particles , New York : John Wiley & Sons, Inc. .
- Bond , T. C. and Bergstrom , R. W. 2006 . Light Absorption by Carbonaceous Particles: An Investigative Review . Aerosol Sci. Technol. , 40 ( 1 ) : 27 – 67 . doi: 10.1080/02786820500421521
- Bond , T. C. , Habib , G. and Bergstrom , R. W. 2006 . Limitations in the Enhancement of Visible Light Absorption Due to Mixing State . J. Geophys. Res. , 111 : D20211 doi: 10.1029/2006JD007315
- Bueno , P. A. , Havey , D. K. , Mulholland , G. W. , Hodges , J. T. , Gillis , K. A. , Dickerson , R. R. and Zachariah , M. R. 2011 . Photoacoustic Measurements of Amplification of the Absorption Cross Section for Coated Soot Aerosols . Aerosol Sci. Technol. , 45 ( 10 ) : 1217 – 1230 . doi: 10.1080/02786826.2011.587477
- Canagaratna , M. R. , Jayne , J. T. , Jimenez , J. L. , Allan , J. D. , Alfarra , M. R. , Zhang , Q. , Onasch , T. B. , Drewnick , F. , Coe , H. , Middlebrook , A. , Delia , A. , Williams , L. R. , Trimborn , A. M. , Northway , M. J. , DeCarlo , P. F. , Kolb , C. E. , Davidovits , P. and Worsnop , D. R. 2007 . Chemical and Microphysical Characterization of Ambient Aerosols with the Aerodyne Aerosol Mass Spectrometer . Mass Spectrom. Rev. , 26 ( 2 ) : 185 – 222 . doi: 10.1002/mas.20115
- Chan , A. W. H. , Kautzman , K. E. , Chhabra , P. S. , Surratt , J. D. , Chan , M. N. , Crounse , J. D. , Kürten , A. , Wennberg , P. O. , Flagan , R. C. and Seinfeld , J. H. 2009 . Secondary Organic Aerosol Formation from Photooxidation of Naphthalene and Alkylnaphthalenes: Implications for Oxidation of Intermediate Volatility Organic Compounds (IVOCs) . Atmos. Chem. Phys. , 9 : 3049 – 3060 . doi: 10.5194/acp-9-3049-2009
- Chan , A. W. H. , Chan , M. N. , Surratt , J. D. , Chhabra , P. S. , Loza , C. L. , Crounse , J. D. , Yee , L. D. , Flagan , R. C. , Wennberg , P. O. and Seinfeld , J. H. 2010a . Role of Aldehyde Chemistry and NOx Concentrations in Secondary Organic Aerosol Formation . Atmos. Chem. Phys. , 10 : 7169 – 7188 . doi: 10.5194/acp-10-7169-2010
- Chan , T. W. 2010b . Observations of OM/OC and Specific Attenuation Coefficients (SAC) in Ambient Fine PM at a Rural Site in Central Ontario, Canada . Atmos. Chem. Phys. , 10 : 2393 – 2411 . doi: 10.5194/acp-10-2393-2010
- Chirico , R. , DeCarlo , P. F. , Heringa , M. F. , Tritscher , T. , Richter , R. , Prévôt , A. S. H. , Dommen , J. , Weingartner , E. , Wehrle , G. , Gyse , M. , Laborde , M. and Baltensperger , U. 2010 . Impact of Aftertreatment Devices on Primary Emissions and Secondary Organic Aerosol Formation Potential from in-use Diesel Vehicles: Results from Smog Chamber Experiments . Atmos. Chem. Phys. , 10 ( 11 ) : 545 – 11 . 563 doi:10.5194/acp-10-11545-2010
- Chung , S. H. and Seinfeld , J. H. 2002 . Global Distribution and Climate Forcing of Carbonaceous Aerosols . J. Geophys. Res. , 107 ( D19 ) : 4407 doi: 10.1029/2001JD001397
- Cocker , D. R. , Flagan , R. C. and Seinfeld , J. H. 2001 . State-of-the-art Chamber Facility for Studying Atmospheric Aerosol Chemistry . Environ. Sci. Technol. , 35 ( 12 ) : 2594 – 2601 . doi: 10.1021/es0019169
- Crosso , E. S. , Onasch , T. B. , Ahern , A. , Wrobel , W. , Slowik , J. G. , Olfert , J. , Lack , D. A. , Massoli , P. , Cappaf , C. D. , Schwarz , J. P. , Spackman , J. R. , Fahey , D. W. , Sedlacek , A. , Trimborn , A. , Jayneb , J. T. , Freedman , A. , Williams , L. R. , Ng , N. L. , Mazzoleni , C. , Dubey , M. , Brem , B. , Koki , G. , Subramanian , R. , Freitag , S. , Clarke , A. , Thornhill , D. , Marrk , L. C. , Kolb , C. E. , Worsnop , D. R. and Davidovits , P. 2010 . Soot Particle Studies—Instrument Inter-Comparison—Project Overview . Aerosol Sci. Technol. , 44 ( 8 ) : 592 – 611 . doi:10.1080/02786826.2010.482113
- Crump , J. G. and Seinfeld , J. H. 1981 . Turbulent Deposition and Gravitational Sedimentation of an Aerosol in a Vessel of Arbitrary Shape . J. Aerosol Sci. , 12 ( 5 ) : 405 – 415 . doi: 10.1016/0021-8502(81)90036-7
- DeCarlo , P. F. , Slowik , J. G. , Worsnop , D. R. , Davidovits , P. and Jimenez , J. L. 2004 . Particle Morphology and Density Characterization by Combined Mobility and Aerodynamic Diameter Measurements. Part 1: Theory . Aerosol Sci. Technol. , 38 : 1185 – 1205 . doi: 10.1080/027868290903907
- DeCarlo , P. F. , Kimmel , J. R. , Trimborn , A. , Northway , M. J. , Jayne , J. T. , Aiken , A. C. , Gonin , M. , Fuhrer , K. , Horvath , T. , Docherty , K. S. , Worsnop , D. R. and Jimenez , J. L. 2006 . Field-Deployable, High-Resolution, Time-of-Flight Aerosol Mass Spectrometer . Anal. Chem. , 78 ( 24 ) : 8281 – 8289 . doi: 10.1021/ac061249n
- Dick , W. D. , McMurry , P. H. and Bottiger , J. R. 1994 . Size- and Composition-Dependent Response of the DAWN-A Multiangle Single-Particle Optical Detector . Aerosol Sci. Technol. , 20 ( 4 ) : 345 – 362 . doi: 10.1080/02786829408959690
- Dick , W. D. , Ziemann , P. J. , Huang , P.-F. and McMurry , P. H. 1998 . Optical Shape Fraction Measurements of Submicrometre Laboratory and Atmospheric Aerosols . Meas. Sci. Technol. , 9 ( 2 ) : 183 – 196 . doi: 10.1088/0957-0233/9/2/006
- Flowers , B. A. , Dubey , M. K. , Mazzoleni , C. , Stone , E. A. , Schauer , J. J. Kim , S.-W. 2010 . Optical-Chemical-Microphysical Relationships and Closure Studies for Mixed Carbonaceous Aerosols Observed at Jeju Island; 3-Laser Photoacoustic Spectrometer, Particle Sizing, and Filter Analysis . Atmos. Chem. Phys. , 10 ( 21 ) : 387 – 10 . 10 398, doi:10.5194/acp-10-10387-2010
- Fruin , S. A. , Winer , A. M. and Rodes , C. E. 2004 . Black Carbon Concentrations in California Vehicles and Estimation of in-vehicle Diesel Exhaust Particulate Matter Exposures . Atmos. Environ. , 38 ( 25 ) : 4123 – 4133 . doi: 10.1016/j.atmosenv.2004.04.026
- Fuller , K. A. , Malm , W. C. and Kreidenweis , S. M. 1999 . Effects of Mixing on Extinction by Carbonaceous Particles . J. Geophys. Res. , 104 ( D13 ) : 15 – 15 . 941–954 doi:10.1029/1998JD100069
- Gao , R. S. 2007 . A Novel Method for Estimating Light-Scattering Properties of Soot Aerosols Using a Modified Single-Particle Soot Photometer . Aerosol Sci. Technol. , 41 ( 2 ) : 125 – 135 . doi: 10.1080/0278682060111 8398
- Guenther , A. 1995 . A Global Model of Natural Volatile Organic Compound Emissions . J. Geophys. Res. , 100 ( D5 ) : 8873 – 8892 .
- Gyawali , M. , Arnott , W. , Lewis , K. and Moosmüller , H. 2009 . In Situ Aerosol Optics in Reno, NV, USA During and After the Summer 2008 California Wildfires and the Influence of Absorbing and Non-Absorbing Organic Coatings on Spectral Light Absorption . Atmos. Chem. Phys. , 9 : 8007 – 8015 . doi: 10.5194/acp-9-8007-2009
- Gysel , M. , Laborde , M. , Olfert , J. S. , Subramanian , R. and Gröhn , A. J. 2011 . Effective Density of Aquadag and Fullerene Soot Black Carbon Reference Materials Used for SP2 Calibration . Atmos. Meas. Tech. , 4 : 2851 – 2858 . doi: 10.5194/amt-4-2851-2011
- Hoffer , A. , Gelencsér , A. , Guyon , P. , Kiss , G. , Schmid , O. Frank , G. P. 2006 . Optical Properties of Humic-Like Substances (HULIS) in Biomass-Burning Aerosols . Atmos. Chem. Phys. , 6 : 3563 – 3570 . doi: 10.5194/acp-6-3563-2006
- Huffman , J. A. , Jayne , J. T. , Drewnick , F. , Aiken , A. C. , Onasch , T. Worsnop , D. R. 2005 . Design, Modeling, Optimization, and Experimental Tests of a Particle Beam Width Probe for the Aerodyne Aerosol Mass Spectrometer . Aerosol Sci. Technol. , 39 ( 12 ) : 1143 – 1163 . doi: 10.1080/02786820500423782
- Jacobson , M. Z. 2006 . Effects of Externally-Through-Internally-Mixed Soot Inclusions within Clouds and Precipitation on Global Climate . J. Phys. Chem. A , 110 ( 21 ) : 6860 – 6873 . doi: 10.1021/jp056391r
- Jayne , J. T. , Leard , D. C. , Zhang , X. , Davidovits , P. , Smith , K. A. Kolb , C. E. 2000 . Development of an Aerosol Mass Spectrometer for Size and Composition Analysis of Submicron Particles . Aerosol Sci. Technol. , 33 ( 1–2 ) : 49 – 70 . doi: 10.1080/027868200410840
- Johnson , K. S. , Zuberi , B. , Molina , L. T. , Molina , M. J. , Iedema , M. J. Cowin , J. P. 2005 . Processing of Soot in an Urban Environment: Case Study from the Mexico City Metropolitan Area . Atmos. Chem. Phys. , 5 : 3033 – 3043 . doi: 10.5194/acp-5-3033-2005
- Keywood , M. D. , Varutbangkul , V. , Bahreini , R. , Flagan , R. C. and Seinfeld , J. H. 2004 . Secondary Organic Aerosol Formation from the Ozonolysis of Cycloalkenes and Related Compounds . Environ. Sci. Technol. , 38 ( 15 ) : 4157 – 4164 . doi: 10.1021/es035363o
- Khalizov , A. F. , Xue , H. , Wang , L. , Zheng , J. and Zhang , R. 2009a . Enhanced Light Absorption and Scattering by Carbon Soot Aerosol Internally Mixed with Sulfuric Acid . J. Phys. Chem. A , 113 ( 6 ) : 1066 – 1074 . doi: 10.1021/jp807531n
- Khalizov , A. F. , Zhang , R. , Zhang , D. , Xue , H. , Pagels , J. and McMurry , P. H. 2009b . Formation of Highly Hygroscopic Soot Aerosols Upon Internal Mixing with Sulfuric Acid Vapor . J. Geophys. Res. , 114 : D05208 doi: 10.1029/2008JD010595
- Kirchner , U. , Vogt , R. , Natzeck , C. and Goschnick , J. 2003 . Single Particle MS, SNMS, SIMS, XPS, and FTIR Spectroscopic Analysis of Soot Particles During the AIDA Campaign . J. Aerosol Sci. , 34 ( 10 ) : 1323 – 1346 . doi: 10.1016/S0021-8502(03)00362-8
- Kirchstetter , T. W. , Novakov , T. and Hobbs , P. V. 2004 . Evidence that the Spectral Dependence of Light Absorption by Aerosols is Affected by Organic Carbon . J. Geophys. Res. , 109 : D21208 doi: 10.1029/2004JD00 4999
- Kleeman , M. J. , Schauer , J. J. and Cass , G. R. 2000 . Size and Composition Distribution of Fine Particulate Matter Emitted from Motor Vehicles . Environ. Sci. Technol. , 34 ( 7 ) : 1132 – 1142 . doi: 10.1021/es981276y
- Knox , A. , Evans , G. J. , Brook , J. R. , Yao , X. , Jeong , C.-H. Godri , K. J. 2009 . Mass Absorption Cross-Section of Ambient Black Carbon Aerosol in Relation to Chemical Age . Aerosol Sci. Technol. , 43 ( 6 ) : 522 – 532 . doi: 10.1080/02786820902777207
- Kroll , J. H. , Smith , J. D. , Che , D. L. , Kessler , S. H. , Worsnop , D. R. and Wilson , K. R. 2009 . Measurement of Fragmentation and Functionalization Pathways in the Heterogeneous Oxidation of Oxidized Organic Aerosol . Phys. Chem. Chem. Phys. , 11 ( 36 ) : 8005 – 8014 . doi: 10.1039/ b905289e
- Laborde , M. , Mertes , P. , Zieger , P. , Dommen , J. , Baltensperger , U. and Gysel , M. 2012 . Sensitivity of the Single Particle Soot Photometer to Different Black Carbon Types . Atmos. Meas. Tech. , 5 : 1031 – 1043 . doi: 10.5194/amt-5-1031-2012
- Lack , D. A. and Cappa , C. D. 2010 . Impact of Brown and Clear Carbon on Light Absorption Enhancement, Single Scatter Albedo and Absorption Wavelength Dependence of Black Carbon . Atmos. Chem. Phys. , 10 : 4207 – 4220 . doi: 10.5194/acp-10-4207-2010
- Leach , K. B. , Kamens , R. M. , Strommen , M. R. and Jang , M. 1999 . Partitioning of Semivolatile Organic Compounds in the Presence of a Secondary Organic Aerosol in a Controlled Atmosphere . J. Atmos. Chem. , 33 ( 3 ) : 241 – 264 . doi: 10.1023/A:1006108430033
- Lewis , K. , Arnott , W. P. , Moosmüller , H. and Wold , C. E. 2008 . Strong Spectral Variation of Biomass Smoke Light Absorption and Single Scattering Albedo Observed with a Novel Dual-Wavelength Photoacoustic Instrument . J. Geophys. Res. , 113 : D16203 doi: 10.1029/2007JD009699
- Loza , C. L. , Chhabra , P. S. , Yee , L. D. , Craven , J. S. , Flagan , R. C. and Seinfeld , J. H. 2012 . Chemical Aging of m-xylene Secondary Organic Aerosol: Laboratory Chamber Study . Atmos. Chem. Phys. , 12 : 151 – 167 . doi: 10.5194/acp-12-151-2012
- Malm , W. C. , Day , D. E. , Carrico , C. , Kreidenweis , S. M. , Collett , J. L. Jr. , McMeeking , G. , Lee , T. , Carrillo , J. and Schichtel , B. 2005a . Intercomparison and Closure Calculations Using Measurements of Aerosol Species and Optical Properties During the Yosemite Aerosol Characterization Study . J. Geophys. Res. , 110 : D14302 doi: 10.1029/2004JD005494
- Malm , W. C. , Day , D. E. , Kreidenweis , S. M. , Collett , J. L. Jr. , Carrico , C. , McMeeking , G. and Lee , T. 2005b . Hygroscopic Properties of an Organic-Laden Aerosol . Atmos. Environ. , 39 ( 27 ) : 4969 – 4982 . doi:10.1016/j.atmosenv.2005.05.014
- McMurry , P. H. and Rader , D. J. 1985 . Aerosol Wall Losses in Electrically Charged Chambers . Aerosol Sci. Technol. , 4 ( 3 ) : 249 – 268 . doi: 10.1080/02786828508959054
- Metcalf , A. R. , Craven , J. S. , Ensberg , J. J. , Brioude , J. , Angevine , W. , Sorooshian , A. , Duong , H. T. , Jonsson , H. H. , Flagan , R. C. and Seinfeld , J. H. 2012 . Black Carbon Aerosol over the Los Angeles Basin During CalNex . J. Geophys. Res. , 117 : D00V13 doi: 10.1029/2011JD017255
- Middlebrook , A. M. , Bahreini , R. , Jimenez , J. L. and Canagaratna , M. R. 2012 . Evaluation of Composition-Dependent Collection Efficiencies for the Aerodyne Aerosol Mass Spectrometer Using Field Data . Aerosol Sci. Technol. , 46 ( 3 ) : 258 – 271 . doi: 10.1080/02786826.2011.620041
- Mikhailov , E. F. , Vlasenko , S. S. , Podgorny , I. A. , Ramanathan , V. and Corrigan , C. E. 2006 . Optical Properties of Soot–Water Drop Agglomerates: An Experimental Study . J. Geophys. Res. , 111 : D07209 doi: 10.1029/2005JD006389
- Moffet , R. C. and Prather , K. A. 2009 . In-Situ Measurements of the Mixing State and Optical Properties of Soot with Implications for Radiative Forcing Estimates . Proc. Natl. Acad. Sci. USA , 106 ( 29 ) : 11872 – 11877 . doi: 10.1073/pnas.0900040106
- Moteki , N. and Kondo , Y. 2007 . Effects of Mixing State on Black Carbon Measurements by Laser-Induced Incandescence . Aerosol Sci. Technol. , 41 ( 4 ) : 398 – 417 . doi: 10.1080/02786820701199728
- Moteki , N. and Kondo , Y. 2010 . Dependence of Laser-Induced Incandescence on Physical Properties of Black Carbon Aerosols: Measurements and Theoretical Interpretation . Aerosol Sci. Technol. , 44 ( 8 ) : 663 – 675 . doi: 10.1080/02786826.2010.484450
- Moteki , N. 2007 . Evolution of Mixing State of Black Carbon Particles: Aircraft Measurements Over the Western Pacific in March 2004 . Geophys. Res. Lett. , 34 : L11803 doi: 10.1029/2006GL028943
- Moteki , N. , Kondo , Y. , Takegawa , N. and Nakamura , S. 2009 . Directional Dependence of Thermal Emission from Nonspherical Carbon Particles . J. Aerosol Sci. , 40 ( 9 ) : 790 – 801 . doi: 10.1016/j.jaerosci.2009.05. 003
- Nakayama , T. , Matsumi , Y. , Sato , K. , Imamura , T. , Yamazaki , A. and Uchiyama , A. 2010 . Laboratory Studies on Optical Properties of Secondary Organic Aerosols Generated During the Photooxidation of Toluene and the Ozonolysis of Alpha-Pinene . J. Geophys. Res. , 115 : D24203 doi: 10.1029/2010JD014387
- Ng , N. L. , Kroll , J. H. , Chan , A. W. H. , Chhabra , P. S. , Flagan , R. C. and Seinfeld , J. H. 2007 . Secondary Organic Aerosol Formation from m-xylene, Toluene, and Benzene . Atmos. Chem. Phys. , 7 : 3909 – 3922 . doi: 10.5194/acp-7-3909-2007
- Ng , N. L. 2010 . Organic Aerosol Components Observed in Northern Hemispheric Datasets from Aerosol Mass Spectrometry . Atmos. Chem. Phys. , 10 : 4625 – 4641 . doi: 10.5194/acp-10-4625-2010
- Park , S. H. , Kim , H. O. , Han , Y. T. , Kwon , S. B. and Lee , K. W. 2001 . Wall Loss Rate of Polydispersed Aerosols . Aerosol Sci. Technol. , 35 ( 3 ) : 710 – 717 . doi: 10.1080/02786820152546752
- Park , Y.-K. , Park , S. H. and Bae , G.-N. 2012 . Analytical Expression on Characteristic Time Scale of Black Carbon Aging Due to Condensation of Hygroscopic Species . Aerosol Sci. Technol. , 46 ( 6 ) : 601 – 609 . doi: 10.1080/02786826.2011.647119
- Pierce , J. R. , Engelhart , G. J. , Hildebrandt , L. , Weitkamp , E. A. , Pathak , R. K. Donahue , N. M. 2008 . Constraining Particle Evolution from Wall Losses, Coagulation, and Condensation-Evaporation in Smog-Chamber Experiments: Optimal Estimation Based on Size Distribution Measurements . Aerosol Sci. Technol. , 42 ( 12 ) : 1001 – 1015 . doi: 10.1080/02786820802389251
- Pósfai , M. , Simonics , R. , Li , J. , Hobbs , P. V. and Buseck , P. R. 2003 . Individual Aerosol Particles from Biomass Burning in Southern Africa: 1. Compositions and Size Distributions of Carbonaceous Particles . J. Geophys. Res. , 108 ( D13 ) : 8483 doi: 10.1029/2002JD002291
- Pye , H. O. T. , Chan , A. W. H. , Barkley , M. P. and Seinfeld , J. H. 2010 . Global Modeling of Organic Aerosol: The Importance of Reactive Nitrogen (NOx and NO3) . Atmos. Chem. Phys. , 10 ( 11 ) : 261 – 11 . 276 doi:10.5194/acp-10-11261-2010
- Ravindra , K. , Sokhi , R. and Van Grieken , R. 2008 . Atmospheric Polycyclic Aromatic Hydrocarbons: Source Attribution, Emission Factors and Regulation . Atmos. Environ. , 42 ( 13 ) : 2895 – 2921 . doi: 10.1016/j.atmosenv.2007.12.010
- Riemer , N. , Vogel , H. and Vogel , B. 2004 . Soot Aging Time Scales in Polluted Regions During Day and Night . Atmos. Chem. Phys. , 4 : 1885 – 1893 . doi: 10.5194/acp-4-1885-2004
- Robinson , A. L. , Donahue , N. M. , Shrivastava , M. K. , Weitkamp , E. A. , Sage , A. M. Grieshop , A. P. 2007 . Rethinking Organic Aerosols: Semivolatile Emissions and Photochemical Aging . Science , 315 ( 5816 ) : 1259 – 1262 . doi: 10.1126/science.1133061
- Saathoff , H. , Naumann , K.-H. , Schnaiter , M. , Schöck , W. , Möhler , O. Schurath , U. 2003 . Coating of Soot and (NH4)2SO4 Particles by Ozonolysis Products of α-pinene . J. Aerosol Sci. , 34 ( 10 ) : 1297 – 1321 . doi: 10.1016/S0021-8502(03)00364-1
- Sachweh , B. A. , Dick , W. D. and McMurry , P. H. 1995 . Distinguishing between Spherical and Nonspherical Particles by Measuring the Variability in Azimuthal Light Scattering . Aerosol Sci. Technol. , 23 ( 3 ) : 373 – 391 . doi: 10.1080/02786829508965321
- Schauer , J. J. , Kleeman , M. J. , Cass , G. R. and Simoneit , B. R. T. 1999 . Measurement of Emissions from Air Pollution Sources. 2. C1 Through C30 Organic Compounds from Medium Duty Diesel Trucks . Environ. Sci. Technol. , 33 ( 10 ) : 1578 – 1587 . doi: 10.1021/es980081n
- Schauer , J. J. , Kleeman , M. J. , Cass , G. R. and Simoneit , B. R. T. 2001 . Measurement of Emissions from Air Pollution Sources. 3. C1–C29 Organic Compounds from Fireplace Combustion of Wood . Environ. Sci. Technol. , 35 ( 9 ) : 1716 – 1728 . doi: 10.1021/es001331e
- Schauer , J. J. , Rogge , W. F. , Hildemann , L. M. , Mazurek , M. A. , Cass , G. R. and Simoneit , B. R.T. 1996 . Source Apportionment of Airborne Particulate Matter Using Organic Compounds as Tracers . Atmos. Environ. , 30 ( 22 ) : 3837 – 3855 . doi: 10.1016/1352-2310(96)00085-4
- Schnaiter , M. , Horvath , H. , Möhler , O. , Naumann , K.-H. , Saathoff , H. and Schöck , O. W. 2003 . UV-VIS-NIR Spectral Optical Properties of Soot and Soot-Containing Aerosols . J. Aerosol Sci. , 34 ( 10 ) : 1421 – 1444 . doi: 10.1016/S0021-8502(03)00361-6
- Schnaiter , M. , Linke , C. , Möhler , O. , Naumann , K.-H. , Saathoff , H. Wagner , R. 2005 . Absorption Amplification of Black Carbon Internally Mixed with Secondary Organic Aerosol . J. Geophys. Res. , 110 : D19204 doi: 10.1029/2005JD006046
- Schoemaecker Moreau , C. , Therssen , E. , Mercier , X. , Pauwels , J. F. and Desgroux , P. 2004 . Two-Color Laser-Induced Incandescence and Cavity Ring-Down Spectroscopy for Sensitive and Quantitative Imaging of Soot and PAHs in Flames . Appl. Phys. B: Lasers Opt. , 78 ( 3–4 ) : 485 – 492 . doi: 10.1007/s00340-003-1370-9
- Schwarz , J. P. , Gao , R. S. , Fahey , D. W. , Thomson , D. S. , Watts , L. A. , Wilson , J. C. , Reeves , J. M. , Darbeheshti , M. , Baumgardner , D. G. , Kok , G. L. , Chung , S. H. , Schulz , M. , Hendricks , J. , Lauer , A. , Kärcher , B. , Slowik , J. G. , Rosenlof , K. H. , Thompson , T. L. , Langford , A. O. , Loewenstein , M. and Aikin , K. C. 2006 . Single-Particle Measurements of Midlatitude Black Carbon and Light-Scattering Aerosols from the Boundary Layer to the Lower Stratosphere . J. Geophys. Res. , 111 : D16207 doi: 10.1029/2006JD007076
- Schwarz , J. P. , R. Gao , S. , Spackman , J. R. , Watts , L. A. , Thomson , D. S. , Fahey , D. W. , Ryerson , T. B. , Peischl , J. , Holloway , J. S. , Trainer , M. , Frost , G. J. , Baynard , T. , Lack , D. A. , de Gouw , J. A. , Warneke , C. and Del Negro , L. A. 2008a . Measurement of the Mixing State, Mass, and Optical Size of Individual Black Carbon Particles in Urban and Biomass Burning Emissions . Geophys. Res. Lett. , 35 : L13810 doi: 10.1029/2008GL033968
- Schwarz , J. P. , Spackman , J. R. , Fahey , D. W. , R. Gao , S. , Lohmann , U. , Stier , P. , Watts , L. A. , Thomson , D. S. , Lack , D. A. , Pfister , L. , Mahoney , M. J. , Baumgardner , D. , Wilson , J. C. and Reeves , J. M. 2008b . Coatings and Their Enhancement of Black Carbon Light Absorption in the Tropical Atmosphere . J. Geophys. Res. , 113 : D03203 doi:10.1029/2007JD009042
- Seinfeld , J. H. and Pandis , S. N. 2006 . Atmospheric Chemistry and Physics: From Air Pollution to Climate Change, , 2nd ed. , New York : John Wiley & Sons, Inc. .
- Shiraiwa , M. , Kondo , Y. , Iwamoto , T. and Kita , K. 2010 . Amplification of Light Absorption of Black Carbon by Organic Coating . Aerosol Sci. Technol. , 44 ( 1 ) : 46 – 54 . doi: 10.1080/02786820903357686
- Shiraiwa , M. , Kondo , Y. , Moteki , N. , Takegawa , N. , Miyazaki , Y. and Blake , D. R. 2007 . Evolution of Mixing State of Black Carbon in Polluted Air from Tokyo . Geophys. Res. Lett. , 34 : L16803 doi: 10.1029/2007GL0 29819
- Shiraiwa , M. , Kondo , Y. , Moteki , N. , Takegawa , N. , Sahu , L. K. Takami , A. 2008 . Radiative Impact of Mixing State of Black Carbon Aerosol in Asian Outflow . J. Geophys. Res. , 113 : D24210 doi: 10.1029/ 2008JD010546
- Slowik , J. G. , Cross , E. S. , Han , J.-H. , Davidovits , P. , Onasch , T. B. , Jayne , J. T. , Williams , L. R. , Canagaratna , M. R. , Worsnop , D. R. , Chakrabarty , R. K. , Moosmüller , H. , Arnott , W. P. , Schwarz , J. P. , Gao , R.-S. , Fahey , D. W. , Kok , G. L. and Petzold , A. 2007a . An Inter-Comparison of Instruments Measuring Black Carbon Content of Soot Particles . Aerosol Sci. Technol. , 41 ( 3 ) : 295 – 314 . doi: 10.1080/02786820701197078
- Slowik , J. G. , Cross , E. S. , Han , J.-H. , Kolucki , J. , Davidovits , P. , Williams , L. R. , Onasch , T. B. , Jayne , J. T. , Kolb , C. E. and Worsnop , D. R. 2007b . Measurements of Morphology Changes of Fractal Soot Particles Using Coating and Denuding Experiments: Implications for Optical Absorption and Atmospheric Lifetime . Aerosol Sci. Technol. , 41 ( 8 ) : 734 – 750 . doi: 10.1080/02786820701432632
- Stephens , M. , Turner , N. and Sandberg , J. 2003 . Particle Identification by Laser-Induced Incandescence in a Solid-State Laser Cavity . Appl. Opt. , 42 ( 19 ) : 3726 – 3736 . doi: 10.1364/AO.42.003726
- Stier , P. , Seinfeld , J. H. , Kinne , S. , Feichter , J. and Boucher , O. 2006 . Impact of Nonabsorbing Anthropogenic Aerosols on Clear-Sky Atmospheric Absorption . J. Geophys. Res. , 111 : D18201 doi: 10.1029/2006 JD007147
- Strommen , M. R. and Kamens , R. M. 1997 . Development and Application of a Dual-Impedance Radial Diffusion Model to Simulate the Partitioning of Semivolatile Organic Compounds in Combustion Aerosols . Environ. Sci. Technol. , 31 ( 10 ) : 2983 – 2990 . doi: 10.1021/es970079g
- Strommen , M. R. and Kamens , R. M. 1999 . Simulation of Semivolatile Organic Compound Microtransport at Different Time Scales in Airborne Diesel Soot Particles . Environ. Sci. Technol. , 33 ( 10 ) : 1738 – 1746 . doi: 10.1021/es981035q
- Subramanian , R. 2010 . Black Carbon over Mexico: The Effect of Atmospheric Transport on Mixing State, Mass Absorption Cross-Section, and BC/CO Ratios . Atmos. Chem. Phys. , 10 : 219 – 237 . doi: 10.5194/acp-10-219-2010
- Taylor , W. D. , Allston , T. D. , Moscato , M. J. , Fazekas , G. B. , Kozlowski , R. and Takacs , G. A. 1980 . Atmospheric Photodissociation Lifetimes for Nitromethane, Methyl Nitrite, and Methyl Nitrate . Int. J. Chem. Kinet. , 12 ( 4 ) : 231 – 240 . doi: 10.1002/kin.550120404
- Toon , O. B. and Ackerman , T. P. 1981 . Algorithms for the Calculation of Scattering by Stratified Spheres . Appl. Opt. , 20 ( 20 ) : 3657 – 3660 . doi: 10.1364/AO.20.003657
- Wehner , B. 2009 . Mixing state of Nonvolatile Aerosol Particle Fractions and Comparison with Light Absorption in the Polluted Beijing Region . J. Geophys. Res. , 114 : D00G17 doi: 10.1029/2008JD010923
- Weiner , A. M. and Harris , S. J. 1989 . Optical Detection of Large Soot Precursors . Combust. Flame , 77 ( 3–4 ) : 261 – 266 . doi: 10.1016/0010-2180(89)90133-8
- Weingartner , E. , Burtscher , H. and Baltensperger , U. 1997 . Hygroscopic Properties of Carbon and Diesel Soot Particles . Atmos. Environ. , 31 ( 15 ) : 2311 – 2327 . doi: 10.1016/S1352-2310(97)00023-X
- Weitkamp , E. A. , Sage , A. M. , Pierce , J. R. , Donahue , N. M. and Robinson , A. L. 2007 . Organic Aerosol Formation from Photochemical Oxidation of Diesel Exhaust in a Smog Chamber . Environ. Sci. Technol. , 41 ( 20 ) : 6969 – 6975 . doi: 10.1021/es070193r
- Wonaschütz , A. , Hitzenberger , R. , Bauer , H. , Pouresmaeil , P. , Klatzer , B. Caseiro , A. 2012 . Application of the Integrating Sphere Method to Separate the Contributions of Brown and Black Carbon in Atmospheric Aerosols . Environ. Sci. Technol. , 43 ( 4 ) : 1141 – 1146 . doi: doi: 10.1021/es8008503
- Yang , M. , Howell , S. G. , Zhuang , J. and Huebert , B. J. 2009 . Attribution of Aerosol Light Absorption to Black Carbon, Brown Carbon, and Dust in China–Interpretations of Atmospheric Measurements During EAST-AIRE . Atmos. Chem. Phys. , 9 : 2035 – 2050 . doi: 10.5194/acp-9-2035-2009
- Yu , Y. , Ezella , M. J. , Zelenyuk , A. , Imre , D. , Alexander , L. , Ortega , J. , D’Anna , B. , Harmon , C. W. , Johnson , S. N. and Finlayson-Pitts , B. J. 2008 . Photooxidation of α-pinene at High Relative Humidity in the Presence of Increasing Concentrations of NOx . Atmos. Environ. , 42 ( 20 ) : 5044 – 5060 . doi: 10.1016/j.atmosenv.2008.02.026
- Zhang , R. , Khalizov , A. F. , Pagels , J. , Zhang , D. , Xue , H. and McMurry , P. H. 2008 . Variability in Morphology, Hygroscopicity, and Optical Properties of Soot Aerosols During Atmospheric Processing . Proc. Natl. Acad. Sci. USA , 105 ( 30 ) : 10291 – 10296 . doi: 10.1073/pnas.0804860105
- Zuberi , B. , Johnson , K. S. , Aleks , G. K. , Molina , L. T. and Molina , M. J. 2005 . Hydrophilic Properties of Aged Soot . Geophys. Res. Lett. , 32 : L01807 doi: 10.1029/2004GL021496