Abstract
Atmospheric aerosols are one of the least understood components of the climate system and incur adverse health effects on susceptible populations. Organic aerosols can make up as much as 80% of atmospheric aerosols (Lim and Turpin Citation2002), and so its quantification and characterization plays an important role in reducing our uncertainty with regards to aerosol impacts on health and climate. As the number of organic molecules in the atmosphere are diverse in number (Hamilton et al. Citation2004), we advance a functional group representation of organic molecules as measured by Fourier transform infrared spectroscopy (FTIR) to characterize the chemical composition of particle samples. This study describes and evaluates the algorithm introduced by Russell et al. (Citation2009) for apportionment and quantification of oxygenated (carbonyl and hydroxyl) functional groups from infrared absorption spectra. Molar absorptivities for carbonyl and hydroxyl bonds in carboxylic groups are obtained for several dicarboxylic compounds, and applied to a multifunctional compound and mixture to demonstrate the applicability of this method for more complex samples. Furthermore, functional group abundances of two aldehydic compounds, 2-deoxy-d-ribose and glyceraldehyde, atomized from aqueous solution are in quantitative agreement with number of bonds predicted after transformation of these compounds into diols. The procedure for spectra interpretation and quantitative analysis is described through the context of an algorithm in which contributions of background and analyte absorption to the infrared spectrum are apportioned by the superposition of lineshapes constrained by laboratory measurements.
Copyright 2013 American Association for Aerosol Research
1. INTRODUCTION
Atmospheric aerosols contain some mixture of nitrate, sulfate, ammonium, crustal elements, sea salt, black carbon, and organic molecules (Seinfeld and Pandis Citation2006). The number of molecules comprising the organic aerosol fraction is numerous (Hamilton et al. Citation2004) and remains undercharacterized with respect to their quantity and potential impacts on health and climate (Kanakidou et al. Citation2005). Measurement of organic aerosol composition and abundance in the atmosphere provide a basis from which we can infer sources, predict potential impacts on health and climate, and provide constraints on representations for mathematical and computational modeling of the atmospheric system for simulating alternative scenarios relevant to adaptation or policy decision-making.
Given the dimensionality and domain size of organic aerosol characteristics (comprising size, shape, quantity, and composition), its representation must be constructed through the combination of analytical techniques that provide complementary information. Each method varies in the amount of organic content (mass concentration) it can quantify, and to what extent individual species can be resolved (chemical specificity). Composition is typically quantified in units of organic carbon (OC) through evolved gas analysis (EGA) (Subramanian et al. Citation2004), mass fragments through mass spectrometry (Schauer et al. Citation1999; Allan et al. Citation2003; Williams et al. Citation2006; Goldstein et al. Citation2008), atomic composition also through aerosol mass spectrometry (time-of-flight aerosol mass spectrometry [TOF-AMS]; Chhabra et al. Citation2010), or functional bonds through spectroscopy (Fourier transform infrared spectroscopy [FTIR], Maria et al. Citation2003; nuclear magnetic resonance [NMR], Decesari et al. Citation2007; near-edge X-ray absorption fine structure [NEXAFS], Russell Citation2003; Raman spectroscopy, Chan et al. Citation2006). Single-particle methods (aerosol time-of-flight mass spectrometry [ATOFMS], Noble and Prather Citation2000; scanning electron microscopy with energy dispersive X-ray [SEM-EDX], Laskin et al. Citation2006; transmission electron microscopy with electron energy-loss spectroscopy [TEM-EELS], Adachi and Buseck Citation2008; scanning transmission X-ray microscopy with NEXAFS [STXM-NEXAFS], Russell Citation2003) can provide metrics linked to number, mass composition, and morphology, but often not all together, and representativeness is dependent on sampling statistics. Some techniques target a particular size fraction (cluster chemical ionization mass spectrometry [cluster-CIMS], Zhao et al. Citation2010; thermal desorption chemical ionization mass spectrometry [TD-CIMS], Smith et al. Citation2004), or probe particular sections of individual particles (time-of-flight secondary ion mass spectrometry [TOF-SIMS], Tervahattu et al. Citation2002). Few methods measure organic aerosols online or in-situ (aerodyne aerosol mass spectrometer [AMS], Allan et al. Citation2003; aerosol chemical speciation monitor [ACSM], Ng et al. Citation2010; thermal desoprtion aerosol gas chromatography [TAG], Williams et al. Citation2006), while a large number of methods characterize particles offline. In the latter case, samples are collected on a substrate and subsequently analyzed by one or more methods. For these analytical techniques, some fraction of particle ensembles collected on a substrate through filtration or impaction is quantified with optional sample preparation a priori (e.g., extraction or derivitization). Each instrument serves to provide enlightenment on some aspect particle composition or morphology relevant for source apportionment or property prediction.
Infrared absorbance spectra of condensed-phase matter from FTIR provides a rich sequence of signals (Allen et al. Citation1994; Sax et al. Citation2005; Ofner et al. Citation2011) from which we can extract information regarding organic aerosol composition and mass. Each spectrum is interpreted as a combination of absorption lineshapes (characteristic absorption profiles) which can represent either molecular mixtures (Russell et al. Citation2009) or organic functional groups (Maria et al. Citation2003). Application of statistical learning methods which retain the full dimensionality of the measured signal has provided discrimination of constituent components or mixture classes (Takahama et al. Citation2011). Factor-analytic decomposition of ambient aerosol spectra have revealed component profiles which retain distinguishing spectral features that relate to original sources of organic aerosols (Russell et al. Citation2011). These feature vectors have also been used for unsupervised learning (cluster) analysis and regression analysis (in a chemical-balance-type approach) to group ambient aerosol spectra by source influence or similar mixture composition (Takahama et al. Citation2011) that agree with interpretations from the factor analysis methods.
A reduced representation of the FTIR spectrum in molar quantities of functional groups has been used to describe organic functional group abundance in atmospheric, indoor, and laboratory-generated organic aerosols (Allen et al. Citation1994; Russell Citation2003; Sax et al. Citation2005; Reff et al. Citation2007; Coury and Dillner Citation2008; Polidori et al. Citation2008). A functional group representation of the complex mixture of organic aerosols is physically meaningful to the extent that it has been linked to predictive models of molecular interactions in the condensed phase within an established thermodynamic framework (i.e., activity coefficients from group-contribution methods, Fredenslund et al. Citation1975), from which hygroscopic properties and volatilities can be estimated (Asher et al. Citation2002; Ming and Russell Citation2002; Topping et al. Citation2005; Chang and Pankow Citation2006; Erdakos et al. Citation2006; Pankow and Chang Citation2008; Quinn et al. Citation2006; Zuend et al. Citation2008, Citation2011). Relative functional group mass or molar compositions have also been linked with the identification of samples heavily influenced by marine, combustion, biogenic, or biomass burning sources (Liu et al. Citation2009; Hawkins and Russell Citation2010; Takahama et al. Citation2011).
Previous studies have detailed the quantification of CH groups from saturated, unsaturated, and ring structures (Maria et al. Citation2003; Gilardoni et al. Citation2007; Russell et al. Citation2009); amine CNH2 (Liu et al. Citation2009; Russell et al. Citation2009); alcohol and phenol COH (Bahadur et al. Citation2010 and Russell et al. Citation2010, respectively); organosulfate COSO3 by solvent-rinsing (Hawkins et al. Citation2010); and organonitrate CONO2 groups (Day et al. Citation2010). This work describes and evaluates the carboxylic COH, alcohol COH, and non-acid carbonyl C![]() O separation and quantification initially introduced by Russell et al. (Citation2009). As the the quantity and type of oxygenated functional groups is linked with atmospheric aging (Rudich et al. Citation2007; Jimenez et al. Citation2009), polarity and hygroscopicity (Pankow and Chang Citation2008; Jimenez et al. Citation2009; Pankow and Barsanti Citation2009; Zuend et al. Citation2010; Donahue et al. Citation2011), solution-phase miscibility (Song et al. Citation2012; Zuend and Seinfeld Citation2012), and modifications to vapor–pressures relative to unoxygenated compounds (Chattopadhyay and Ziemann Citation2005), reducing the uncertainty in this fraction provides a valuable contribution to organic aerosol analysis. This manuscript describes an algorithmic method of quantification in which commonly employed geometric curves—parameterized from laboratory and reference spectra—are superposed to reconstruct measured spectra. This approach for resolving the abundance of organic molecular bonds leads to a consistent interpretation of FTIR spectra across different users, and provides an explicit framework through which additional information can be introduced to reduce analytical uncertainty.
O separation and quantification initially introduced by Russell et al. (Citation2009). As the the quantity and type of oxygenated functional groups is linked with atmospheric aging (Rudich et al. Citation2007; Jimenez et al. Citation2009), polarity and hygroscopicity (Pankow and Chang Citation2008; Jimenez et al. Citation2009; Pankow and Barsanti Citation2009; Zuend et al. Citation2010; Donahue et al. Citation2011), solution-phase miscibility (Song et al. Citation2012; Zuend and Seinfeld Citation2012), and modifications to vapor–pressures relative to unoxygenated compounds (Chattopadhyay and Ziemann Citation2005), reducing the uncertainty in this fraction provides a valuable contribution to organic aerosol analysis. This manuscript describes an algorithmic method of quantification in which commonly employed geometric curves—parameterized from laboratory and reference spectra—are superposed to reconstruct measured spectra. This approach for resolving the abundance of organic molecular bonds leads to a consistent interpretation of FTIR spectra across different users, and provides an explicit framework through which additional information can be introduced to reduce analytical uncertainty.
2 METHODS
2.1 Algorithm Description
2.1.1 Background Correction
To quantify the amount of absorption due to analyte on our substrate, we first apply several background corrections. One correction is applied to remove the additional extinction contributed from scattering and absorption by the Teflon (PTFE) filter on which samples are collected and analyzed. We first subtract the spectrum obtained before ambient air sampling (presample) from that obtained after ambient air sampling (postsample). For this, we adopt a procedure described by Maria et al. (Citation2003), whereby we scale each presample spectrum to the postsample spectrum in the neighborhood of 1200 cm−1 prior to subtraction (Equation (EquationT1-1) in ), to account for the possible stretching of the Teflon due to the sampling procedure, which would (linearly) affect its optical thickness. The remaining variations which are not due to analyte absorption are accounted for with polynomial or linear baselines, depending on the region. The simple baselining methods used here are unable to account for the full curvature on the absorbance imposed by the substrate; presample spectrum subtraction is therefore applied. The choice of baselining the presample subtracted spectrum as opposed to taking the difference of baselined presample and postsample spectra follows from the reasoning that an error is introduced each time the baseline is approximated; we baseline once after presample spectrum subtraction to minimize the accumulation of this error. In practice, however, the order of operations does not affect the baselined spectra significantly (except in samples close to the limit of detection).
Table 1 Components of spectrum absorbance represented as scaled shapes, lines, and Gaussian peaks as a function of wavenumber 
For the region between 4000 and 2000 cm−1, we find the parameters for a polynomial (Equation (EquationT1-2)) for wavelengths, ![]() , regressed to a set of wavelengths in the background region,
, regressed to a set of wavelengths in the background region, ![]() .
. ![]() is parameterized by two baselining points (bl
, bu
) and region widths on either side of absorption region (Δ
l
, Δ
u
):
is parameterized by two baselining points (bl
, bu
) and region widths on either side of absorption region (Δ
l
, Δ
u
):
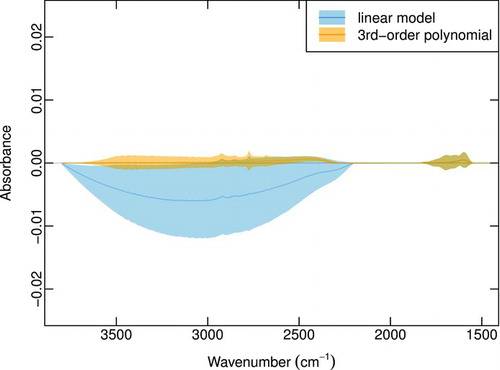
FIG.1 Comparison of linear and polynomial baselines estimated for blank sample spectra from the CalMex campaign (185 filters used for this analysis; Takahama et al. Citation2012). Lines indicate mean values for each wavenumber; shaded areas encompass ±1 standard deviation about the mean. (Color figure available online.)
For the region between 2000 and 1400 cm−1, we model the baseline with a line defined by endpoints corresponding to local minima around the absorbing regions (as commonly employed by spectroscopists). Let ![]() = detrended spectrum. We model the baseline as a line (Equation (EquationT1-2)) defined by two baselining points,
= detrended spectrum. We model the baseline as a line (Equation (EquationT1-2)) defined by two baselining points, ![]() and
and ![]() :
:
The default parameters for fitting in both regions are shown in . Particularly for the region between 4000 and 2000 cm−1, these values were chosen from observations of the detrended spectra () but can be modified according to requirements of individual samples (for instance, higher loadings may require applying the baseline over a wider region). Detrending by differencing is a method commonly used in time series analysis (Box et al. Citation2008) and spectroscopic analysis (Griffiths and Haseth Citation2007); a gradual variation is removed from sequential observations (over successive wavenumbers in this case). The positions of onset of perturbations in the signal due to analyte absorbance can then be located in the differenced spectrum. The background regions used for regression (Equation (EquationT1-1) are defined by either side of these wavenumbers ().
FIG.2 Example of detrended spectrum (Section 2.1.1. used to determine background regions (vertical lines and shaded rectangles); parameter names correspond to those used in Equation (1) and for the baseline regression model. (Color figure available online.)
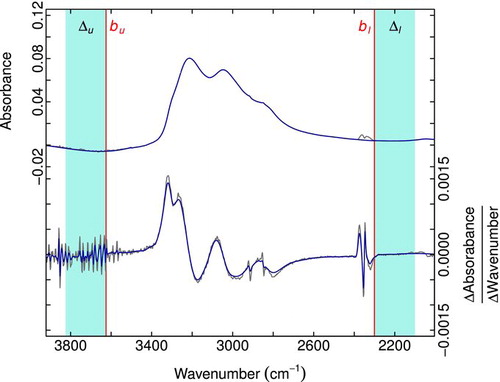
TABLE 2 Baselining parameters defined in Equations (EquationT1-1) and (EquationT1-2); examples of bx and Δ x for x={u, l} are illustrated in
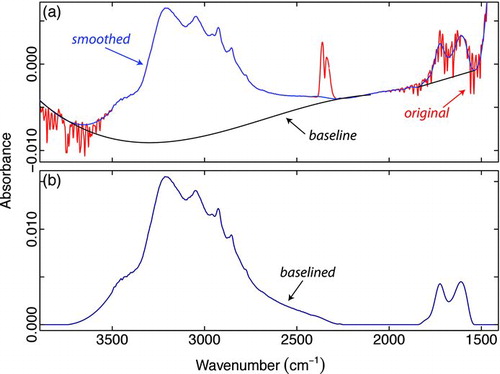
In a few cases, we apply a non-negativity constraint on the baseline fitting (Section S1). A few additional techniques are introduced to aid in the fitting or subsequent quantification, which includes the biased and wavelet smoothing over the region of water vapor interference above 3600 cm−1 and between 2000 and 1500 cm−1, respectively, and spline interpolation to remove the CO2 absorption at 2300 cm−1 (Section S1). An example of a modeled baseline and the baselined spectrum is shown in .
FIG.3 Example of original and smoothed spectra (a) and baselined spectra (b). Negative absorbance (a) can arise from variations in Teflon thicknesses before and after sampling, as deformations can occur through stretching and imprinting of sample grid located behind the filter. (Color figure available online.)
2.1.2 Band-Fitting
We apportion the absorption by scaling fixed absorption profiles to the spectrum, or fitting parameterized distributions (in this case, Gaussian) to particular regions of the spectrum. Performing a least-squares minimization for all fitting parameters (including scaling factors and peak amplitudes, locations, and widths) simultaneously poses a challenge as the dimensionality and search space becomes large. As some absorbance profiles can be fitted independently of another (as determined by fitting region, ) or scaled to uniquely absorbing regions, we instead segment the parameter space and apply a sequential fitting process. The order of fitting is chosen such that the components for which fitting parameters can be determined least ambiguously is selected first, or fitted together when this order is not resolvable (and the parameter space to be searched is manageable). Based on this heuristic, the order of fitting and subtraction chosen is as follows (the chosen representation of lineshape is given in parentheses): carboxylic COH (Equation (EquationT1-1)), ammonium NH (Equation (EquationT1-1)), alcohol COH (Equation (T1-3)), alkane CH (Equation (T1-3)), and carboxylic C![]() O (Equation (T1-3)) and amine CNH
2 (Equation (T1-3)) together (further details provided in Section S2). As the absorbance regions of the latter two are separate from the rest, they can be fitted independently of the other groups. While the presence of additional functional groups may affect the fitting of any single functional group (Section S5), the estimation errors of those fitted later in this sequence do not affect estimates of those fitted prior. After peaks for these groups are fitted, a series of additional peaks are fitted for quantifying the alkene and aromatic functional groups (Section S2). Absorbances by organonitrate CONO
2 and organosulfate COSO
3 used for quantification (at <1000 cm−1) are mutually exclusive to these regions, and are described by Day et al. (Citation2010) and Hawkins and Russell (Citation2010), respectively.
O (Equation (T1-3)) and amine CNH
2 (Equation (T1-3)) together (further details provided in Section S2). As the absorbance regions of the latter two are separate from the rest, they can be fitted independently of the other groups. While the presence of additional functional groups may affect the fitting of any single functional group (Section S5), the estimation errors of those fitted later in this sequence do not affect estimates of those fitted prior. After peaks for these groups are fitted, a series of additional peaks are fitted for quantifying the alkene and aromatic functional groups (Section S2). Absorbances by organonitrate CONO
2 and organosulfate COSO
3 used for quantification (at <1000 cm−1) are mutually exclusive to these regions, and are described by Day et al. (Citation2010) and Hawkins and Russell (Citation2010), respectively.
TABLE 3 Initial values and constraints used for Gaussian peak-fitting. The Gaussian form and parameters are from Equation (T1-3)
For carboxylic COH and ammonium NH stretching vibrations, we scale and subtract a fixed absorbance profile (Equation (EquationT1-1)). β
k
is defined as the scaling factor for component k. Let ![]() be either the spectrum/residual after baseline correction, detrending, and/or other fitting, and
be either the spectrum/residual after baseline correction, detrending, and/or other fitting, and ![]() the absorption profile for component k:
the absorption profile for component k:
After each of these fixed profiles are fitted, Gaussian peaks for alkane, alcohol COH, carbonyl, and amine are fitted to the residual remaining after subtraction. For this task, we search for the appropriate parameters, (β
k
, μ
k
, σ
k
) for a Gaussian function (gk
; Equation (T1-3)) and union of absorbing regions of each peak (![]() ), box constraints (Bk
), for set of peaks (
), box constraints (Bk
), for set of peaks (![]() ):
):
The initial values and constraints for Gaussian peaks are derived from analysis of laboratory standards, and manually fitted peaks of Gilardoni et al. (Citation2007) (). We use one of two convex, constrained minimization algorithms (nl2sol or L-BFGS-B implemented in the R statistical package; R Development Core Team Citation2012); a set of 35 initial values and constraints are used to seed the minimization, and the one with lowest deviance or residual is selected. In the case of the alkane CH group, we initially fit a single Gaussian peak and use its width to revise the fitting region for the four peaks.
2.1.3 Separation of Oxygenated Fraction
Carboxylic COH has a very broad absorption between the regions 3400 and 2400 cm−1, and overlaps with the absorption region for alkane CH. Therefore, it is difficult to independently parameterize its contribution to the absorption in this region. For this purpose we apply a statistical separation technique, whereby combined absorptions of CH and COH over a spectrum of compounds are decomposed into relative contributions from CH and COH components using the Positive Matrix Factorization (PMF) algorithm (Paatero and Tapper Citation1994). The solutions generated by PMF are further modified to impose additional constraints of smoothness and quantitive apportionment for our aerosol sample spectra.
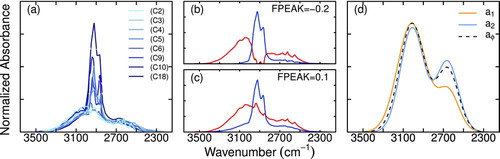
We selected a number of carboxylic acids with varying number contributions of carboxylic COOH and CH bonds, and obtained their spectra from the NIST Chemistry WebBook (http://webbook.nist.gov/chemistry/http://webbook.nist.gov/chemistry/) ( a). Using the WebBook archive permitted rapid consolidation of infrared spectra of compounds spanning a wide range of carboxylic COOH to alkane CH ratios; considerations for their variable preparation and data treatment are described in Section S3. We subject this set of spectra to a factor analytic decomposition (described further in Section S3), in which the set is represented by a linear combination of a smaller number of components. We specify a two-factor solution, as the variation among spectra is expected to arise from the variable contributions of alkane CH and carboxylic COH in the selected compounds. Among the factor analytic rotations (Paatero et al. Citation2002) explored, we find two reoccurring solutions which are shown in Figures b and c. One component is identified as the absorption arising from CH bonds from comparisons of reference standards of aliphatic compounds with strong absorbances appearing between 3000 and 2800 cm−1 (blue/dark grey profiles in Figures b and c). The other profile (red/light grey lines in Figures b and c) is attributed to the COH absorption (the broad range is consistent with the expected absorption band of carboxylic COH; Lambert et al. Citation1998), and the illustration reflects ways in which the COH absorption approximately varies with wavenumber in these two cases. Our goal is to further constrain this wavenumber-dependence in a way that it is in agreement with our method of alkane CH quantification, so we find a combination of the two profiles that satisfies this criteria. We introduce a degree of freedom in combining these solutions for the carboxylic COH component, represented as a fractional contribution (φ) of each profile to the final lineshape ![]() (Equation (EquationT3-3)). Carboxylic acid reference spectra
(Equation (EquationT3-3)). Carboxylic acid reference spectra ![]() consisting of only carboxylic COH and CH bonds are represented by a superposition of
consisting of only carboxylic COH and CH bonds are represented by a superposition of ![]() scaled by a factor β, and a sum of Gaussian peaks representing the absorbance due to CH bonds (Equation (EquationT3-4)):
scaled by a factor β, and a sum of Gaussian peaks representing the absorbance due to CH bonds (Equation (EquationT3-4)):
FIG.4 (a) Normalized spectra from NIST Chemistry WebBook, (b) and (c) possible CH (blue/dark grey) and COH (red/light grey) components from PMF analysis, and (d) derived lineshapes for carboxylic COH and final lineshape of carboxylic COH from calibration (Equation (EquationT3-3)). (Color figure available online.)
As implied in this successive fitting method, the two bonds comprising carboxylic COOH functional groups (hydroxyl COH and carbonyl C![]() O) are treated separately. The moles of carbonyl functional groups quantified by our Gaussian peakfitting is referred to as “total” carbonyl, and we apportion this quantity to carboxylic acid groups and nonacid, or “excess,” carbonyl (i.e., ketones and aldehydes), and in turn refine our estimate of the amount of carboxylic COOH functional groups in our sample. Let
O) are treated separately. The moles of carbonyl functional groups quantified by our Gaussian peakfitting is referred to as “total” carbonyl, and we apportion this quantity to carboxylic acid groups and nonacid, or “excess,” carbonyl (i.e., ketones and aldehydes), and in turn refine our estimate of the amount of carboxylic COOH functional groups in our sample. Let ![]() = moles of carboxylic COH and
= moles of carboxylic COH and ![]() = moles of total carbonyl. We map these quantities to carboxylic COOH and excess carbonyl C
= moles of total carbonyl. We map these quantities to carboxylic COOH and excess carbonyl C![]() O,
O, ![]() , using the following approach:
, using the following approach:
2.2 Experimental Method
Several organic compounds were selected for either calibration or evaluation of the algorithm described in Section 2.1. Compounds chosen for calibration are those for which band-fitting and quantification follows from the least amount of uncertainty (i.e., least amount of interference). Some of the chosen compounds have been reported to be present in the atmosphere (e.g., pinonic acid (Aiken et al. Citation2008); 2-deoxy-d-ribose and glyceraldehyde (Russell et al. Citation2010)). Others have been used in determining the shape of the carboxylic COH lineshape (as described in Section 2.1.3, but previously from the NIST Chemistry WebBook database; e.g., succinic and azelaic acids) or a previous measurement (adipic acid, by Gilardoni et al. Citation2007). Pinonic acid and a 50/50 molar % mixture of 2-deoxy-d-ribose and succinic acid were analyzed to evaluate the algorithm for characterization of multifunctional samples (with regards to co-occurrence of carboxylic and alcohol COH, especially). Collectively, these reference compounds delineate the axes of the composition domain defined by Russell et al. (Citation2011).
Solutions of 1 mM concentrations were prepared by dissolving or mixing selected compounds (azelic acid: Aldrich, 246379-25G, 98%, solid; succinic acid: Fluka, 14078, 99.5%, solid; 2-deoxy-d-ribose: Sigma, 31170-5G-F, 99%, solid; cis-pinonic acid: Aldrich, 110108-5G, 98%, solid) in distilled, deionized water (ACS ASTM Type I, Ricca chemical CAS: 7732-18-5), or ethanol (Sigma-Aldrich 200 proof HPLC/Spectrophotometric grade 459828) for one solution of 2-deoxy-d-ribose. Atomized aerosol samples were generated using a TSI Model 3076 Aerosol Generator using these solutions. Particles were dried online using a diffusion dryer filled with CaSO 4 and collected on 37 mm Teflon (PTFE) filters (Pall Corporation). The sample collection area is restricted to a circular area with a diameter of 10 mm in the center of the filter by Teflon masking elements placed above and below each filter. These masking elements are effectively thin Teflon washers with inner and outer diameters of 10 and 37 mm, respectively. Filters were allowed to equilibriate in <55% RH conditions for 24 h before analyzing with a microbalance (Sartorius) with 0.1 μg resolution for gravimetric analysis, and a Bruker Tensor 27 spectrometer with DTGS detector for measurement of infrared transmission using 2 cm−1 resolution. Consideration of aerosol water retention and effects on functional group quantification is provided in Section S4. A background spectrum was acquired for every five sample spectra, and each spectrum is the average of 128 scans. Filters were scanned with the spectrometer before and after sample collection, and the FTIR sample chamber was purged with pure nitrogen for three minutes prior to and during scanning for each filter.
Mass loadings on filters are determined through difference of presample and postsample weights of the substrate by gravimetric analysis (in the single-solute case, there is no assumption of dissolution estimates or solution concentrations required). The measured gravimetric mass is divided by the compound molecular weight and multiplied by functional group abundance on a per molecule basis to estimate the total moles of functional groups in each sample. The quantity referred to as “absorptivity” in this manuscript is adopted from previous use in analysis of organic functional group abundance in atmospheric aerosols (Maria et al. Citation2002, Citation2003), and is defined as the integrated absorbance (cm−1, as absorbance is unitless) per micromole of functional group; collectively expressed in units of cm−1 μmol−1. This absorptivity we report is the integrated molar absorption coefficient divided by the the sample collection area (a circle with a diameter of 10 mm for our configuration), and its derivation from the Beer–Lambert Law is shown in Section S4.
3 PARAMETER QUANTIFICATION AND EVALUATION
3.1 Absorptivities
Samples of reference standards are collected by the method described in Section 2.2. and the algorithmic decomposition described in Section 2.1 is applied to the infrared spectra of these samples. The integrated absorbance is obtained by integrating the lineshapes of apportioned components with respect to wavenumber (Section 2.1.2.
Values of integrated absorbances for each functional group are regressed against measured quantity of functional groups (expressed in moles) with a one-parameter linear model (containing a slope with no intercept, derived from Beer–Lambert Law as described in Section S4) for individual compounds (Figures a–c). The absorptivities calculated from regression slopes for each compound are shown in . The 10 saccharide compounds (from the work by Russell et al. Citation2010) are regressed as a single group for alcohol COH absorptivity, as absorbance at a single concentration was measured for each compound (Figures c and a). Carboxylic acid standard spectra exhibited a range of absorbance shapes, particularly in the region between 3400 and 2400 cm−1 (COH-stretching region). Therefore, the residual area after alkane CH lineshape subtraction, ![]() from Equation (EquationT3-4), is considered to be the best estimate of integrated absorbance for carboxylic COH as the compounds used for calibration contain no other functional group. The areas and absorpitivities calculated by this approach are shown in Figures a and c.
from Equation (EquationT3-4), is considered to be the best estimate of integrated absorbance for carboxylic COH as the compounds used for calibration contain no other functional group. The areas and absorpitivities calculated by this approach are shown in Figures a and c.
FIG.5 Molar absorptivity calibration for each functional group and subsequent evaluation by functional group (columnwise organization): integrated absorbance (top row), predicted number of functional group bonds (lower panel). (*) indicates dissolution of 2-deoxy-d-ribose in ethanol rather than water for atomization (Section 2.2. The diagonal lines spanning lower left to upper right corners of plot boxes in lower panels indicate the x=y relationship. Saccharide compounds measurements are reported by Russell et al. (Citation2010) (Table S2). (Color figure available online.)
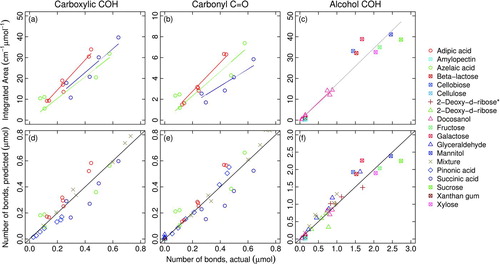
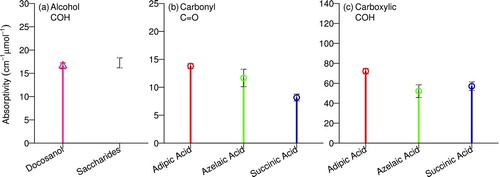
FIG.6 Molar absorptivities for each functional group estimated from . Black error bars represent ± standard error of regression slope, or propagated standard errors in case of aggregation of multiple regression slopes (Section 3.1. Saccharide compounds measurements are reported by Russell et al. (Citation2010) (Table S2). (Color figure available online.)
Absorptivities are generally consistent for each functional group (Maria et al. Citation2003; Gilardoni et al. Citation2007; Russell et al. Citation2009). However, small variations in the absorbance band and absorptivity occur for different conditions in which each chemical bond exists, and it is therefore reasonable to expect some variation in absorptivities for pure compound standards. When the absorptivities among compounds are not statistically significantly different, the points can be regressed together to get a single absorptivity value without any loss of information. For cases in which any of the regression slopes for each compound are significantly different, we can aggregate them according to our interpretation of mixture composition. This aggregation of varying absorptivities is expressed as a weighted sum. Let wi
= weights, α
i
= absorptivity, and ![]() = weighted absorptivity:
= weighted absorptivity:
Absorptivities for each functional group calculated by this method are shown in . All alcohol COH bond measurements for docosanol and saccharides in aqueous solution (measured and reported by Gilardoni et al. [2007] and Russell et al. [2010], respectively) are regressed together, as there is not a significant variation among these compounds. In this table, we report a carboxylic COH absorptivity slightly lower than that illustrated in Figures a and c, as we use a scaled area to represent an approximate carboxylic COH absorbance. This scaled area is calculated as the integral of ![]() from Equation (EquationT3-4), where
from Equation (EquationT3-4), where ![]() is the fixed carboxylic COH profile derived in Section 2.1.3. The reduced absorptivity is calculated in the same manner with the exception that the scaled area, rather than residual area, is used as the regressor. Using a fixed carboxylic COH profile paired with its corresponding absorptivity is more suitable for ambient sample spectra, as the residual area estimated by the subtraction method described above is likely to contain absorption due to other bonds present in atmospheric mixtures. The purpose of using the residual area in a is to illustrate the applicability of the Beer–Lambert Law for the unapproximated area (i.e., linearity with respect to molar abundance), but we are also able to reproduce the molar quantities of carboxylic COH present in our reference samples using the scaled area approach (as evaluated in d, and also in described below). The variability in carboxylic COH absorptivities among compounds are approximately similar regardless of which metric is used. Carboxyic COH and carbonyl C
is the fixed carboxylic COH profile derived in Section 2.1.3. The reduced absorptivity is calculated in the same manner with the exception that the scaled area, rather than residual area, is used as the regressor. Using a fixed carboxylic COH profile paired with its corresponding absorptivity is more suitable for ambient sample spectra, as the residual area estimated by the subtraction method described above is likely to contain absorption due to other bonds present in atmospheric mixtures. The purpose of using the residual area in a is to illustrate the applicability of the Beer–Lambert Law for the unapproximated area (i.e., linearity with respect to molar abundance), but we are also able to reproduce the molar quantities of carboxylic COH present in our reference samples using the scaled area approach (as evaluated in d, and also in described below). The variability in carboxylic COH absorptivities among compounds are approximately similar regardless of which metric is used. Carboxyic COH and carbonyl C![]() O absorptivities vary by 21% and 25%, respectively (as measured by relative standard deviation, or %RSD), among the dicarboxylic acids analyzed in this study. The prediction errors for bond abundance quantification (in n μmoles) are within 35% on average, and are also reported as molar values in . In this Table, mean bias and mean error between moles of predicted (
O absorptivities vary by 21% and 25%, respectively (as measured by relative standard deviation, or %RSD), among the dicarboxylic acids analyzed in this study. The prediction errors for bond abundance quantification (in n μmoles) are within 35% on average, and are also reported as molar values in . In this Table, mean bias and mean error between moles of predicted (![]() ) and actual (n) number of bonds for N measurements are defined as
) and actual (n) number of bonds for N measurements are defined as ![]() and
and ![]() , respectively, and their relative values are defined by normalizing by ni
prior to averaging.
, respectively, and their relative values are defined by normalizing by ni
prior to averaging.
TABLE 4 Absorptivities for oxygenated functional groups
TABLE 5 Errors in predicted molar quantities of functional groups, corresponding to . Mean bias and mean error are defined in Section 3.1.
Allen et al. (Citation1994) suggested that acid C![]() O has a stronger molar absorptivity than ketonic C
O has a stronger molar absorptivity than ketonic C![]() O by a factor of 2 or 3. According to this assertion, we should underpredict the quantity of carbonyl C
O by a factor of 2 or 3. According to this assertion, we should underpredict the quantity of carbonyl C![]() O for compounds containing ketonic C
O for compounds containing ketonic C![]() O if we apply the molar absorptivity for carbonyl C
O if we apply the molar absorptivity for carbonyl C![]() O derived from carboxylic acids. For instance, we should predict molar quantities 1.3 to 1.5 times higher for pinonic acid, which has a 1:1 molar ratio of ketonic to carboxylic C
O derived from carboxylic acids. For instance, we should predict molar quantities 1.3 to 1.5 times higher for pinonic acid, which has a 1:1 molar ratio of ketonic to carboxylic C![]() O. We find that this is not the case, as the aggregated absorptivity derived from adipic, azelaic, and succinic acids (which only contain carboxylic C
O. We find that this is not the case, as the aggregated absorptivity derived from adipic, azelaic, and succinic acids (which only contain carboxylic C![]() O) applied to pinonic acid (containing both carboxylic and ketonic C
O) applied to pinonic acid (containing both carboxylic and ketonic C![]() O) shows that the predicted moles of carbonyl C
O) shows that the predicted moles of carbonyl C![]() O is within 5% of the actual values ( e).
O is within 5% of the actual values ( e).
Mean absorptivities reported in are used in Section 3.2 for evaluation of the algorithm described previously (Section 2.1., as these uniformly-weighted absorptivities are representative of the subset of compounds analyzed for this study. The value to be used for ambient samples merits further consideration. Baselining parameters were slightly adjusted from the work of Russell et al. (Citation2009) to be more consistent across reference compounds; this adjustment results in absorptivities for adipic acid that are 8% lower for both carboxylic COH and carbonyl C![]() O bonds. This difference is within analytical uncertainty and can statistically and effectively be considered insignificant. While it remains that adipic acid—used previously for calibration by Gilardoni et al. (Citation2007) and Russell et al. (Citation2009)—has the highest absorptivity of the three dicarboxylic acids compounds analyzed here, the full range of possible absorptivities for monocarboxylic, alkanoic acids, and hydroxyacid among other plausible carboxylic group configurations remain uncharacterized. Therefore, we recommend the continued use of the values cited by Russell et al. (Citation2009) (effectively corresponding to a weight of α=1 for adipic acid and zero for all others; Equation (EquationT3-6)) in our studies for the merit of consistency and comparability, until further experiments determine a value representative for a larger class of organic acids.
O bonds. This difference is within analytical uncertainty and can statistically and effectively be considered insignificant. While it remains that adipic acid—used previously for calibration by Gilardoni et al. (Citation2007) and Russell et al. (Citation2009)—has the highest absorptivity of the three dicarboxylic acids compounds analyzed here, the full range of possible absorptivities for monocarboxylic, alkanoic acids, and hydroxyacid among other plausible carboxylic group configurations remain uncharacterized. Therefore, we recommend the continued use of the values cited by Russell et al. (Citation2009) (effectively corresponding to a weight of α=1 for adipic acid and zero for all others; Equation (EquationT3-6)) in our studies for the merit of consistency and comparability, until further experiments determine a value representative for a larger class of organic acids.
3.2 Evaluation: Laboratory-Generated Aerosols
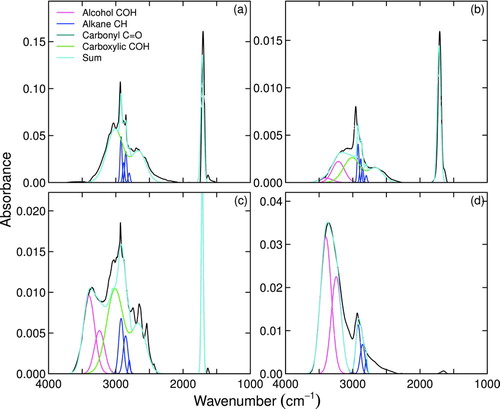
Examples of reference sample spectra apportioned by contributions from constituent functional groups as described in Section 2.1 are shown in . Compounds in neat preparation, especially small, highly-oxygenated compounds, are subject to accumulation of specific intermolecular forces—e.g., hydrogen bonding between protonated and deprotonated groups (Hay and Myneni Citation2007). Repeatable deviations from average or expected lineshapes (as expressed by aforementioned parameterizations) are therefore observed for a selected subset of samples. However, these deviations are expected to become less severe in mixtures (a relevant consideration for analysis of atmospheric samples), and is confirmed by reasonably accurate predictions for moles of carboxylic COH, alcohol COH, and carboxylic C![]() O (Figures d–f and ).
O (Figures d–f and ).
FIG.7 Example of apportioned lineshapes for selected laboratory standard spectra of aerosols generated from aqueous solutions of (a) azelaic acid, (b) pinonic acid, (c) equimolar mixture of succinic and 2-deoxy-d-ribose, and (d) 2-deoxy-d-ribose. Curves include measured spectrum and fitted lineshapes. (Color figure available online.)
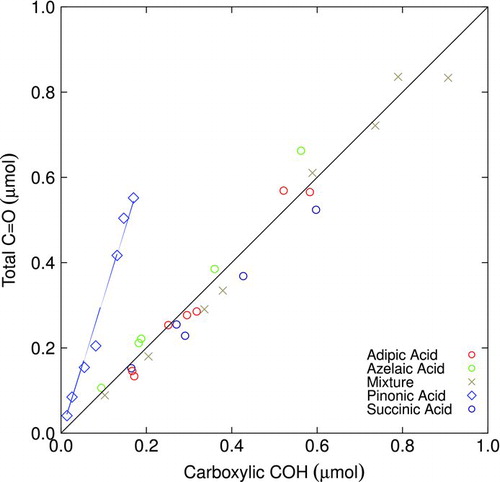
A comparison of quantified moles of total carbonyl C![]() O and carboxylic COH for reference samples are shown in . The calibrated absorptivities for carboxylic COH and carbonyl C
O and carboxylic COH for reference samples are shown in . The calibrated absorptivities for carboxylic COH and carbonyl C![]() O absorption yield approximately equivalent number of moles for each where expected (all carbonyl C
O absorption yield approximately equivalent number of moles for each where expected (all carbonyl C![]() O is associated with the carboxylic acid group), and departs from the
O is associated with the carboxylic acid group), and departs from the ![]() relationship when ketonic C
relationship when ketonic C![]() O is present. As seen in , the number of moles of carbonyl C
O is present. As seen in , the number of moles of carbonyl C![]() O in pinonic acid exceeds the equimolar relationship, which is the expected result and illustrates the way in which the measured carbonyl C
O in pinonic acid exceeds the equimolar relationship, which is the expected result and illustrates the way in which the measured carbonyl C![]() O can be apportioned between carboxylic acid and other carbonyl. The anticipated value of the slope is two, according to our understanding that pinonic acid contains one mole of ketonic C
O can be apportioned between carboxylic acid and other carbonyl. The anticipated value of the slope is two, according to our understanding that pinonic acid contains one mole of ketonic C![]() O for every mole of carboxylic group. The mole ratio of carbonyl C
O for every mole of carboxylic group. The mole ratio of carbonyl C![]() O to carboxylic COH as quantified by regression indicates that we overestimate the slope by 52% in this case. This discrepancy is attributed to the underprediction of quantified carboxylic COH ( d), possibly due to variations in molar absorptivity or departure of absorption lineshape from the profile used for our analysis. Applying our algorithm (Equation (EquationT3-5)), this leads to a 34% underprediction and 33% overprediction in the number of moles of carboxylic COH (and hence carboxylic COOH) and ketonic C
O to carboxylic COH as quantified by regression indicates that we overestimate the slope by 52% in this case. This discrepancy is attributed to the underprediction of quantified carboxylic COH ( d), possibly due to variations in molar absorptivity or departure of absorption lineshape from the profile used for our analysis. Applying our algorithm (Equation (EquationT3-5)), this leads to a 34% underprediction and 33% overprediction in the number of moles of carboxylic COH (and hence carboxylic COOH) and ketonic C![]() O, respectively.
O, respectively.
FIG.8 Comparison of quantified amount of total carbonyl C![]()
Aldehydic C![]() O has not been reported separately from ketonic C
O has not been reported separately from ketonic C![]() O in previous studies using this algorithm. The aldehyde C
O in previous studies using this algorithm. The aldehyde C![]() O absorption peak appears at approximately 1700 cm−1, depending on surrounding oxygenation or saturation, and is possibly separable from acidic or ketonic C
O absorption peak appears at approximately 1700 cm−1, depending on surrounding oxygenation or saturation, and is possibly separable from acidic or ketonic C![]() O when differences in peak location are detectable. For aldehyde-containing compounds analyzed in this study, no carbonyl C
O when differences in peak location are detectable. For aldehyde-containing compounds analyzed in this study, no carbonyl C![]() O peak was detected, and Fermi doublet peaks (from the CH stretching mode) expected between 2860 and 2710 cm−1 (Lambert et al. Citation1998) indicating the presence of aldehydic C
O peak was detected, and Fermi doublet peaks (from the CH stretching mode) expected between 2860 and 2710 cm−1 (Lambert et al. Citation1998) indicating the presence of aldehydic C![]() O groups were not observed in our absorbance spectra. Many aldehydic compounds are reactive and can hydrate to form diols containing alcohol COH groups in aqueous solution (Schwarzenbach et al. Citation2002). In agreement with our understanding that 2-deoxy-d-ribose in aqueous solvent is converted into a mixture of deoxyribopyranose (75%) and deoxyribofuranose (25%) which contain no carbonyl C
O groups were not observed in our absorbance spectra. Many aldehydic compounds are reactive and can hydrate to form diols containing alcohol COH groups in aqueous solution (Schwarzenbach et al. Citation2002). In agreement with our understanding that 2-deoxy-d-ribose in aqueous solvent is converted into a mixture of deoxyribopyranose (75%) and deoxyribofuranose (25%) which contain no carbonyl C![]() O bonds, we do not detect carbonyl C
O bonds, we do not detect carbonyl C![]() O (nor the aldehydic doublet) and observe the predicted amount of alcohol COH for 2-deoxy-d-ribose aerosols generated from aqueous solution. We make a similar observation for aerosols generated from an equimolar mixture of 2-deoxy-d-ribose and succinic acid in aqueous solvent (Figures f and c). 2-Deoxy-d-ribose in an ethanol solution undergoes a similar conversion; no aldehydic doublet or quantifiable carbonyl C
O (nor the aldehydic doublet) and observe the predicted amount of alcohol COH for 2-deoxy-d-ribose aerosols generated from aqueous solution. We make a similar observation for aerosols generated from an equimolar mixture of 2-deoxy-d-ribose and succinic acid in aqueous solvent (Figures f and c). 2-Deoxy-d-ribose in an ethanol solution undergoes a similar conversion; no aldehydic doublet or quantifiable carbonyl C![]() O is observed in these aerosol samples. Glyceraldehyde is predicted to form glyceraldehyde dimers in aqueous solution, which is also supported by our predictions of functional group abundance ( f).
O is observed in these aerosol samples. Glyceraldehyde is predicted to form glyceraldehyde dimers in aqueous solution, which is also supported by our predictions of functional group abundance ( f).
3.3 Evaluation: Ambient Samples
We apply the same algorithm described in Sections 2.1.2 and 2.1.3 to infrared spectra of ambient aerosols (). We find that the >90% of the integrated absorbance is accounted for when the total area is >50 cm−1 by the algorithm described above (). The range of fitted peak parameters are shown in . The amount of absorption by functional group and their absorptivities (Section 3.1 and Gilardoni et al. Citation2007) are used to estimate the OM mass concentrations for each sample using the algorithm described in Sections 4 and S6.
FIG.9 Examples of apportioned area for selected ambient sample spectra: from (a) Whistler Peak, 2009; (b) N. Atlantic Ocean, 2009 (ICEALOT); (c) Mexico City, 2006 (MILAGRO); and (d) Tijuana, 2010 (CalMex). Curves are colored as in , with the addition of ammonium NH, alkene CH, aromatic CH, and unidentified (Section S6) groups. (Color figure available online.)
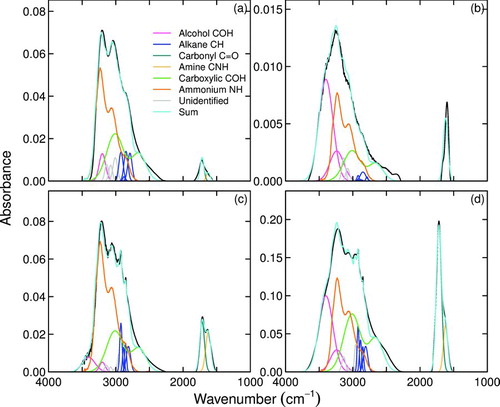
FIG.10 Summary of spectra area of ambient aerosols apportioned according to the lineshape fitting described in Section 2.1.2. Field campaigns since 2006 are included: 2006 GoMACCS (Russell et al. Citation2009); 2006 MILAGRO (Gilardoni et al. Citation2009; Liu et al. Citation2009); 2008 Whistler mid-valley (Schwartz et al. Citation2010); 2008 ICEALOT (Frossard et al. Citation2011); 2008 Scripps Pier (Hawkins and Russell Citation2010); 2009 Barrow, AL (Shaw et al. Citation2010); 2009 Scripps Pier Summer (Day et al. Citation2010) and Spring (Liu et al. Citation2011); 2009 VOCALS-REx (Hawkins et al. Citation2010); 2009 Whistler Peak (Takahama et al. Citation2011); 2010 CalNex Bakersfield (Alhm2012); 2010 CalMex (Takahama et al. Citation2012). (Color figure available online.)
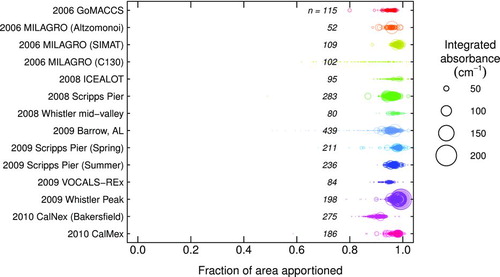
TABLE 6 Range (5–95th percentiles) of Gaussian peak-fitting parameter values for field campaigns since 2006 (residuals displayed in ). The Gaussian form and parameters are from Equation (T1-3)
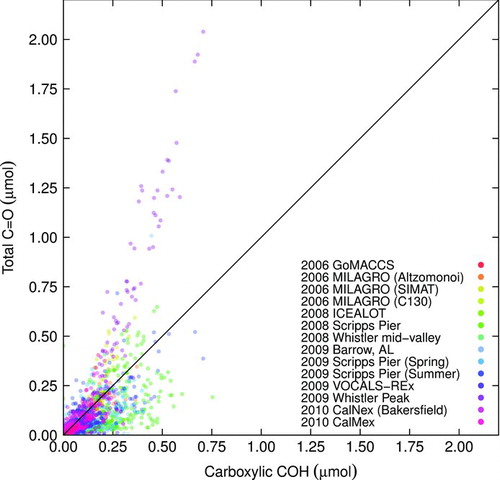
A comparison of quantified total C![]() O and carboxylic COH for ambient samples shows a wider deviation from equimolar quantities at lower concentrations than observed for laboratory standards. In addition, there are several campaigns for which the quantified moles of carboxylic COH exceeds total carbonyl C
O and carboxylic COH for ambient samples shows a wider deviation from equimolar quantities at lower concentrations than observed for laboratory standards. In addition, there are several campaigns for which the quantified moles of carboxylic COH exceeds total carbonyl C![]() O (
O (![]() ; Equation (EquationT3-5)) beyond normal variations about the
; Equation (EquationT3-5)) beyond normal variations about the ![]() line (). These fall into the “otherwise” case (Equation (EquationT3-5)) discussed in Section 2.1.3. and we rely on carboxylic COH to determine the amount of carboxylic COOH in these cases. Other explanations consistent with observation may be the overestimation of carboxylic COH area, underestimation of the true carboxylic COH absorptivity, or overestimation of carboxylic C
line (). These fall into the “otherwise” case (Equation (EquationT3-5)) discussed in Section 2.1.3. and we rely on carboxylic COH to determine the amount of carboxylic COOH in these cases. Other explanations consistent with observation may be the overestimation of carboxylic COH area, underestimation of the true carboxylic COH absorptivity, or overestimation of carboxylic C![]() O absorptivity for the given samples, but are considered less likely given the potential range of biases characterized in Section 3.2. However, further studies are necessary to strengthen this argument.
O absorptivity for the given samples, but are considered less likely given the potential range of biases characterized in Section 3.2. However, further studies are necessary to strengthen this argument.
FIG.11 Comparison of quantified amount of total carbonyl C![]()
In , the presence of nonacid C![]() O is apparent in several campaigns (from the observation that
O is apparent in several campaigns (from the observation that ![]() ; Equation (EquationT3-5)), and it is desirable to know whether this is due to contributions from aldehydic or ketonic C
; Equation (EquationT3-5)), and it is desirable to know whether this is due to contributions from aldehydic or ketonic C![]() O. Given the ubiquity of aerosol-water interactions in the atmosphere (Rood et al. Citation1989; Martin Citation2000), we expect that a subset of aldhehydes ambient aerosol samples will be hydrated and carbonyl C
O. Given the ubiquity of aerosol-water interactions in the atmosphere (Rood et al. Citation1989; Martin Citation2000), we expect that a subset of aldhehydes ambient aerosol samples will be hydrated and carbonyl C![]() O will be undetected by FTIR analysis (as reported in Section 3.2. In the broader scope of chemical constituents present in the atmospheric particles, however, hydration is not expected for all aldehydic compounds. Compounds such as glyceraldehyde (included in this study) have strongly electron withdrawing substituents with low steric hindrance, leading to high equilibrium constants for hydration (KHydr
≫1; Wasa and Musha Citation1970; Lewis and Wolfenden Citation1973; Creighton et al. Citation1988). Propionaldehyde, acetaldehyde, and possibly other aldehydic compounds expected to be present in atmospheric particles (De Andrade et al. Citation1993; Yu et al. Citation1999) have lower hydration equilibrium constants (
O will be undetected by FTIR analysis (as reported in Section 3.2. In the broader scope of chemical constituents present in the atmospheric particles, however, hydration is not expected for all aldehydic compounds. Compounds such as glyceraldehyde (included in this study) have strongly electron withdrawing substituents with low steric hindrance, leading to high equilibrium constants for hydration (KHydr
≫1; Wasa and Musha Citation1970; Lewis and Wolfenden Citation1973; Creighton et al. Citation1988). Propionaldehyde, acetaldehyde, and possibly other aldehydic compounds expected to be present in atmospheric particles (De Andrade et al. Citation1993; Yu et al. Citation1999) have lower hydration equilibrium constants (![]() ; Lewis and Wolfenden Citation1973; Guthrie Citation1975), which can be due to stabilizing electronic, symmetry, or steric effects of the unhydrated molecule (Guthrie Citation1975; Buschmann et al. Citation1980; Wiberg et al. Citation1994). Therefore, caution is warranted when interpreting spectra from ambient aerosol (and also smog chamber) samples. However, in the sample spectra associated with excess carbonyl C
; Lewis and Wolfenden Citation1973; Guthrie Citation1975), which can be due to stabilizing electronic, symmetry, or steric effects of the unhydrated molecule (Guthrie Citation1975; Buschmann et al. Citation1980; Wiberg et al. Citation1994). Therefore, caution is warranted when interpreting spectra from ambient aerosol (and also smog chamber) samples. However, in the sample spectra associated with excess carbonyl C![]() O (), the characteristic aldehydic doublet (described in Section 3.2. was not detected in these ambient sample spectra. Thus, the excess carbonyl C
O (), the characteristic aldehydic doublet (described in Section 3.2. was not detected in these ambient sample spectra. Thus, the excess carbonyl C![]() O was attributed to ketonic C
O was attributed to ketonic C![]() O. The presence and quantity of ketonic C
O. The presence and quantity of ketonic C![]() O has been correlated with biogenic SOA and biomass burning aerosol in various campaigns (Liu et al. Citation2009; Hawkins and Russell Citation2010; Schwartz et al. Citation2010; Liu et al. Citation2011; Takahama et al. Citation2011). A higher OM fraction of carboxylic COOH, on the other hand, has been associated with anthropogenic combustion (Liu et al. Citation2009; Russell et al. Citation2009); Hawkins and Russell 2010; (Schwartz et al. Citation2010; Liu et al. Citation2011; Takahama et al. Citation2011, Citation2012), and alcohol COH with marine aerosol (Hawkins and Russell Citation2010; Hawkins et al. Citation2010; Russell et al. Citation2010; Takahama et al. Citation2012), highlighting the relevance of functional group characterization in source identification and apportionment (Russell et al. Citation2011).
O has been correlated with biogenic SOA and biomass burning aerosol in various campaigns (Liu et al. Citation2009; Hawkins and Russell Citation2010; Schwartz et al. Citation2010; Liu et al. Citation2011; Takahama et al. Citation2011). A higher OM fraction of carboxylic COOH, on the other hand, has been associated with anthropogenic combustion (Liu et al. Citation2009; Russell et al. Citation2009); Hawkins and Russell 2010; (Schwartz et al. Citation2010; Liu et al. Citation2011; Takahama et al. Citation2011, Citation2012), and alcohol COH with marine aerosol (Hawkins and Russell Citation2010; Hawkins et al. Citation2010; Russell et al. Citation2010; Takahama et al. Citation2012), highlighting the relevance of functional group characterization in source identification and apportionment (Russell et al. Citation2011).
4 MOLECULAR BONDS TO ATOMIC COMPOSITION AND MASS CONCENTRATIONS
Having a set of measurements which provides the total number of moles of functional group j, we can estimate the associated mass and other chemical metrics from inferred atomic composition. We relate the total number of moles of functional group j, nj , to the number of moles of atom type i, ni , from the following equation:
Various field studies indicate that the OM reported by this method is generally within ±30% of other independent estimates (AMS: Gilardoni et al. Citation2009; Russell et al. Citation2009; Frossard et al. Citation2011; Liu et al. Citation2011). Estimated O/C atomic ratios reported by the algorithm are generally lower and exhibit a smaller dynamic range than O/C values measured by AMS and ACSM in the field (even after time-averaging of AMS and ACSM measurements to the time resolution of FTIR filter samples) (Russell et al. Citation2009; Takahama et al. Citation2012). For secondary organic aerosol (SOA) produced in an environmental chamber, O/C and H/C ratios estimated with canonical and adjusted ![]() s (Section S6) are bounded by AMS values reported at higher time resolution (Chhabra et al. Citation2011).
s (Section S6) are bounded by AMS values reported at higher time resolution (Chhabra et al. Citation2011).
5 CONCLUSIONS
This work describes the algorithm and parameters by which infrared absorption regions relevant for quantification of carboxylic COOH and carbonyl C![]() O are apportioned into their constituent components using simple lineshapes and a sequential fitting process. Using a statistical decomposition method, we extract an average lineshape for carboxylic COH from profiles of a fatty acid series and assign an absorptivity from a laboratory calibration from carboxylic acid compounds and mixtures. In addition to adipic acid which was used previously (Gilardoni et al. Citation2007), we use azelaic and succinic acids to obtain molar absorptivities for carboxylic C
O are apportioned into their constituent components using simple lineshapes and a sequential fitting process. Using a statistical decomposition method, we extract an average lineshape for carboxylic COH from profiles of a fatty acid series and assign an absorptivity from a laboratory calibration from carboxylic acid compounds and mixtures. In addition to adipic acid which was used previously (Gilardoni et al. Citation2007), we use azelaic and succinic acids to obtain molar absorptivities for carboxylic C![]() O and COH bonds. Our algorithm for quantifying carboxylic COOH is applied to a multifunctional compound (pinonic acid), and to a multifunctional mixture consisting of succinic acid and 2-deoxy-d-ribose (50/50 molar %) with 21% average prediction accuracy. The ketonic C
O and COH bonds. Our algorithm for quantifying carboxylic COOH is applied to a multifunctional compound (pinonic acid), and to a multifunctional mixture consisting of succinic acid and 2-deoxy-d-ribose (50/50 molar %) with 21% average prediction accuracy. The ketonic C![]() O in pinonic acid is detected by our method by the amount of carbonyl in molar excess of carboxylic COH, though overestimated by 33% due to a bias in calibration. Functional group abundances of aldehydic compounds (glyceraldehyde and 2-deoxy-d-ribose) were in quantitative agreement (within 30%) with the presence of diols formed from hydration reactions in aqueous solution. Given the prevalence of metastable states of aerosols in the atmosphere (Rood et al. Citation1989), many such aldehydic compounds can be hydrated in aqueous particles. In ambient sample spectra from field campaigns to date, doublet peak absorption characteristic of aldehydic compounds have not been observed, leading to attribution of excess carbonyl C
O in pinonic acid is detected by our method by the amount of carbonyl in molar excess of carboxylic COH, though overestimated by 33% due to a bias in calibration. Functional group abundances of aldehydic compounds (glyceraldehyde and 2-deoxy-d-ribose) were in quantitative agreement (within 30%) with the presence of diols formed from hydration reactions in aqueous solution. Given the prevalence of metastable states of aerosols in the atmosphere (Rood et al. Citation1989), many such aldehydic compounds can be hydrated in aqueous particles. In ambient sample spectra from field campaigns to date, doublet peak absorption characteristic of aldehydic compounds have not been observed, leading to attribution of excess carbonyl C![]() O to ketonic rather than aldehydic C
O to ketonic rather than aldehydic C![]() O. However, as there are aldehydic compounds expected in aqueous particles which are not expected to hydrate completely (e.g., acetaldehyde, pinonaldehyde), caution is still warranted when interpreting ambient and smog chamber aerosol spectra. The software programmed from this algorithm has been applied to the analysis of particles collected on Teflon substrates during various campaigns (Gilardoni et al. Citation2009; Liu et al. Citation2009; Russell et al. Citation2009; Bahadur et al. Citation2010; Hawkins and Russell Citation2010; Hawkins et al. Citation2010; Shaw et al. Citation2010; Day et al. Citation2010; Schwartz et al. Citation2010; Chhabra et al. Citation2011; Frossard et al. Citation2011; Liu et al. Citation2011; Takahama et al. Citation2011, Citation2012). The articulation of this algorithm and its implementation improves reproducibility of FTIR spectra interpretation across users, and provides an explicit framework by which additional constraints can be incorporated to reduce the uncertainty in the analysis.
O. However, as there are aldehydic compounds expected in aqueous particles which are not expected to hydrate completely (e.g., acetaldehyde, pinonaldehyde), caution is still warranted when interpreting ambient and smog chamber aerosol spectra. The software programmed from this algorithm has been applied to the analysis of particles collected on Teflon substrates during various campaigns (Gilardoni et al. Citation2009; Liu et al. Citation2009; Russell et al. Citation2009; Bahadur et al. Citation2010; Hawkins and Russell Citation2010; Hawkins et al. Citation2010; Shaw et al. Citation2010; Day et al. Citation2010; Schwartz et al. Citation2010; Chhabra et al. Citation2011; Frossard et al. Citation2011; Liu et al. Citation2011; Takahama et al. Citation2011, Citation2012). The articulation of this algorithm and its implementation improves reproducibility of FTIR spectra interpretation across users, and provides an explicit framework by which additional constraints can be incorporated to reduce the uncertainty in the analysis.
uast_a_752065_sm0000.zip
Download Zip (306.7 KB)Acknowledgments
The authors would like to acknowledge W. R. Leaitch, T. S. Bates, P. K. Quinn, and D. Baumgardner, and the science and field teams of GoMACCS, MILAGRO, VOCALS-REx, ICEALOT, Barrow, Scripps Pier, and Whistler campaigns for assistance with sample collection and operation; L. Ahlm, R. Bahadur, A. Corrigan, D. Day, A. Frossard, S. Gilardoni, L. Hawkins, S. Liu, R. Modini, R. Schwartz, and P. Shaw for feedback on the algorithm; S. Gilardoni, L. Hawkins, and S. Liu for helpful discussions during development; and article reviewers for helpful comments. The authors acknowledge NSF ATM-0904203 for funding.
[Supplementary materials are available for this article. Go to the publisher’s online edition of Aerosol Science and Technology to view the free supplementary files.]
References
- Adachi , K. and Buseck , P. R. 2008 . Internally Mixed Soot, Sulfates, and Organic Matter in Aerosol Particles from Mexico City . Atmos. Chem. Phys. , 8 : 6469 – 6481 .
- Aiken , A. C. , Decarlo , P. F. , Kroll , J. H. , Worsnop , D. R. , Huffman , J. A. Docherty , K. S. 2008 . O/C and OM/OC Ratios of Primary, Secondary, and Ambient Organic Aerosols with High-Resolution Time-of-Flight Aerosol Mass Spectrometry . Environ. Sci. Technol. , 42 : 4478 – 4485 . 10.1021/es703009q
- Allen , D. T. , Palen , E. J. , Haimov , M. I. , Hering , S. V. and Young , J. R. 1994 . Fourier-Transform Infrared-Spectroscopy of Aerosol Collected In A Low-pressure Impactor (lpi/ftir)—Method Development and Field Calibration . Aerosol Sci. Technol. , 21 : 325 – 342 . 10.1080/02786829408959719
- Allan , J. D. , Jimenez , J. L. , Williams , P. I. , Alfarra , M. R. , Bower , K. N. Jayne , J. T. 2003 . Quantitative Sampling using an Aerodyne Aerosol Mass Spectrometer—1. Techniques of Data Interpretation and Error Analysis . J. Geophys. Res.-Atmos. , 108 : 4090 10.1029/2002JD002358
- Asher , W. E. , Pankow , J. F. , Erdakos , G. B. and Seinfeld , J. H. 2002 . Estimating the Vapor Pressures of Multi-Functional Oxygen-Containing Organic Compounds using Group Contribution Methods . Atmos. Environ. , 36: PII S1352–2310(01)00 564–7, 10.1016/S1352-2310(01)00564-7
- Bahadur , R. , Uplinger , T. , Russell , L. M. , Sive , B. C. , Cliff , S. S. Millet , D. B. 2010 . Phenol Groups in Northeastern US Submicrometer Aerosol Particles Produced from Seawater Sources . Environ. Sci. Technol. , 44 : 2542 – 2548 . 10.1021/es9032277
- Blout , E. R. , Fields , M. and Karplus , R. 1948 . Absorption Spectra.6. the Infrared Spectra of Certain Compounds Containing Conjugated Double Bonds . J. Am. Chem. Soc. , 70 : 194 – 198 . 10.1021/ja01181a056
- Box , G. E. P. , Jenkins , G. M. and Reinsel , G. C. 2008 . Time Series Analysis: Forecasting and Control (4th ed.) , Hoboken , NJ : John Wiley & Sons, Inc. .
- Buschmann , H.-J. , F¯ldner , H.-H. and Knoche , W. 1980 . The Reversible Hydration of Carbonyl Compounds in Aqueous Solution. Part I, The Keto/Gem-diol Equilibrium . Berichte der Bunsengesellschaft f¯r physikalische Chemie , 84 : 41 – 44 . 10.1002/bbpc.19800840109
- Chan , M. N. , Lee , A. K. Y. and Chan , C. K. 2006 . Responses of Ammonium Sulfate Particles Coated with Glutaric Acid to Cyclic Changes in Relative Humidity: Hygroscopicity and Raman Characterization . Environ. Sci. Technol. , 40 : 6983 – 6989 . 10.1021/es060928c
- Chang , E. I. and Pankow , J. F. 2006 . Prediction of Activity Coefficients in Liquid Aerosol Particles Containing Organic Compounds, Dissolved Inorganic Salts, and Water – Part 2: Consideration of Phase Separation Effects by an X-UNIFAC Model . Atmos. Environ. , 40 : 6422 – 6436 . 10.1016/j.atmosenv.2006.04.031
- Chattopadhyay , S. and Ziemann , P. J. 2005 . Vapor Pressures of Substituted and Unsubstituted Monocarboxylic and Dicarboxylic Acids Measured using an Improved Thermal Desorption Particle Beam Mass Spectrometry Method . Aerosol Sci. Technol. , 39 : 1085 – 1100 . 10.1080/02786820500421547
- Chhabra , P. S. , Flagan , R. C. and Seinfeld , J. H. 2010 . Elemental Analysis of Chamber Organic Aerosol using an Aerodyne High-Resolution Aerosol Mass Spectrometer . Atmos. Chem. Phys. , 10 : 4111 – 4131 . 10.5194/acp-10-4111-2010
- Chhabra , P. S. , Ng , N. L. , Canagaratna , M. R. , Corrigan , A. L. , Russell , L. M. Worsnop , D. R. 2011 . Elemental Composition and Oxidation of Chamber Organic Aerosol . Atmos. Chem. Phys. , 11 : 8827 – 8845 . 10.5194/acp-11-8827-2011
- Coates , J. 2006 . “ Interpretation of Infrared Spectra, A Practical Approach ” . In Encyclopedia of Analytical Chemistry , Edited by: Meyers , R. A. 10815 – 10837 . Chichester : John Wiley & Sons, Ltd. .
- Coury , C. and Dillner , A. M. 2008 . A Method to Quantify Organic Functional Groups and Inorganic Compounds in Ambient Aerosols using Attenuated Total Reflectance FTIR Spectroscopy and Multivariate Chemometric Techniques . Atmos. Environ. , 42 : 5923 – 5932 . 10.1016/j.atmosenv.2008.03.026
- Creighton , D. J. , Migliorini , M. , Pourmotabbed , T. and Guha , M. K. 1988 . Optimization of Efficieny in the Glyoxylase Pathway . Biochemistry , 27 : 7376 – 7384 .
- Day , D. A. , Liu , S. , Russell , L. M. and Ziemann , P. J. 2010 . Organonitrate Group Concentrations in Submicron Particles with High Nitrate and Organic Fractions in Coastal Southern California . Atmos. Environ. , 44 : 1970 – 1979 . 10.1016/j.atmosenv.2010.02.045
- De Andrade , J. B. , Pinheiro , H. L. C. and Andrade , M. V. 1993 . Determination Of Formaldehyde and Acetaldehyde Associated to Atmospheric Aerosols by HPLC . Int. J. Environ. Anal. Chem. , 52 : 49 – 56 . 10.1080/03067319308042847
- Decesari , S. , Mircea , M. , Cavalli , F. , Fuzzi , S. , Moretti , F. Tagliavini , E. 2007 . Source Attribution of Water-Soluble Organic Aerosol by Nuclear Magnetic Resonance Spectroscopy . Environ. Sci. Technol. , 41 : 2479 – 2484 . 10.1021/es061711l
- Donahue , N. M. , Epstein , S. A. , Pandis , S. N. and Robinson , A. L. 2011 . A Two-Dimensional Volatility Basis Set: 1. Organic-Aerosol Mixing Thermodynamics . Atmos. Chem. Phys. , 11 : 3303 – 3318 . 10.5194/acp-11-3303-2011
- Dron , J. , El Haddad , I. , Temime-Roussel , B. , Jaffrezo , J.-L. , Wortham , H. and Marchand , N. 2010 . Functional Group Composition of Ambient and Source Organic Aerosols Determined by Tandem Mass Spectrometry . Atmos. Chem. Phys. , 10 : 7041 – 7055 . 10.5194/acp-10-7041-2010
- Erdakos , G. B. , Chang , E. I. , Pankow , J. F. and Seinfeld , J. H. 2006 . Prediction of Activity Coefficients in Liquid Aerosol Particles Containing Organic Compounds, Dissolved Inorganic Salts, and Water - Part 3: Organic Compounds, Water, and Ionic Constituents by Consideration of Short-, mid-, and Long-Range Effects using X-UNIFAC.3 . Atmos. Environ. , 40 : 6437 – 6452 . 10.1016/j.atmosenv.2006.04.001
- Fredenslund , A. , Jones , R. and Prausnitz , J. 1975 . Group-Contribution Estimation of Activity Coefficients in Nonideal Liquid Mixtures . AIChE J. , 21 : 1086 – 1099 .
- Frossard , A. A. , Shaw , P. M. , Russell , L. M. , Kroll , J. H. , Canagaratna , M. R. Worsnop , D. R. 2011 . Springtime Arctic Haze Contributions of Submicron Organic Particles from European and Asian Combustion Sources . J. Geophys. Res.-Atmos. , 116 : D05205 10.1029/2010JD015178
- Gilardoni , S. , Liu , S. , Takahama , S. , Russell , L. M. , Allan , J. D. Steinbrecher , R. 2009 . Characterization of Organic Ambient Aerosol During MIRAGE 2006 on Three Platforms . Atmos. Chem. Phys. , 9 : 5417 – 5432 .
- Gilardoni , S. , Russell , L. M. , Sorooshian , A. , Flagan , R. C. , Seinfeld , J. H. Bates , T. S. 2007 . Regional Variation of Organic Functional Groups in Aerosol Particles on Four US East Coast Platforms During the International Consortium for Atmospheric Research on Transport and Transformation 2004 Campaign . J. Geophys. Res.-Atmos. , 112 : D10S27 10.1029/2006JD007737
- Goldstein , A. H. , Worton , D. R. , Williams , B. J. , Hering , S. V. , Kreisberg , N. M. Panic , O. 2008 . Thermal Desorption Comprehensive Two-Dimensional Gas Chromatography for in-situ Measurements of Organic Aerosols . J. Chromatogr. A , 1186 : 340 – 347 . 10.1016/j.chroma.2007.09.094
- Griffiths , P. and Haseth , J. A. D. 2007 . Fourier Transform Infrared Spectrometry (2nd ed.) , Hoboken , NJ : John Wiley & Sons .
- Guthrie , J. P. 1975 . Carbonyl Addition-Reactions – Factors Affecting Hydrate-Hemiacetal and Hemiacetal-Acetal Equilibrium-Constants . Canadian J. Chem.-Rev. Canadienne De Chimie , 53 : 898 – 906 . 10.1139/v75-125
- Hamilton , J. F. , Webb , P. J. , Lewis , A. C. , Hopkins , J. R. , Smith , S. and Davy , P. 2004 . Partially Oxidised Organic Components in Urban Aerosol using GCXGC-TOF/MS . Atmos. Chem. Phys. , 4 : 1279 – 1290 .
- Hawkins , L. N. and Russell , L. M. 2010 . Oxidation of Ketone Groups in Transported Biomass Burning Aerosol from the 2008 Northern California Lightning Series Fires . Atmos. Environ. , 44 : 4142 – 4154 . 10.1016/j.atmosenv.2010.07.036
- Hawkins , L. N. , Russell , L. M. , Covert , D. S. , Quinn , P. K. and Bates , T. S. 2010 . Carboxylic Acids, Sulfates, and Organosulfates in Processed Continental Organic Aerosol Over the Southeast Pacific Ocean During VOCALS-REx 2008 . J. Geophys. Res.-Atmos. , 115 : D13201 10.1029/2009JD013276
- Hay , M. B. and Myneni , S. C. B. 2007 . Structural Environments of Carboxyl Groups in Natural Organic Molecules from Terrestrial Systems. Part 1: Infrared Spectroscopy . Geochimica Et Cosmochimica Acta , 71 : 3518 – 3532 . 10.1016/j.gca.2007.03.038
- Holes , A. , Eusebi , A. , Grosjean , D. and Allen , D. T. 1997 . FTIR Analysis of Aerosol Formed in the Photooxidation of 1,3,5-Trimethylbenzene . Aerosol Sci. Technol. , 26 : 516 – 526 . 10.1080/02786829708965450
- Jimenez , J. L. , Canagaratna , M. R. , Donahue , N. M. , Prevot , A. S. H. , Zhang , Q. Kroll , J. H. 2009 . Evolution of Organic Aerosols in the Atmosphere . Science , 326 : 1525 – 1529 . 10.1126/science.1180353
- Kanakidou , M. , Seinfeld , J. H. , Pandis , S. N. , Barnes , I. , Dentener , F. J. Facchini , M. C. 2005 . Organic Aerosol and Global Climate Modelling: A Review . Atmos. Chem. Phys. , 5 : 1053 – 1123 .
- Lambert , J. B. , Shurvell , H. F. , Lightner , D. and Cooks , R. G. 1998 . Organic Structural Spectroscopy , Upper Saddle River , NJ : Prentice Hall .
- Laskin , A. , Cowin , J. P. and Iedema , M. J. 2006 . Analysis of Individual Environmental Particles using Modern Methods of Electron Microscopy and X-Ray Microanalysis . J. Electron Spectrosc. Relat. Phenom. , 150 : 260 – 274 . 10.1016/j.elspec.2005.06.008
- Lewis , C. A. and Wolfenden , R. 1973 . Influence of Pressure on the Equilibrium of Hydration of Aliphatic Aldehydes . J. Am. Chem. Soc. , 95 : 6685 – 6688 . 10.1021/ja00801a026
- Lim , H. J. and Turpin , B. J. 2002 . Origins of Primary and Secondary Organic Aerosol in Atlanta: Results’ of Time-Resolved Measurements During the Atlanta supersite experiment . Environ. Sci. Technol. , 36 : 4489 – 4496 . 10.1021/es0206487
- Liu , S. , Day , D. A. , Shields , J. E. and Russell , L. M. 2011 . Ozone-Driven Daytime Formation of Secondary Organic Aerosol Containing Carboxylic Acid Groups and Alkane Groups . Atmos. Chem. Phys. , 11 : 8321 – 8341 . 10.5194/acp-11-8321-2011
- Liu , S. , Takahama , S. , Russell , L. M. , Gilardoni , S. and Baumgardner , D. 2009 . Oxygenated Organic Functional Groups and Their Sources in Single and Submicron Organic Particles in MILAGRO 2006 Campaign . Atmos. Chem. Phys. , 9 : 6849 – 6863 .
- Maria , S. F. , Russell , L. M. , Turpin , B. J. and Porcja , R. J. 2002 . FTIR Measurements of Functional Groups and Organic Mass in Aerosol Samples Over the Caribbean . Atmos. Environ. , 36 : 5185 – 5196 . 10.1016/S1352-2310(02)00654-4
- Maria , S. F. , Russell , L. M. , Turpin , B. J. , Porcja , R. J. , Campos , T. L. Weber , R. J. 2003 . Source Signatures of Carbon Monoxide and Organic Functional Groups in Asian Pacific Regional Aerosol Characterization Experiment (ACE-Asia) Submicron Aerosol Types . J. Geophys. Res.-Atmos. , 108 ( D23 ) : 8637 10.1029/2003JD003703
- Martin , S. T. 2000 . Phase Transitions of Aqueous Atmospheric Particles . Chem. Rev. , 100 : 3403 – 3453 . 10.1021/cr990034t
- Ming , Y. and Russell , L. M. 2002 . Thermodynamic Equilibrium of Organic-Electrolyte Mixtures in Aerosol Particles . Aiche J. , 48 : 1331 – 1348 .
- Ng , N. L. , Canagaratna , M. R. , Zhang , Q. , Jimenez , J. L. , Tian , J. Ulbrich , I. M. 2010 . Organic Aerosol Components Observed in Northern Hemispheric Datasets from Aerosol Mass Spectrometry . Atmos. Chem. Phys. , 10 : 4625 – 4641 . 10.5194/acp-10-4625-2010
- Noble , C. A. and Prather , K. A. 2000 . Real-Time Single Particle Mass Spectrometry: A Historical Review of a Quarter Century of the Chemical Analysis of Aerosols . Mass Spectrom. Rev. , 19 : 248 – 274 . 10.1002/1098-2787(200007)19:4!‘248
- Ofner , J. , Krueger , H. U. , Grothe , H. , Schmitt-Kopplin , P. , Whitmore , K. and Zetzsch , C. 2011 . Physico-Chemical Characterization of SOA Derived from Catechol and Guaiacol—a Model Substance for the Aromatic Fraction of Atmospheric HULIS . Atmos. Chem. Phys. , 11 : 1 – 15 . 10.5194/acp-11-1-2011
- Paatero , P. , Hopke , P. K. , Song , X. H. and Ramadan , Z. 2002 . Understanding and Controlling Rotations in Factor Analytic Models . Chemometr. Intell. Lab. , 60 : 253 – 264 .
- Paatero , P. and Tapper , U. 1994 . Positive Matrix Factorization – A Nonnegative Factor Model with Optimal Utilization of Error-estimates of Data Values . Environmetrics , 5 : 111 – 126 .
- Pankow , J. F. and Barsanti , K. C. 2009 . The Carbon Number-Polarity Grid: A Means to Manage the Complexity of the Mix of Organic Compounds When Modeling Atmospheric Organic Particulate Matter . Atmos. Environ. , 43 : 2829 – 2835 . 10.1016/j.atmosenv.2008.12.050
- Pankow , J. F. and Chang , E. I. 2008 . Variation in the Sensitivity of Predicted Levels of Atmospheric Organic Particulate Matter (OPM) . Environ. Sci. Technol. , 42 : 7321 – 7329 . 10.1021/es8003377
- Polidori , A. , Turpin , B. J. , Davidson , C. I. , Rodenburg , L. A. and Maimone , F. 2008 . Organic PM2.5: Fractionation by Polarity, FTIR Spectroscopy, and OM/OC Ratio for the Pittsburgh Aerosol . Aerosol Sci. Technol. , 42 : 233 – 246 . 10.1080/02786820801958767
- Quinn , P. K. , Bates , T. S. , Coffman , D. , Onasch , T. B. , Worsnop , D. Baynard , T. 2006 . Impacts of Sources and Aging on Submicrometer Aerosol Properties in the Marine Boundary Layer Across the Gulf of Maine . J. Geophys. Res.-Atmos. , 111 : D23S36 10.1029/2006JD007582
- R Development Core Team . 2012 . R: A Language and Environment for Statistical Computing , Vienna, Austria : R Foundation for Statistical Computing . http://www.R-project.org/, ISBN 3-900051-07-0
- Reff , A. , Turpin , B. J. , Offenberg , J. H. , Weisel , C. P. , Zhang , J. Morandi , M. 2007 . A Functional Group Characterization of Organic PM2.5 Exposure: Results from the RIOPA Study RID C-3787-2009 . Atmos. Environ. , 41 : 4585 – 4598 . 10.1016/j.atmosenv.2007.03.054
- Rood , M. J. , Shaw , M. A. , Larson , T. V. and Covert , D. S. 1989 . Ubiquitous Nature of Ambient Metastable Aerosol . Nature , 337 : 537 – 539 . 10.1038/337537a0
- Rudich , Y. , Donahue , N. M. and Mentel , T. F. 2007 . Aging of Organic Aerosol: Bridging the Gap Between Laboratory and Field Studies . Ann. Rev. Phys. Chem. , 58 : 321 – 352 . 10.1146/annurev.physchem.58.032806.104432
- Russell , L. M. 2003 . Aerosol Organic-Mass-to-Organic-Carbon Ratio Measurements . Environ. Sci. Technol. , 37 : 2982 – 2987 . 10.1021/es026123w
- Russell , L. M. , Bahadur , R. and Ziemann , P. J. 2011 . Identifying Organic Aerosol Sources by Comparing Functional Group Composition in Chamber and Atmospheric Particles . Proc. Natl. Acad. Sci. USA , 108 : 3516 – 3521 . 10.1073/pnas.1006461108
- Russell , L. M. , Hawkins , L. N. , Frossard , A. A. , Quinn , P. K. and Bates , T. S. 2010 . Carbohydrate-Like Composition of Submicron Atmospheric Particles and Their Production from Ocean Bubble Bursting . Proc. Natl Acad. Sci. USA , 107 : 6652 – 6657 . 10.1073/pnas.0908905107
- Russell , L. M. , Takahama , S. , Liu , S. , Hawkins , L. N. , Covert , D. S. Quinn , P. K. 2009 . Oxygenated Fraction and Mass of Organic Aerosol from Direct Emission and Atmospheric Processing Measured on the R/V Ronald Brown During TEXAQS/GoMACCS 2006 . J. Geophys. Res.-Atmos. , 114 : D00F05 10.1029/2008JD011275
- Sax , M. , Zenobi , R. , Baltensperger , U. and Kalberer , M. 2005 . Time Resolved Infrared Spectroscopic Analysis of Aerosol Formed by Photo-Oxidation of 1,3,5-Trimethylbenzene and Alpha-Pinene . Aerosol Sci. Technol. , 39 : 822 – 830 . 10.1080/02786820500257859, rID F-1113-2010
- Schauer , J. J. , Kleeman , M. J. , Cass , G. R. and Simoneit , B. R. T . 1999 . Measurement of Emissions from Air Pollution Sources. 1. C-1 Through C-29 Organic Compounds from Meat Charbroiling . Environ. Sci. Technol. , 33 : 1566 – 1577 .
- Schwartz , R. E. , Russell , L. M. , Sjostedt , S. J. , Vlasenko , A. , Slowik , J. G. Abbatt , J. P. D. 2010 . Biogenic Oxidized Organic Functional Groups in Aerosol Particles from a Mountain Forest Site and Their Similarities to Laboratory Chamber Products . Atmos. Chem. Phys. , 10 : 5075 – 5088 . 10.5194/acp-10-5075-2010
- Schwarzenbach , R. P. , Gschwend , P. M. and Imboden , D. M. 2002 . Environmental Organic Chemistry (2nd ed.) , Hoboken , NJ : John Wiley & Sons .
- Seinfeld , J. H. and Pandis , S. N. 2006 . Atmospheric Chemistry and Physics (2nd ed.) , New York : John Wiley & Sons .
- Shaw , P. M. , Russell , L. M. , Jefferson , A. and Quinn , P. K. 2010 . Arctic Organic Aerosol Measurements Show Particles from Mixed Combustion in Spring Haze and from Frost Flowers in Winter . Geophys. Res. Lett. , 37 : L10803 10.1029/2010GL042831
- Smith , J. N. , Moore , K. F. , McMurry , P. H. and Eisele , F. L. 2004 . Atmospheric Measurements of Sub-20 nm Diameter Particle Chemical Composition by Thermal Desorption Chemical Ionization Mass Spectrometry . Aerosol Sci. Technol. , 38 : 100 – 110 . 10.1080/02786820490249036
- Song , M. , Marcolli , C. , Krieger , U. K. , Zuend , A. and Peter , T. 2012 . Liquid-Liquid Phase Separation and Morphology of Internally Mixed Dicarboxylic Acids/Ammonium Sulfate/Water Particles . Atmos. Chem. Phys. , 12 : 2691 – 2712 . 10.5194/acp-12-2691-2012
- Subramanian , R. , Khlystov , A. Y. , Cabada , J. C. and Robinson , A. L. 2004 . Positive and Negative Artifacts in Particulate Organic Carbon Measurements with Denuded and Undenuded Sampler Configurations . Aerosol Sci. Technol. , 38 : 27 – 48 . 10.1080/02786820390229354
- Takahama , S. , Johnson , A. , Morales , J. G. , Russell , L. , Duran , R. Rodriguez , G. 2012 . Submicron Organic Aerosol in Tijuana, Mexico, from Local and Southern California Sources During the CalMex Campaign . Atmos. Environ. , 10.1016/j.atmosenv.2012.07.057
- Takahama , S. , Schwartz , R. E. , Russell , L. M. , Macdonald , A. M. , Sharma , S. and Leaitch , W. R. 2011 . Organic Functional Groups in Aerosol Particles from Burning and Non-Burning Forest Emissions at a High-Elevation Mountain Site . Atmos. Chem. Phys. , 11 : 6367 – 6386 . 10.5194/acp-11-6367-2011
- Tervahattu , H. , Juhanoja , J. and Kupiainen , K. 2002 . Identification of an Organic Coating on Marine Aerosol Particles by TOF-SIMS . J. Geophys. Res.-Atmos. , 107 ( D19 ) : 1319 10.1029/2001JD001403
- Topping , D. O. , McFiggans , G. B. and Coe , H. 2005 . A Curved Multi-Component Aerosol Hygroscopicity Model Framework: Part 2—Including Organic Compounds . Atmos. Chem. Phys. , 5 : 1223 – 1242 .
- Wasa , T. and Musha , S. 1970 . Polarographic Behavior of Glyoxal And Its Related Compounds . Bull. Univ. Osaka Prefecture. Ser. A, Eng. Nat. Sci. , 19 : 169 – 180 .
- Wiberg , K. B. , Morgan , K. M. and Maltz , H. 1994 . Thermochemistry of Carbonyl Reactions. 6. A Study of Hydration Equilibria . J. Am. Chem. Soc. , 116 : 11067 – 11077 . 10.1021/ja00103a024
- Williams , B. J. , Goldstein , A. H. , Kreisberg , N. M. and Hering , S. V. 2006 . An In-Situ Instrument for Speciated Organic Composition of Atmospheric Aerosols: Thermal Desorption Aerosol GC/MS-FID (TAG) . Aerosol Sci. Technol. , 40 : 627 – 638 . 10.1080/02786820600754631
- Yu , J. Z. , Griffin , R. J. , Cocker , D. R. , Flagan , R. C. , Seinfeld , J. H. and Blanchard , P. 1999 . Observation of Gaseous and Particulate Products of Monoterpene Oxidation in Forest Atmospheres . Geophys. Res. Lett. , 26 : 1145 – 1148 . 10.1029/1999GL900169
- Zhao , J. , Eisele , F. L. , Titcombe , M. , Kuang , C. and McMurry , P. H. 2010 . Chemical Ionization Mass Spectrometric Measurements of Atmospheric Neutral Clusters using the Cluster-CIMS . J. Geophys. Res.– Atmos. , 115:786 10.1029/2009JD012606
- Zuend , A. , Marcolli , C. , Booth , A. M. , Lienhard , D. M. , Soonsin , V. Krieger , U. K. 2011 . New and Extended Parameterization of the Thermodynamic Model AIOMFAC: Calculation of Activity Coefficients for organic-inorganic mixtures containing carboxyl, hydroxyl, carbonyl, ether, ester, alkenyl, alkyl, and Aromatic Functional Groups . Atmos. Chem. Phys. , 11 : 9155 – 9206 . 10.5194/acp-11-9155-2011
- Zuend , A. , Marcolli , C. , Luo , B. P. and Peter , T. 2008 . A Thermodynamic Model of Mixed Organic-Inorganic Aerosols to Predict Activity Coefficients . Atmos. Chem. Phys. , 8 : 4559 – 4593 .
- Zuend , A. , Marcolli , C. , Peter , T. and Seinfeld , J. H. 2010 . Computation of Liquid-Liquid Equilibria and Phase Stabilities: Implications for RH-Dependent Gas/Particle Partitioning of Organic-Inorganic Aerosols . Atmos. Chem. Phys. , 10 : 7795 – 7820 . 10.5194/acp-10-7795-2010
- Zuend , A. and Seinfeld , J. H. 2012 . Modeling the Gas-Particle Partitioning of Secondary Organic Aerosol: The Importance of Liquid-Liquid Phase Separation . Atmos. Chem. Phys. , 12 : 3857 – 3882 . 10.5194/acp-12-3857-2012