Abstract
Soot particle (black carbon) morphology is of dual interest, both from a health perspective and due to the influence of soot on the global climate. In this study, the mass-mobility relationships, and thus effective densities, of soot agglomerates from three types of soot emitting sources were determined in situ by combining a differential mobility analyzer (DMA) and an aerosol particle mass analyzer (APM). High-resolution transmission electron microscopy was also used. The soot sources were diesel engines, diffusion flame soot generators, and tapered candles, operated under varying conditions. The soot microstructure was found to be similar for all sources and settings tested, with a distance between the graphene layers of 3.7–3.8 Å. The particle specific surface area was found to vary from 100 to 260 m2/g. The particle mass-mobility relationship could be described by a power law function with an average exponent of 2.3 (±0.1) for sources with a volatile mass fraction <10% and primary particle sizes of 11–29 nm. The diesel exhaust from a heavy duty engine at idling had a substantially higher volatile mass fraction and a higher mass-mobility exponent of 2.6. The mass-mobility exponent was essentially independent of the number of primary particles in the range covered (Npp = 10–1000). Despite the similar exponents, the effective density varied substantially from source to source. Two parameters were found to alter the effective density: primary particle size and coating mass fraction. A correlation was found between primary particle size and mass-mobility relationship/effective density and an empirical expression relating these parameters is presented. The effects on the DMA-APM results of doubly charged particles and DMA agglomerate alignment were investigated and quantified. Finally, the dataset was compared to three theoretical approaches describing agglomerate particles’ mass-mobility relationship.
Copyright 2013 American Association for Aerosol Research
1. INTRODUCTION
Airborne soot particles are of dual interest due to their adverse effects on human health (Peng et al. Citation2009) and global climate (IPCC Citation2007; UNEP/WMO Citation2011). Ambient particles and soot have been associated with adverse effects in both long-term and acute exposure studies (Donaldson et al. Citation2005; Donaldson and Seaton Citation2012; WHO Citation2012). Properties associated with soot particles are a large surface area (SA) and the presence of metals and organics, properties that all have the potential to induce oxidative stress (Donaldson et al. Citation2005). To advance the current understanding of the effects of soot particle exposure on health, it is important to obtain more detailed characterization of the soot particle properties (Giechaskiel et al. Citation2009). Soot particles are also relevant for their effect on the global radiative forcing. Particle characteristics that affect the optical properties in addition to particle size are morphology, primary particle size, and coating (Kahnert and Devasthale Citation2011). The climate is also impacted by the ability of soot particles to affect cloud formation, which is dependent on the amount of particles and the chemistry of the particle coating (Rissler et al. Citation2005; Svenningsson et al. Citation2006; Rissler et al. Citation2010). Important ambient soot sources are road traffic, especially diesel engines (Maricq Citation2007), ship emissions (Corbett and Fischbeck Citation1997), and biomass combustion (Pagels et al. Citation2013). There are also indoor sources, such as candle burning (Pagels et al. Citation2009b), that are important for indoor exposure.
Soot particle size distributions are typically classified according to their equivalent mobility sizes, which is the relevant size measure of soot agglomerates when it comes to transport and deposition in human lungs (Rissler et al. Citation2012) as well as the mass transfer during condensational growth processes in ambient air (Rogak et al. Citation1991). To estimate the surface area (SA) and mass from such measurements, additional information is required, such as effective density, primary particle size, and morphology (Happonen et al. Citation2010; Rissler et al. Citation2012; Messing et al. Citation2013). The mass-mobility relationship or effective density is crucial when determining the mass dose to the lung from such measurements. Furthermore, effective density links mobility size with mass and aerodynamic diameter (Park et al. Citation2003; DeCarlo et al. Citation2004). This is highly relevant since other measurement techniques rely on aerodynamic equivalent diameters (e.g., cascade impactors and aerosol mass spectrometers). The effective density (ρeff) as defined from simultaneous tandem measurements of mobility size (dm) and mass (m), can be measured with the differential mobility analyzer-aerosol particle mass analyzer (DMA-APM), further described by McMurry et al. (Citation2002):
Other techniques may also yield related information (DeCarlo et al. Citation2004; Maricq and Ning Citation2004; Virtanen et al. Citation2004).
While the material density of the primary particles constituting the soot core is ∼2 g/cm3 (Mullins and Williams Citation1987; Dobbins Citation2002; Park et al. Citation2004), the effective density of the agglomerated soot particles is lower, and it substantially decreases with size (Park et al. Citation2003; Maricq and Ning Citation2004; Pagels et al. Citation2009a) to less than a factor of ten of the material density. A number of mass-mobility datasets have been reported for soot from light-duty diesel engines (Maricq and Ning Citation2004; Olfert et al. Citation2007), heavy-duty engines (Park et al. Citation2003), and novel diesel engine concepts such as premixed charge compression ignition (PCCI) (Barone et al. Citation2011). Data are also available on diffusion flame soot generators (Malik et al. Citation2011a; Ghazi et al. Citation2013), on coating experiments to simulate the transformation of soot in the atmosphere (Pagels et al. Citation2009a; Ghazi and Olfert Citation2013), and on atmospheric measurements near busy roads (Geller et al. Citation2006). Many soot sources have yet to be characterized and some issues about analyzing the data need to be addressed, since the DMA-APM is a relatively new research tool and currently only available to a limited number of research laboratories worldwide. Furthermore, it is important to perform experiments for a large number of soot sources to identify general trends in the mass-mobility relationship and effective density in order to make generalizations regarding properties such as dynamic shape factors (Shin et al. Citation2009). It has been established that primary particle size (Lall and Friedlander Citation2006), coating mass fraction (Park et al. Citation2003; Rissler et al. Citation2012), core restructuring (Pagels et al. Citation2009a), and bridging between primary particles may affect the mass-mobility relationship. But limited generic knowledge has been extracted so far because only single datasets have typically been presented and discussed in the literature.
Several models have been suggested to describe the relation between dm, primary particle size and number of monomers in an agglomerate (Npp). In a few studies, these models have also been compared to single datasets of particles from one source with typically one primary particle size (Schmidt-Ott Citation1988; Schmidt-Ott et al. Citation1990; Lall and Friedlander Citation2006; Lall et al. Citation2008; Sorensen Citation2011). Eggersdorfer et al. (Citation2012) investigated the mass-mobility relationship of ZrO2 agglomerates and aggregates generated by Flame Spray Pyrolysis. The primary particle diameter varied between 5 and 24 nm for different settings of the generator. They found that: (1) all their data could be fitted with a mass-mobility exponent of 2.15 (±0.1) and (2) they could predict the primary particle size from their on-line DMA-APM measurements.
The aim of this article is to present general trends in the mass-mobility relationships for freshly emitted soot agglomerates from three diverse sources. This is based on a dataset collected mainly using the DMA-APM technique and high-resolution transmission electron microscopy (HR-TEM) image analysis, consisting of the mass-mobility relationship, effective density, primary particle size, and soot microstructure. Other health relevant parameters such as volatile mass fraction and specific surface area are also given. From the dataset, we identify factors that affect the mass-mobility relationship. We go on to suggest an empirical expression for the mass-mobility relationship (and thereby for the effective density) as a function of the primary particle size, to be used when data is not available. Furthermore, some issues in the DMA-APM data evaluation such as the effect of not considering doubly charged particles and agglomerate alignment in the DMA, are evaluated and the effects quantified. Finally, the dataset is compared to three theoretical approaches describing the mass-mobility relationship of the agglomerate particles.
2. EXPERIMENTAL METHODS
The aerosol particles studied were soot emitted from three sources: diesel engines, a flame soot generator (diffusion type), and a tapered candle. Soot from the first two sources was studied under several operation conditions.
The main instrument used for the soot characterization was the DMA-APM system, with and without a thermodenuder (TD) coupled between the DMA and the APM. Additional instruments used were a scanning mobility particle sizer (SMPS) and HR-TEM for analysis of primary particle size and soot microstructure. A schematic of the experimental setup is provided in .
Table 1 TABLE 1 Summary of experiments
2.1. Exhaust and Sampling
In the diesel experiments, a heavy duty test bench diesel engine and a light-duty Euro II vehicle were used, operated with a low-sulfur content fuel. The heavy-duty engine was operated in a motor test bench enabling simulation of two engine-running conditions: idling and transient cycle. The transient cycle was designed according to the urban driving part of the standardized European Transient Cycle standard protocol (Barath et al. Citation2010). The light-duty vehicle was operated at idling load. The systems are hereafter referred to as “heavy duty” and “light duty.” The test setup and dilution system is described in more detail elsewhere (Nordin et al. Citation2012; Rissler et al. Citation2012).
The flame soot was generated by a co-flow diffusion flame soot generator, operating on propane gas (Malik et al. Citation2011a). The emissions at two air-to-fuel ratios were studied, resulting in two different number size distributions with geometric mean diameters (GMDs) of 50 and 100 nm. The two experimental settings with high and low air-to-fuel ratios are hereafter referred to as flame soot 50 and flame soot 100, respectively.
Soot from candles was generated by lighting tapered candles inside a 22 m3 stainless steel chamber. An oscillating fan was operating inside the chamber to ensure complete mixing and to create a wobbling flame. This enhances soot formation, similar to how the “sooting burn” experiments in the study by Pagels et al. (Citation2009b) were performed.
An overview of the soot characterization experiments is presented in . The generation, dilution, and sampling systems are described in detail in the online supplemental information (SI).
2.2. Instrumentation and Analysis
2.2.1. Number Size Distributions
The dry (<20% RH) size distribution was measured with an SMPS (10–600 nm), which sizes particles according to their mobility diameter, dm. The SMPS consists of a 63Ni bipolar charger, a DMA of Vienna type (length 280 mm, inner/outer radius 25.0/32.4 mm, aerosol flow rate 1.0 L/min, and sheath flow rate 6.0 L/min) and a condensation particle counter (CPC model 3010, TSI Inc., Shoreview, MN, USA). The number size distributions were fitted with one or two lognormal frequency distributions according to Equation (S1) in the SI.
2.2.2. HR-TEM Analysis
TEM samples were prepared by direct deposition of soot particles onto lacey carbon coated copper TEM grids, using an electrostatic precipitator (NAS Model 3089, TSI Inc., operated at 9.6 kV, 1 lpm). Subsequently, an HR-TEM (JEOL 3000 F, 300 kV), equipped with a field emission gun, was used to carry out detailed investigations of primary particle size and primary particle fine structure. The size of the primary particles was determined using the software ImageJ (Rasband, W. S. 1997–2009). Two hundred to six hundred primary particles were measured per source. The average distance between the graphene layers (Dgraphene) was obtained by measuring line profiles across the fringes of graphene layers on at least five randomly located positions in each image, on a minimum of two images per soot particle type.
2.2.3. The DMA-(TD)-APM System
In situ (gas phase) characterization of the particle mass-mobility relationship, and thus effective density, was performed using a DMA and an APM (), as described in detail by McMurry et al. (Citation2002). In the DMA-APM system, the mass of individual particles of the population is measured after being selected according to their mobility diameter. The APM consists of two concentric cylinders rotating at the same angular speed. A voltage is applied over the cylinders and the particles introduced in the gap in between experience a centrifugal force. Only particles of the specific mass for which the electric force equals the centrifugal force are transmitted by the APM and counted with a CPC (). A more detailed description, including equations, is given in the SI.
During the experiments, particles of dm between 50 and 450 nm were characterized. In the data analysis, doubly charged particles were corrected for as described in more detail in Section 2.3.1 and in the SI. The DMA-APM system was calibrated using polystyrene latex spheres (Duke Scientific Corp., USA) following the methodology described previously (McMurry et al. Citation2002). Details about the important calibration procedure are given in the SI.
Between the DMA and the APM, a TD was introduced, making it possible to alternate between measuring the mass of the selected particles before or after being heated. From this mass difference, the particle volatile mass fraction was estimated. The TD was kept at 300°C with a residence time of ∼10 s. More details about the TD are found in Malik et al. (Citation2011b).
2.2.4. Mass-Mobility Exponent and Effective Density
Several previous studies of particles formed in diffusion limited processes (Park et al. Citation2003; Maricq and Ning Citation2004; Olfert et al. Citation2007; Pagels et al. Citation2009a; Malik et al. Citation2011a; Rissler et al. Citation2012) have shown that the relation between mobility diameter and the agglomerate mass (magg) can be described by a power law function according to:
where ϵm is referred to as the mass-mobility exponent. EquationEquation (2)
is fitted to each dataset (fitting K and ϵm) after performing a log transformation turning it into a linear problem, which was solved by linear regression. For distributions where magg can be well described by a power law function, so can the particle effective density (combining EquationEquations (1)
and Equation(2)
):
Effective density is the mass normalized to the volume of a sphere of the same dm.
2.3. Evaluation of the DMA-APM Method
2.3.1. APM Data Analysis and Correction for Doubly Charged Particles
The individual DMA-APM scans were fitted by normal distributions. A method to correct for multiple charged particles was developed and performed as described in detail in Section S.3 (Sl). The procedure was similar to that performed in the study by Shin et al. (Citation2009).
For spherical particles, the DMA-APM system can separate doubly charged particles from the singly charged, as illustrated in Figure S1. However, for particles of a decreasing effective density with increasing size, which is typical for agglomerates, this is not always the case. This is discussed in the SI and illustrated in Figure S2.
The effect of considering multiple charges on the particle masses determined in this study is shown in , plotted as a function of the percentage of doubly charged particles (F2/(F1+F2) in Table S1). The effect and thus necessity of considering multiple charging in the DMA-APM analysis is mainly determined by the GMD of the particle number size distribution and ϵm. When particles of a diameter smaller than the GMD of the distribution (i.e., diameters on the left slope of the size distribution) are selected, the fraction of doubly charged particles may not be negligible. Since the probability of doubly charged particles increases with size, this effect is enlarged if the GMD of the size distributions is high, further discussed in the SI and illustrated by Table S1. The graph shows that as the fraction of doubly charged particles increases, so does the effect of the charge correction.
For soot generated by the diesel engines and the flame soot generator, the mass correction was most often less than −5%. For the candle smoke, larger correction factors were observed. The largest such charge correction was −17%, occurring for 200 nm particles.
To conclude, assuming singly charged particles in the analysis of the DMA-APM data in most cases introduces minor differences in the particle mass, especially when performing measurements for sizes larger than the GMD of the number size distribution and for distributions with GMD < 100 nm. However, it does introduce some uncertainty and in some cases needs to be considered.
2.3.2. Agglomerate Alignment in the DMA
If the soot agglomerates align parallel with the electric field of the DMA, the drag force acting on the agglomerate is reduced, leading to larger agglomerates being selected than if randomly orientated. Thus, the mass of the selected particles increases with increasing degree of alignment. We here suggest a new method using the DMA-APM to investigate and quantify the effects of alignment of soot agglomerates in the DMA. To systematically vary the electrical field strength during selection of a given electrical mobility three different DMA sheath flow rates were used: 1.2, 2.3, and 6.1 L/min. At each flow rate, particles of three diameters (100, 240, and 350 nm) were selected, and the individual mass of the selected agglomerates were quantified using the APM. The higher the sheath flow, the higher the DMA voltage required to select a given mobility size according to:
Here VDMA is the applied voltage, Zp the electrical mobility, Qsh the sheath flow, r2 and r1 the outer and inner diameters of the DMA, respectively, and L the length of the DMA. The corresponding DMA electrical fields needed when selecting the three particle sizes ranged from 200 to 1400 V/cm at 1.2 L/min, from 400 to 2700 V/cm at 2.3 L/min, and from 1100 to 7000 V/cm at 6.1 L/min.
If no alignment takes place, the mass of the selected agglomerates will stay constant at the different sheath flows (and DMA voltages). For each selected diameter, a polystyrene latex (PSL) size reference was used assuring that the same particle size was selected by the DMA (100, 240, and 350 nm) at the different sheath flow rates. This was done because the results (mass related to dm) are very sensitive to any error in selected particle size. In this way, the errors introduced by a slightly erroneous sheath flow or other DMA parameters were strongly reduced. The alignment tests were performed using soot agglomerates generated from the exhaust of the light-duty vehicle.
In this study, the effect of alignment is quantified relative to what it is at 1.2 L/min, assuming that no alignment takes place at this sheath flow. At 1.2 L/min the largest DMA voltage used is 1400 V/cm3, occurring for 350 nm particles. In a study by Shin et al. (Citation2010) a similar assumption was made, assuming a randomly orientated 300 nm particles at 1000 V/cm3. If the particles are not randomly oriented at 1.2 L/min, the effect of alignment will be slightly underestimated.
A significant particle alignment was observed for 240 and 350 nm particles, while none for the 100 nm particles, as illustrated in . This is in line with what was demonstrated in Zelenyuk and Imre (Citation2007); that particles of larger physical size to a higher extent align in the electrical field. Furthermore, larger particles require larger electrical field strengths to be selected by the DMA. At the most the alignment caused a mass increase by ∼20%, corresponding to a size shift estimated to 8% toward smaller dm, compared to when the agglomerates were randomly orientated. This is smaller than the size shift found in Wang and Friedlander (Citation2007) of 19–25% for fully aligned agglomerates (theoretical estimation), but in the same order of magnitude as in Shin et al. (Citation2010) for 300 nm particles, where the lowest field was 1000 V/cm.
3. RESULTS AND DISCUSSION
3.1. Particle Size Distributions
The number size distributions of the different types of soot agglomerates varied considerably, with GMDs ranging from 53 nm for flame soot 50, to 282 nm for the candle. The distributions are shown in Figure S3 in the SI and the fitted parameters (GMD and σg) describing the distributions are presented in .
Table 2 TABLE 2 Summary of measured quantities of the soot particles
The particles emitted during the transient cycle of the heavy-duty engine and the light-duty vehicle at idling load showed unimodal size distributions. During heavy-duty engine idling, the number size distribution was bimodal with a volatile nucleation mode (discussed in the SI) and a soot dominated accumulation mode (Rissler et al. Citation2012). The flame soot generator was used at two different air-to-fuel ratios, resulting in different particle size distributions that shifted toward larger sizes with a decreasing air-to-fuel ratio. The two number distributions were unimodal with GMDs of 53 nm and 97 nm, respectively (Flame soot 50 and Flame soot 100). The particles emitted during candle burning were bimodal, with a nucleation mode composed of inorganic compounds (Pagels et al. Citation2009b) and an accumulation mode of soot particles.
3.2. Volatile Mass Fraction
The volatile mass fraction of the soot particles was estimated from the DMA-TD-APM measurements, performed at 300°C. Soot particles from all sources, except from the heavy-duty engine at idling, had volatile mass fractions of ∼5–10%, as shown in Table S2 of the SI. During idling in the heavy-duty engine the particles’ volatile fraction was considerably higher and strongly size dependent, ranging from 38% at 50 nm to 12% at 450 nm.
3.3. Primary Particle Size
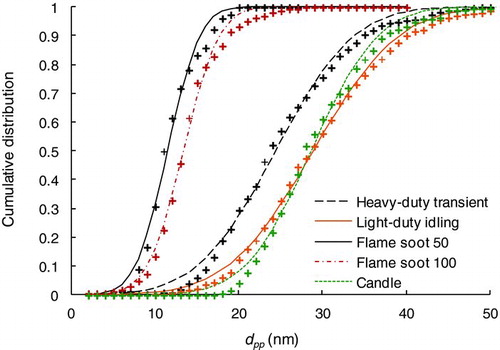
From all sources, the particles were built up by monomers (primary particles) forming irregular agglomerates. Analysis of the TEM images revealed that the primary particle diameter, dpp, of the flame soot was similar for the two generator settings and similar to previous observations for a similar generator (Bladh et al. Citation2011). The dpp for the two burner setting was 11 and 13 nm, here referring to the count median diameters (CMD) of the primary particle number size distributions. Larger dpp were found for the diesel exhaust and candle smoke, 24–28 nm. The CMD of dpp (±1 SD) is given in , both for the number and mass size distributions. Cumulative distributions of the primary particles are plotted in . The primary particle size found during heavy-duty engine idling, with a high amount of organics, is not provided in the graph since the organic coating is not well captured in the TEM (Egerton et al. Citation2004), leading to an underestimation of dpp.
3.4. Soot Particle Fine Structure
displays HR-TEM images of the soot fine structures of particles from the different sources investigated. The primary particles consisted of a multiple onion-like nuclei with bent graphene segments. The results from measurements of the distance between the graphene segments (Dgraphene) are presented in .
No obvious differences were observed in the fine structure for the diesel exhaust particles generated during different loads and engine types (–) with respect to Dgraphene, ranging from 3.66 to 3.69 Å. Soot particles generated by the flame soot generator were observed to have the most deviating fine structures among the investigated particles, with an onion-like structure of the primary particles that was not as clear as for the other exhaust types. No clear differences were observed between flame soot 50 and flame soot 100 ( and e). Graphene segment average distances were similar to those of soot from diesel engines, measured to 3.68 at both settings. The fine structure in this case, to a large extent, resembles the fine structure found in soot particles generated by the commercial GfG soot generator (Muller et al. Citation2007). Candle soot particles show the same type of fine structure as the diesel exhaust particles (). The measured Dgraphene was 3.78 Å, which is slightly larger than for the other soot types. Bridging was observed between the primaries.
The graphene segment distances found are greater than the distance between graphene segments in pure graphite, typically 3.362 Å (Muller et al. Citation2005). This is possibly explained by the strong curvature of the graphene layers and amorphous microstructure (i.e., the primary particles were built up by small ordered segments of graphite). This is consistent with previous observations made of diesel soot primary particle fine structure (Happonen et al. Citation2010).
3.5. Specific Surface Area
The specific surface area (SAsp) is defined as particle SA per mass unit. For agglomerates consisting of primary particles with point contact, without bridging in between the primary particles, SAsp is determined solely by the primary particle size (dpp) and primary particle density (ρpp) according to:
The assumption of point contact between the primary particles has also been used in a few previous studies (Ku and Kulkarni Citation2012; Rissler et al. Citation2012). Since the microstructure of the primary particles appeared similar with respect to graphene sheet distances, we assume that ρpp is the same for all particle types. In the calculations, a density of 1.8 g/cm3 was used (Mullins and Williams Citation1987; Dobbins Citation2002; Park et al. Citation2004).
From the specific SA, the absolute SA of the individual agglomerates as a function of dm, can be achieved by multiplying SAsp by magg(dm) from the DMA-APM. Together with the number of agglomerates per size bin from the SMPS, the total SA of the size distribution as a function of dm can be determined (Rissler et al. Citation2012).
The specific SAsps derived range from 262 m2/g for flame soot 50 to 100 m2/g for light-duty idling, the smaller the dpp, the larger the SAsp. The results are presented in . The SAsp found for diesel engines is close to the NIST (US National Institute of Standards and Technology) reported particle SA of 108 m2/g (NIST 1650b) for heavy duty diesel engine emissions. SAsp was calculated taking into account the broadening of the primary particle size distributions. If one does not consider the broadening and just makes an estimation of the specific SA from the dpp according to the CMD of the number size distribution, the estimation will increase by 10–15%. The larger the standard deviation of the distribution, the larger the increase. We chose not to give any values for the heavy duty idling engine in the table due to (1) the uncertainty of primary particle size from TEM and (2) since the assumption of point contact in the case of coated particles is not likely accurate.
3.6. Mass-Mobility Relationship and Effective Densities
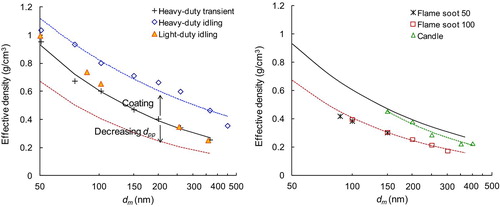
For each source and operating condition, the mass-mobility relationship was characterized and the effective density as a function of dm calculated. The results are shown in and 7. The complete dataset is presented in the SI, Table S2. The effective densities decreased with increasing dm from around 1 g/cm3 at 50 nm to as low as 0.18 g/cm3, observed for the 300 nm particles of flame soot 100, clearly showing that the soot in all exhaust types had an agglomerate structure. The density of pure graphite is ∼2 g/cm3 (Dobbins Citation2002; Stankovich et al. Citation2007).
The mass-mobility relationship, and thus the effective density, of the soot particles for all sources and conditions tested could be described by a power law function (EquationEquations (2) and Equation(3)
), with Pearson's correlation coefficients of 1.00. The power law functions fitted to each soot type are presented in Table 2. The exponents describing the change in mass over dm were similar for all sources, despite the variation in size of the soot distributions and absolute effective densities, ranging from 2.2 to 2.4. One exception was heavy-duty diesel exhaust at idling with an exponent of 2.6. This was also the condition for which the effective density of the emitted particles deviated most from a power law function (). The results are in fairly good agreement with those reported previously for soot from a heavy duty engine of 2.3–2.4 (Park et al. Citation2003), for the emissions from a light-duty vehicle of 2.22–2.48 (Olfert et al. Citation2007), for diesel exhaust and premixed charge compression ignition combustion of 2.3–2.5 (calculated from effective densities given in the publication) (Barone et al. Citation2011), and for those found for flame generated soot of 2.20 (Xue et al. Citation2009), using the same experimental setup as in this study (DMA-APM). In the study by Maricq and Ning (Citation2004), similar exponents were also found (2.15–2.3) using a setup with a DMA and an electrical low-pressure impactor.
The highest effective densities were found for the particles in the exhaust from the heavy-duty engine at idling. For this operation cycle, the emitted particles’ volatile content was high with a substantial organic coating, as discussed in Sections 3.2 and S4 in the SI. By filling the external voids of the soot agglomerate, the coating will increase the effective density. This observation is similar to that made in the study by Olfert et al. (Citation2007), where a diesel fuel with a higher sulfur content was used, leading to sulfuric acid condensing onto the soot particles at high loads (light-duty vehicle) and possible restructuring (Xue et al. Citation2009; Pagels et al. 2009). Similar effects of coating were also reported for emissions from a heavy-duty diesel engine, where slightly higher effective densities were observed at lower loads (Park et al. Citation2003). In the latter study, a nucleation mode was present at the lowest load suggesting that material had also been condensing onto the soot structures.
The flame soot showed the lowest effective densities observed. When correcting for doubly charged particles in the DMA-APM data analysis, the two burner settings resulted in particles of essentially the same effective densities ( and Table S2). This implies that the larger agglomerates in the case of the lowest air-to-fuel ratio were mainly grown by coagulation due to the higher concentrations of primary particles generated. This is in agreement with our previous findings using a diffusion burner of a similar design (Malik et al. Citation2011a). For the candle, the nucleation mode dominated the particle number distribution as far up in size as around 75 nm. Therefore, in deriving the mass-mobility relationship for the soot mode, only particles >100 nm were included.
A strong correlation was found between dpp and ρeff, with a Pearson's correlation coefficient (r2) of 0.987 for effective densities of the 100 nm particles, based on the parameterized ρeff and using the number weighted CMDs of the dpp distributions. Using the mass weighted CMDs of dpp, the correlation was even stronger (r2 = 0.996).
Thus, the K parameters (defined in EquationEquations (2) and Equation(3)
) fitted to each type of soot and setting, were expected to correlate with the CMDs of dpp of each soot type. However, a small difference in the fitted exponent strongly affects the fitted K and no clear correlation was found. We instead set the exponent to a fixed value of 2.31 (the average value of the fitted exponents, ϵm), and fit only the K parameter for each dataset. Then a correlation between K and CMD of the primary particle size distributions was found, with a Pearson's correlation coefficient (r2) of 0.94 using the number weighted CMD. The relation between K and dpp can be easily described by the equation
where dpp is in meters (m). The relation between K and dpp, using the CMD of the mass weighted distributions of dpp is described by:
The correlation using the mass weighted CMDs of the primary particles size distribution was slightly higher (r2 = 0.97). The fitted equation is a modification of the relations found in two of the approaches described in section 4 (Equations (10) and (13)).
For studies where no information about the particle mass-mobility relationship or effective density is available, a relatively simple TEM image analysis can be used for the estimation of dpp. The K parameter can be achieved by inserting the CMD for dpp in EquationEquation (6) or Equation(7)
. The mass-mobility relationship and effective density is then achieved by inserting the K value, together with an exponent (ϵm) set to 2.3 into EquationEquations (2)
and Equation(3)
. This approach is applicable for freshly emitted soot agglomerates with coating mass fractions of <10%. Furthermore, using Equation (S5) the dynamic shape factor can be derived.
We found two parameters that alter the effective density: the primary particle size and the coating mass fraction. Agglomerates with smaller dpp have lower ρeff, while coating increases the effective density. Other factors that alter the effective density are bridging between primary particles, soot core restructuring, and the density of the primary particles. Since the graphene layers in soot structure were similarly distanced, the inherent density of the primary particles was considered to be similar for all the sources and operating conditions investigated.
3.7. Mass Weighted Size Distributions and Mass Apparent Densities
The particle mass size distributions were estimated by combining the SMPS data with the measured size-dependent effective density. The mass weighted GMD, presented in , ranges from 70 to 870 nm. In mass concentration, the nucleation mode was negligible for all sources and conditions studied. For candle smoke, the mass peak of the emitted particles was not covered by the SMPS and the mass distribution was determined from the fitted lognormal number size distribution.
Estimating the particle mass size distributions assuming a constant density as a function of size would result in larger GMDs than those estimated using measured effective density. This is because for spheres, m ∝ d3, while for the soot agglomerates, m ∝ d2.3. Using the heavy-duty engine transient cycle as an example, the GMD is shifted by 26%.
When no information about the particle effective density is available, often a fixed (average) apparent density, ρapp, is used for the whole number size distribution when converting the number mobility size distributions into particle mass concentration <1000 nm (PM1) according to:
where Vm is total particle volume derived from the SMPS distribution assuming spherical particles. Thus, the average ρapp may be derived from the number size distributions and total particulate mass, for example measured with a TEOM, if available.
From the measured number size distributions (by SMPS), ∫Vm was calculated summing the volume in each size channel calculated assuming spherical particles. In our case, we had access to the size-dependent effective density from the DMA-APM, so PM1 was derived by combining the mobility number size distributions with the size-dependent effective densities. Note that DMA-APM is not necessary but PM1 from TEOM or gravimetric analysis can be used as input. Using the relation in EquationEquation (8), ρapp was determined for each soot type. The resulting apparent densities are presented in . Similar estimations were carried out in other studies based on the PM from gravimetric or TEOM measurements (Pitz et al. Citation2003).
The mass-apparent density varied considerably from source to source – from 0.15 g/cm3 (Candle) to 0.53 g/cm3 (heavy-duty idling), see . This variation is in practice explained by the exponentially decreasing effective density of the soot agglomerates with increasing dm. The mass-apparent density was mainly determined by the GMD of the mass size distribution: the larger the GMD, the lower the apparent density. Again, the heavy-duty engine idling was an exception. This is explained by the fact that the effective density of these particles did not decrease as much with increasing size as it did for the other types of soot particles. This highlights the importance of having information about the size-dependent effective densities when converting number mobility size distributions into mass distributions or PM1, in the case of freshly emitted soot particles.
4. COMPARISON TO MODEL APPROACHES
4.1. Theory
Three model approaches that describe the relationship between Npp, dm, and dpp were applied and compared to our DMA-APM dataset on soot. To do so, the measured mass per agglomerate needs to be converted into the number of primary particles per agglomerate. In the conversion, the following assumptions were needed: (1) that the primary particles of the agglomerate are in point contact and (2) that the density of the primary particles (ρpp) are similar for all soot types, here assumed to be 1.8 g/cm3. The density assumption is based on the studies of Dobbins (Citation2002), Mullins and Williams (Citation1987) and Park et al. (Citation2004). The ρpp was assumed to be the same for the dataset collected, based on the similar lattice spacing found for all types of soot particles. Based on the first assumption, the number of primary particles per agglomerate is then given by (Bladh et al. Citation2011; Rissler et al. Citation2012):
4.1.1. The Sorensen Approach
Sorensen (Citation2011) concludes that in the continuum and transition regimes the mobility diameter of an agglomerate particle is directly proportional to dpp, and related by a power law to the number of primary particles of the agglomerate, for agglomerates formed by Diffusion Cluster Limited Aggregation. In the slip transition regime (0.1 < Kn < 10) the following relation between dm, dpp, and Npp is given:
where x in Sorensen (Citation2011) is suggested to be described by x = 0.51·Kn−0.043 (note the minus sign missing in Sorensen [2011]). EquationEquation (10)
can be written in the same form as EquationEquation (2)
(using the relations in EquationEquation (9)
). The resulting mass-mobility exponent (in EquationEquation (2)
referred to as ϵm) is 2.17 (1/0.46) for Npp < 100, and for Npp > 100 it asymptotically approaches 1.79. Plotting the mass-mobility relationship logarithmically results in a linear relation for Npp < 100, while for Npp > 100 the slope decreases with increasing mobility diameter ().
4.1.2. The Lall and Friedlander Approach
Based on the Monte Carlo simulations performed by Chan and Dahneke (Citation1981) for the drag on the basic chain units, the total drag on the aggregate was estimated by adding the drag over all primaries in the straight chain aggregate. Combined with the expression of the friction coefficient of spheres, the following relation was derived in Lall and Friedlander (L & F) (Citation2006), valid for agglomerates of fractal dimensions <2 and Npp > 12:
where λ is the mean free path and c* the dimensionless drag force. For randomly oriented agglomerates c* is set to 9.17, while if the orientation of the agglomerates is parallel to the electrical field of the DMA, it is set to 6.62 (Wang and Friedlander Citation2007). In deriving this equation, a few assumptions were made (Lall and Friedlander Citation2006), whereof one is that the aggregates are “transparent,” in the sense that all surfaces are directly exposed to collisions with molecules from the surrounding gas at an equal rate.
4.1.3. The Modified Schmidt-Ott Approach
In 1988, Schmidt-Ott (S-O) (Schmidt-Ott Citation1988) presented data and a theory showing that silver agglomerates were described by a power law function according to:
If the radius of gyration is linearly proportional to dm it follows that the exponent, Dfm, is the true mathematical fractal dimension of the agglomerate particle. This was stated in Schmidt-Ott et al. (Citation1990), but proven wrong in Sorensen (Citation2011). EquationEquation (13)
was fitted to our dataset, resulting in a constant C of 0.87 and of Dfm 2.34. Note that this approach should not be strictly referred to as a theoretical approach since the above equation was derived using an erroneous assumption. Yet, the equation has been used in several studies successfully describing the DMA-APM datasets.
EquationEquation (13) is very similar to the power law function suggested by Sorensen (Citation2011). Two differences are the constant C introduced by Schmidt-Ott (by Sorensen set to 1), and that the exponent is fitted to the dataset for the S-O approach while kept fixed to 2.17 (Npp < 100) in the Sorensen approach. Using the relation in EquationEquation (9)
, it can be seen that EquationEquation (13)
is also very similar to the expressions used describing the dataset here presented (EquationEquation (2)
and (6)).
4.2. Model Results
In both the Sorensen and S-O approaches, the dm/dpp ratio is independent of dpp when plotted as a function of Npp (dm/dpp(Npp)), see . This is close to the behavior found of the characterized soot agglomerates. For illustration, the Npp based on the DMA-APM measurements were divided into two groups: Group 1 is agglomerates with primary particles of 11–13 nm and Group 2 of 24–28 nm. dpp for the different soot types are specified in . Candle smoke particles are the particle type that differ the most in this sense. For the L & F approach, the ratio dm/dpp(Npp) is dependent on dpp. Therefore, in the Figures (7 and 8) this approach is plotted for agglomerates of primary particle sizes 12 and 26 nm (the average dpp of the two groups of agglomerates observed). For Npp > 100 the Sorensen approach results in a weak dependence of dm/dpp on dpp due to x varying with Kn.
In the approach suggested by L & F, two different assumptions can be made: either that agglomerates are randomly oriented, or that they are aligned in the electrical field of the DMA. The latter assumption results in a lower dm/dpp ratio as a function of Npp. Thus, aligned agglomerates fit better with the DMA-APM data, as illustrated in . This study shows that at the DMA settings used, agglomerates >240 nm align in the DMA, while 100 nm ones do not (Section 2.3.2).
The S-O equation well describes the behavior of Npp (and accordingly also effective density or mass) as a function of both dm and dpp. However, both the exponent, Dfm, and the constant, C, in EquationEquation (12) describing Npp were fitted to the Npp derived from the DMA-APM dataset (C = 0.87 and Dfm = 2.34). The equation suggested by Sorensen also describes Npp relatively well, with the advantage that no fitting is necessary. In the Sorensen approach the predicted Npp is closer to the measured ones for low Npp: for Npp < 100 it was typically within 20%. However, it is worth noting that introducing the constant C, as in the S-O approach, does increase the agreement to the dataset.
In the Sorensen approach the exponent describing the mass-mobility relationship is kept fixed for Npp < 100, while for Npp > 100 it increases with increasing Knudsen number. As a reference, an Npp of 100 corresponds to a mobility diameter of 83 nm for dpp 12 nm and 193 nm for dpp 26 nm (based on the empirically derived parameterization of this study). Comparing the output of the model with the data, the exponent does not seem to decrease with increasing dm, as predicted in the Sorensen approach for Npp > 100 (). Instead, it seems that one fixed exponent better describes the data, at least up to Npp = 1000. This is particularly clear for the soot with low dpp, for which the Npp range covered is substantially larger than 100. The agglomerate alignment in the DMA electrical field lead to an underestimation of dm for the agglomerates selected. The effect of agglomerate alignment comes into account only for large agglomerates. According to the quantification of the effect made here, this could only explain a minor fraction of the deviation between our measurements and EquationEquations (10) or (11).
The model showing the largest deviation from DMA-APM data is that suggested by L & F. For agglomerates with a low number of primary particles, the L & F approach can predict the number of primary particles of the agglomerates relatively well (Figures and ), also shown by Eggersdorfer et al. (Citation2012) for flame-made ZrO2 aerosols. However, for increasing agglomerate size the model does not describe the observed behavior. One explanation can be the fact that in this approach the drag force on the agglomerate is assumed to be the sum of the drag forces on the individual primary particles. Thus, the effect of shielding of neighboring primaries is neglected, which could lead to an overestimation of the drag force and dm for an agglomerate particle of a specific Npp. The shielding increases with an increasing number of primaries of the particle, and thus the model deviates more from measurements with increasing size. A further explanation of the observation is the difference in determination of the drag regime from the original theory presented in Chan and Dahneke (Citation1981), as also was suggested in Eggersdorfer et al. (Citation2012).
Generally, the models predict a lower number of primary particles or monomers of the agglomerates compared to that measured. Part of this deviation can be explained by agglomerates aligning in the electrical field of the DMA, but only to a minor degree and for large agglomerates. From TEM images of soot agglomerates, observations of bridging between the primary particles of the soot agglomerates have been made, both in this study and in general. This would, when estimating Npp from the measured agglomerate mass, lead to an overestimation of the number of primary particles, possibly also explaining part of the deviation. As a reference, assuming the extreme case that two adjacent primary particles are fully connected by a bridge of the same diameter as that of the primary particles, and assuming on average two neighboring primary particles, 33% of the mass would constitute the “bridge.”
Finally, another issue in comparing the modeled and measured mass or Npp is that introduced by the dpp frequency distribution. In real life, the agglomerates are never composed by monomers of one size, but of a distribution of sizes. Due to the broadening of the frequency distribution of the monomers, the average dpp can be achieved in different ways, with slightly different results. In this study, the mass weighted CMDs are larger than the number weighted ones by ∼30% (). In the models, the number weighted CMDs should be used when estimating Npp. However, when converting the agglomerates’ mass determined by the APM to Npp, or vice versa, it would be more accurate to use the CMDs for the mass weighted distributions of dpp. Using mass weighted CMDs would result in a lower Npp by approximately 50%. Using this number and comparing it to the modeled one, the Sorensen approach well describes the Npp for large Npp but is worse for low Npp.
5. SUMMARY
The soot particle mass-mobility relationship, and thus the effective density as a function of dm, was well described by a power law function with exponents ranging from 2.2 to 2.4, with an average of 2.3. One exception was the exhaust from a heavy-duty engine at idle with an exponent of 2.6, for which the particle volatile organic content was considerably larger than for the other soot types characterized. For all other sources and conditions tested, the volatile fraction of the soot agglomerates was ∼5–10% of the particle mass. The exponents found were similar to those found in the literature for both diesel soot and that of diffusion burners measured using the DMA-APM system of 2.1–2.5 (Park et al. Citation2003; Olfert et al. Citation2007; Xue et al. Citation2009). The particle specific SA ranged from 100 to 260 m2/g.
Despite the similar exponents describing the size dependence of the effective densities of the different sources studied, the absolute effective densities varied considerably. There were two parameters found to alter the effective density: the primary particle size and the coating mass fraction. Excluding the case of heavy-duty engine idling, for which the particle coating was considerable, a clear correlation was observed between dpp and effective densities. Other factors altering the effective density are bridging between primary particles and the density of the primary particles. Since the soot particles investigated here had similarly distanced graphene layers, the inherent density of the primary particles was considered to be similar, regardless of source and setting.
In many situations dpp may be known from TEM while direct measurements of size dependent mass/effective density (by for example DMA-APM) may not be available. Since dpp is found to correlate with the mass or effective density, we suggest the use of an empirically derived formula based on the soot dataset to describe mass/effective density as a function of mobility size for freshly emitted soot agglomerates.
An alternative way would be to determine the mass, effective density or number of primary particles per agglomerate and as a function of mobility size from models. Today, there is no consensus as to which model should be used. We here compared three model approaches that describe the agglomerate particle mass-mobility relationship with DMA-APM measurements. We found that the commonly used L & F model approach (Lall and Friedlander Citation2006) seriously underestimates the mass concentration of agglomerates above 100 nm, while much better agreement was found when using the equations by Sorensen (Citation2011). We see that the mass-mobility relationship is better described by an exponent of 2.3, which is higher than the exponent suggested by Sorensen of 1.8–2.2, and that the exponent does not seem to vary in the interval covered by the measurements (Npp < 1000) as was also suggested.
The DMA-APM was used to investigate the agglomerate alignment in the DMA electrical field. For 100 nm particles, no alignment could be observed, while for 240 nm the alignment was significant at electrical fields >1500 V/cm. The agglomerate alignment caused a size shift determined to 8%. Considering only singly charged particles during the analysis of the DMA-APM data, in most cases, introduces minor errors in the particle mass of typically less than 5%. The errors introduced are small especially when performing measurements for sizes larger than the GMD of the number size distribution. However, when studying particles of diameters smaller than the GMD of the number size distribution, the effect of doubly charged particles may be larger, especially for distributions peaking at >200 nm. In this study, the mass correction when taking into account the doubly charged particles was at most 17%.
Supplemental Information.zip
Download Zip (185.5 KB)The following organizations are gratefully acknowledged: The Swedish Research Council for Environment, Agricultural Sciences and Spatial Planning (FORMAS) through projects 2008-1467, 216-2009-1294, and 2010-1678; the Swedish Governmental Agency for Innovation Systems (VINNOVA) through project 2009-01117; the METALUND Swedish Council for Working Life and Social Research (FAS) Centre; the European Union through the FP7 GREENSYNGAS project; and Program SFC-B4G of the Swedish Energy Agency.
[Supplementary materials are available for this article. Go to the publishers online edition of Aerosol Science and Technology to view the free supplementary files.]
REFERENCES
- BarathS.MillsN.L.LundbackM.TornqvistH.LuckingA.J.LangrishJ.P.et al.2010719
- BaroneT.L.LallA.A.StoreyJ.M. E.MulhollandG.W.PrikhodkoV.Y.FranklandJ.H.et al.201125519781988
- BladhH.JohnssonJ.RisslerJ.AbdulhamidH.OlofssonN.E.SanatiM.et al.20111042331341
- ChanP.DahnekeB.19815231063110
- CorbettJ.J.FischbeckP.19972785339823824
- DeCarloP.F.SlowikJ.G.WorsnopD.R.DavidovitsP.JimenezJ.L.2004381211851205
- DobbinsR.A.20021303204214
- DonaldsonK.SeatonA.20129113
- DonaldsonK.TranL.JimenezL.A.DuffinR.NewbyD.E.MillsN.et al.2005210
- EgertonR.F.LiP.MalacM.2004356399409
- EggersdorferM.L.GröhnA.J.SorensenC.M.McMurryP.H.PratsinisS.E.201238711223
- GellerM.BiswasS.SioutasC.2006409709723
- GhaziR.OlfertJ.S.201347192200
- GhaziR.TjongH.SoewonoA.RogakS.OlfertJ.S.201346395405
- GiechaskielB.AlfoldyB.DrossinosY.2009408639651
- HapponenM.LahdeT.MessingM.E.SarjovaaraT.LarmiM.WallenbergL.R.et al.2010891240084013
- IPCC Fourth Assessment ReportClimate Change 2007 Cambridge University Press Cambridge, United Kingdom and New York, NY 2007
- KahnertM.DevasthaleA. 2011 11221174511759
- KuB.K.KulkarniP. 2012 47100110
- LallA.A.FriedlanderS.K. 2006 373260271
- LallA.A.RongW.MadlerL.FriedlanderS.K. 2008 39403417
- MalikA.AbdulhamidH.PagelsJ.RisslerJ.LindskogM.NilssonP.et al. 2011a 452284294
- MalikA.NilssonP.PagelsJ.LindskogM.RisslerJ.GudmundssonA.et al. 2011b 25417511758
- MaricqM.M. 2007 381110791118
- MaricqM.M.NingX. 2004 351012511274
- McMurryP.H.WangX.ParkK.EharaK. 2002 362227238
- MessingM.E.SvenssonC.R.PagelsJ.MeullerB.O.DeppertK.RisslerJ. 2012 DOI: 10.3109/17435390.2012.697589, early online, 1–12
- MullerJ.O.SuD.S.JentoftR.E.KrohnertJ.JentoftF.C.SchloglR. 2005 102259265
- MullerJ.O.SuD.S.WildU.SchloglR. 2007 93040184025
- MullinsJ.WilliamsA. 1987 662277280
- NordinE.Z.ErikssonA.C.RoldinP.NilssonP.T.CarlssonJ.E.KajosM.K.et al. 2012 123172531765
- OlfertJ.S.SymondsJ.P. R.CollingsN. 2007 3816982
- PagelsJ.DutcherD.D.StolzenburgM.R.McMurryP.H.GaelliM.GrossD.S. 2013 118859870
- PagelsJ.KhalizovA.F.McMurryP.H.ZhangR.Y. 2009a 437629640
- PagelsJ.WierzbickaA.NilssonE.IsaxonC.DahlA.GudmundssonA.et al. 2009b 403193208
- ParkK.CaoF.KittelsonD.B.McMurryP.H. 2003 373577583
- ParkK.KittelsonD.B.ZachariahM.R.McMurryP.H. 2004 62–3267272
- PengR.D.BellM.L.GeyhA.S.McDermottA.ZegerS.L.SametJ.M.et al. 2009 1176957963
- PitzM.CyrysJ.KargE.WiedensohlerA.WichmannH.E.HeinrichJ. 2003 371943364342
- RisslerJ.PagelsJ.SwietlickiE.WierzbickaA.StrandM.LilliebladL.et al. 2005 3910919930
- RisslerJ.SvenningssonB.ForsE.O.BildeM.SwietlickiE. 2010 115DOI: 10.1029/2010JD143910
- RisslerJ.SwietlickiE.BengtssonA.BomanC.PagelsJ.SandstromT.et al. 2012 481833
- RogakS.N.BaltenspergerU.FlaganR.C. 1991 144447458
- Schmidt-OttA. 1988 195553
- Schmidt-OttA.BaltenspergerU.GägglerH.W.JostD.T. 1990 216711717
- ShinW.G.MulhollandG.W.KimS.C.WangJ.EmeryM.S.PuiD.Y. H. 2009 407573587
- ShinW.G.MulhollandG.W.PuiD.Y. H. 2010 41665681
- SorensenC.M. 2011 457765779
- StankovichS.DikinD.A.PinerR.D.KohlhaasK.A.KleinhammesA.JiaY.et al. 2007 45715581565
- SvenningssonB.RisslerJ.SwietlickiE.MirceaM.BildeM.FacchiniM.C.et al. 2006 619371952
- UNEP and WMOIntegrated Assessment of Black Carbon and Tropospheric Ozone: Summary for Decision Makers UN Environment Program & World Meteorological Association 2011 ISBN: 978-92-807-3142-2
- VirtanenA.K. K.RistimakiJ.M.VaaraslahtiK.M.KeskinenJ. 2004 38925512556
- WangC.-S.FriedlanderS.K. 2007 389980987
- WHOHealth Effects of Black Carbon World Health Organisation Europe 2012
- XueH.X.KhalizovA.F.WangL.ZhengJ.ZhangR.Y. 2009 43827872792
- ZelenyukA.ImreD. 2007 41112124