
Abstract
MonteCarlo simulations of diffusive particle trajectories, as well as Stolzenburg's model calculations, have shown that the mean mobility of the particles classified by a differential mobility analyzer (DMA) at a given applied voltage may differ from the theoretical one inferred from the Knutson–Whitby equation if the particles are withdrawn from the tails of the particle mobility distribution. In this case, the true mean mobility, defined as the mean mobility of the particles classified at the specified voltage, can be precisely measured by a second DMA operating in series with the first one (tandem DMA). However, if particles are extracted from the central part of the distribution, their mobility can be correctly measured with a single DMA. Besides showing the importance of the usage of the tandem DMA technique for accurate measurements of mobility, this article provides an analytical expression which, if the mobility distribution of the polydisperse aerosol fed to the DMA is known, allows an accurate estimation of the true (mean) mobility of the classified particles.
Copyright 2014 American Association for Aerosol Research
INTRODUCTION
The differential mobility analyzer (DMA) is widely used to measure the aerosol electrical mobility distribution, from which the corresponding particle diameter distribution can be derived, and also to generate a continuous stream of monodisperse particles of a desired size from a population of polydisperse particles. Indeed, the production of calibrated monodisperse aerosol with mean diameters below 50 nm has become a basic tool to determine the physical properties of the particles by studying their behavior in a variety of physical processes (e.g., filtration, coagulation, condensational growth, electrical properties, etc.). The most critical application of DMA selection will probably be the production of accurately calibrated monodisperse nanoparticles below 5 nm, since their properties are size dependant in this size range.
The particle mobility is customarily calculated from the electric field applied to the DMA by means of the well-known Knutson-Whitby equation (Knutson and Whitby Citation1975a). In a recent work (Alonso et al. Citation2013), it has been shown that this equation is not strictly correct for highly diffusive particles classified in too long DMAs operating at very low flow rates. However, under common circumstances in which a properly selected DMA is operated under suitable conditions, the Knutson–Whitby equation is quite accurate. In spite of its general validity, its use under standard DMA operating conditions may result in measurement errors as the following illustrative example shows.
![FIG. 1. Illustration of DMA sizing error. When a voltage V1 is applied to the DMA, particles from the tail of the aerosol population with mobilities in the common region under the original distribution f0(Z) and the transfer function Ω(V1, Z) are classified/detected. A mobility Z1(V1), given by EquationEquation (1)[1] , is assigned to these particles in spite that there are no particles with such a high mobility in the aerosol population.](/cms/asset/7661f400-0970-4b0d-93b5-dc7cafc2075e/uast_a_973931_f0001_oc.jpg)
Consider an aerosol population whose mobility distribution is given by the curve labeled as f0(Z) shown in . Suppose now that a voltage V1 is applied between the DMA electrodes, such that the transfer function is given by the curve shown as Ω(V1, Z). The transfer function is the probability that a particle of mobility Z is classified when the applied voltage is V1. The transfer function presents a maximum for a mobility Z1 given by the Knutson–Whitby equation
[1] in the common case in which the DMA is operated under balanced flow conditions, i.e., equal flow rates of sheath and excess air, denoted by Qsh in the above equation. In (1), L is the DMA length, and R1 and R2 the radii of the inner and outer electrode, respectively. Since in the shown example the transfer function peak mobility falls outside the range of available mobilities in the aerosol, neither the mean nor the peak mobility of the particles extracted at voltage V1 can be equal to Z1. The reason why some particles are withdrawn in spite that the applied voltage is too low is that the DMA transfer function has a certain finite width with mobilities between Z1 − ΔZ1 and Z1 + ΔZ1, where ΔZ1 = Z1Qa/Qsh for ideal, nondiffusing particles (Qa is the inlet aerosol flow rate, equal to the classified aerosol flow rate in the case of balanced flows). When particle diffusion cannot be neglected, the transfer function width is even larger than that determined from the above ideal expression (Stolzenburg Citation1988) and, therefore, the possibility of classifying particles with mobility very different from Z1 is significantly increased.
In contrast with the example illustrated in , in a practical situation the experimenter does not know the mobility distribution of the aerosol. Therefore, he will, at least in principle, assume that the mean mobility of the particles classified at voltage V1 is Z1. The present article shows how this error can be corrected: the true (mean) mobility of the classified particles can be accurately determined using a second DMA connected in series with the first unit (that this is indeed the case is a direct consequence of the fact that, as shown by Knutson and Whitby (Citation1975b), the DMA allows accurate determination of the moments of the mobility distribution).
METHODS FOR THE CALCULATION OF THE TRUE MOBILITY
In order to generate a continuous stream of (quasi-)monodisperse particles from a polydisperse aerosol population, a fixed voltage V1 is applied to the DMA. As already explained, the mobility of the withdrawn particles is expected to be given by EquationEquation (1)[1] above, but we have qualitatively shown how the true (mean) mobility of these particles may be different from the theoretical one. This error not only happens when the applied voltage lies outside the nominal range (by nominal range it is meant the range of V1 values for which EquationEquation (1)
[1] leads to mobilities available in the aerosol population). Sizing errors may also arise whenever the mobility of the target particles lies close to the tails of the distribution, especially the tail of highest mobility.
As stated above, one of the objectives of this work is to demonstrate that the true mean mobility of the classified particles can be experimentally determined using a second DMA connected in series with the first one. To do this, the voltage V2 applied to DMA-2 is scanned while keeping constant the voltage V1 applied to DMA-1. Ideally, it is expected that when two identical DMAs connected in series are operated under the same conditions, the mean classification voltage for the second unit should coincide with the fixed voltage applied to the first unit. However, for diffusive particles withdrawn from the tails of the original distribution it turns out that, in general,
(Alonso and Kousaka Citation1996; Zhang and Flagan Citation1996). In these past experiments, it was shown that
only when the particles are extracted near the peak of the distribution. Our assertion is that the true mean mobility of the particles classified by the first DMA is correctly given by
[2] In other words, the true mobility can be determined with the Knutson–Whitby equation, but using the mean classification voltage obtained for DMA-2 instead of the fixed voltage applied to DMA-1. The validity of this assertion will be proved by the results shown later, but can also be proved by simply noting that the moments of an aerosol mobility distribution can be accurately measured with a DMA (Knutson and Whitby Citation1975b): therefore, if one considers the particles classified by DMA-1 as the “problem aerosol,” then a second DMA allows accurate estimation of its first moment (mean). Note that EquationEquation (2)
[2] allows experimental determination of the true mobility by using a tandem DMA system.
Equations Governing the Operation of a Tandem DMA
Theoretical studies of the operation of a tandem DMA system have been done by Rader and McMurry (Citation1986) and Stolzenburg and McMurry (Citation2008). In the latter, the authors considered a typical experimental setup starting with a particle charger, one or two DMAs, and a particle counter at the end of the line; they also considered the possible existence of an aerosol conditioner between the two DMAs. Their quantitative analysis took into account the particle size-dependent charging efficiency of the charger as well as the counting efficiency of the particle counter, also a function of particle size. In their work, the mobility (or particle size) distribution of the original aerosol was unknown: in fact, one of the purposes of that work was to determine it using the data gathered from experimental measurements.
In contrast, we will assume a known mobility distribution at the inlet of the first DMA. Furthermore, to be more specific, we will consider a lognormal mobility distribution for the aerosol: the number fraction of particles with mobility in the range (lnZ, lnZ + dlnZ) is then given by
[3] where Zg0 is the geometric mean mobility and σg0 the geometric standard deviation. In the rest of the article, this will be referred to as the original or input aerosol mobility distribution.
It should be noted that, in practice, most of the laboratory-generated aerosols follow a lognormal distribution in terms of particle diameter. For relatively large particles, for which the Cunningham's slip correction factor is unity, mobility and particle diameter follow a simple relationship of the form Z = kp/Dp, where k is a constant and p is the number of elementary charges on the particle; in this case, f(lnZ) = f(lnDp)|dlnDp/dlnZ| = f(lnDp), and hence the mobility distribution is also lognormal. However, for small particles the slip correction factor is a function of particle diameter, C = 1 + (2λ/Dp)[a0 + a1exp( − a2Dp/2λ)], where λ is the mean free path of gas molecules, and the ai are constants. In this case, although strictly not lognormal, it can be shown that mobility distributions calculated numerically from lognormal particle diameter distributions can be fitted almost perfectly by means of a lognormal distribution.
When DMA-1 is operated at a fixed voltage V1, the number fraction of particles with mobility in the range (lnZ, lnZ + dlnZ) which are withdrawn through the classification slit is
[4] where Ω is the DMA transfer function, i.e., the probability that a particle of exact mobility Z is classified when a potential difference V1 is established between the electrodes.
The true mean mobility of the classified particles can then be calculated as
[5] A prime has been added to the true mobility in order to distinguish it from the Z1, true calculated with EquationEquation (2)
[2] . In principle, these two values need not coincide between each other and, furthermore, they do not necessarily coincide with the one calculated from (1). Instead of taking the arithmetic mean value as the true mobility one could use as well the geometric mean; the numerical values of both means do not differ much from each other. For simplicity, we have adopted the use of the arithmetic mean (5) throughout this work.
The particles classified at fixed voltage V1 are then admitted into DMA-2, geometrically identical to DMA-1 and operated under the same flow rates. Diffusion losses between the classification slit of DMA-1 and the inlet aerosol slit of DMA-2 will be neglected. Within this approximation, the number fraction of particles of any mobility classified when the second unit operates at a voltage V2 can be calculated as
[6]
After successive voltages are applied to DMA-2 (maintaining V1 fixed), the mean classification voltage for DMA-2 can be calculated as
[7] The mobility corresponding to the mean classification voltage for DMA-2, given by EquationEquation (2)
[2] with
calculated with (7), will be compared with the true mean mobility of the particles classified by DMA-1 at voltage V1, calculated with (5).
Calculation of the Transfer Function
The DMA transfer function Ω(V, Z) (V = V1 for DMA-1, and V = V2 for DMA-2) has been calculated using two approaches: MonteCarlo simulation of particle trajectories, and Stolzenburg's analytical expression (Stolzenburg Citation1988; Stolzenburg and McMurry Citation2008).
The MonteCarlo simulation method used in the present work was originally developed by Hagwood et al. (Citation1999). While these authors considered diffusion along both the axial and radial directions, we have neglected axial diffusion because in the typical operation of a DMA the diffusive velocity in this direction is at least two orders of magnitude smaller than the air flow velocity. A complete description of the simulation procedure can be found either in the original paper (Hagwood et al. Citation1999) or in our previous work (Alonso et al. Citation2013), and will thus be omitted here. In the latter paper, it was demonstrated that the classical Knutson-Whitby expression (1) needs an additional correction term when the DMA is operated under rather extreme circumstances, e.g., particles with very high mobility (small ions) classified in too long cylindrical DMAs operated at low flow rates. This correction term is neglected in the present work because only “usual” conditions will be considered; under these normal conditions EquationEquation (1)[1] is correct.
Stolzenburg and McMurry (Citation2008) have given a lognormal approximation to the transfer function. Their nomenclature will be slightly modified in order to adequate it to the notation used in the present article. The lognormal approximation is
[8] where
[8a]
[8b]
In these expressions, β = Qa/Qsh is the aerosol-to-sheath flow rate ratio (we are only considering the case of balanced flows in this work), GDMA is a non-dimensional geometry factor, kT the mean thermal energy of the medium in which the particle is immersed, pe its electric charge, and D1 the diffusion coefficient of the particle of mobility Z1 (i.e., the central mobility of the transfer function). Expression (8) is valid for the first DMA, operated at fixed voltage V1. For DMA-2, operated at V2, the subscript “1” appearing in several places in (8) should be substituted by “2.”
Analytical Expression for the True Mean Mobility
Using the lognormal approximation (8), it is possible to arrive at an analytical expression for Z′1, true. Indeed, inserting (3), (4), and (8) into (5), the integrals can be reduced to the form , where a, b, c are constants. The solution of this integral is
for a ≠ 0. After elementary algebraic manipulations, the following result is obtained:
[9]
All the parameters relevant to the DMA operation are implicitly included in EquationEquation (9)[9] : the sheath air flow rate (in (8a)); the aerosol flow rate (through the parameter β); the DMA geometry (through (8b) but also through Z1, which is given by (1)); and the shape of the original mobility distribution (Zg0, σg0). Although all these parameters are interrelated in a complex manner, it will be seen that EquationEquation (9)
[9] reproduces remarkably well the MonteCarlo simulation results.
EquationEquation (6)[6] , expressing the number fraction of particles of any mobility classified when the second unit operates at a voltage V2, can also be expressed analytically using the lognormal approximation to the transfer function. The result is
[10] with
[10a]
[10b]
[10c]
[10d] In these equations, Z1 and Z2 are the Knutson–Whitby mobilities corresponding to voltages V1 and V2.
Unfortunately, however, an analytical expression for the mean classification voltage for the second DMA, , cannot be obtained from (7) and (10).
RESULTS AND DISCUSSION
shows a numerical example corresponding to the situation illustrated in , i.e., a case in which the voltage applied to DMA-1 is so small that the mobility calculated with (1) lies very close to the tail of the aerosol distribution f0. The mobility calculated with (1) is shown as Z1 in the plot. Four transfer functions calculated for this specific example are shown in the plot: the ideal, non-diffusive transfer function Ωnd (it does not appear as a triangle because of the log scale employed); the transfer function calculated with Stolzenburg's analytical model (the continuous curve denoted as Ω); the lognormal approximation (8) drawn as a dashed curve, which is very close to the rigorous Stolzenburg's model curve; and the transfer function calculated with the MonteCarlo particle trajectory simulation method (the dots that are in almost perfect agreement with Stolzenburg's Ω). Note: because the Montecarlo calculation requires quite a long computing time, the simulated transfer function has only been calculated for mobilities satisfying the condition f0(lnZ) > 10− 8; this is why there are dots missing in the right part (high mobility) of the Ω curve. The curve denoted as f1 is the number fraction of particles (divided by dlnZ) with mobility Z as calculated with EquationEquation (4)[4] ; the dots represent simulation results, the full line is the one calculated using Stolzenburg transfer function in (4), and the dashed line is the one obtained by using the lognormal approximation (8). As shows, the true mobility, denoted as Z1, true and calculated with EquationEquation (5)
[5] , is significantly different from the mobility Z1 inferred from (1): about 20% smaller!
![FIG. 2. Example of particle classification with a single DMA. f0 is the mobility distribution of the aerosol. Ωnd is the ideal transfer function for non-diffusive particles; Ω is the transfer function calculated by: Stolzenburg's model (solid line), MonteCarlo simulation (dots), and lognormal approximation (8) (dashed line); f1 is the fraction of particles of mobility Z classified at voltage V1 divided by dlnZ, calculated from EquationEquation (4)[4] using the transfer function calculated by: Stolzenburg's model (solid line), MonteCarlo simulation (dots), and lognormal approximation (8) (dashed line). The theoretical mobility directly inferred from the applied voltage and EquationEquation (1)[1] is denoted as Z1; the true mobility of the classified particles is shown as Z1, true. Data obtained for the Nano-DMA of Chen et al. (Citation1998) operated at Qa/Qsh = 2/20 (in lpm) and V1 = 12.6 V; aerosol mobility distribution: Zg0 = 0.25cm2/Vs (Dpg = 2.9 nm); σg0 = 1.2.](/cms/asset/1d661fc5-9cae-49fd-a7ec-4ba9e13a9466/uast_a_973931_f0002_oc.jpg)
The excellent agreement between simulation results and Stolzenburg's analytical model in has actually been observed in all the calculations performed in the course of this work, in spite that there is a fundamental difference between the two approaches: in contrast with Stolzenburg analysis, particle losses to the DMA walls are considered in the MonteCarlo simulations. It thus seems that diffusion losses are not so important in short DMAs operated under typical flow rates. However, former MonteCarlo simulations (Hagwood et al. Citation1999; Alonso et al. Citation2013) showed that the area under the curve of the numerical transfer function (i.e., its zeroeth moment) was smaller than the zeroeth moment for Knutson–Whitby and Stolzerburg's transfer functions, which is equal to β = Qa/Qsh in the case of balance flows, meaning that there were indeed particle losses to the DMA walls. However, these losses were observed only for very small particles (especially for those below 3 nm) classified with the TSI long column DMA (L = 44.44 cm) at low flow rates, 1 and 10 lpm for aerosol and sheath air. These rather unusual conditions have not been employed in the present work.
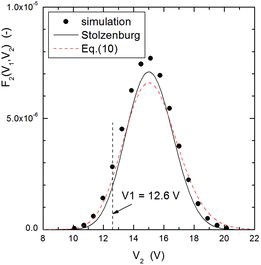
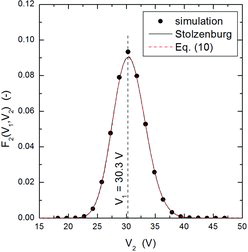
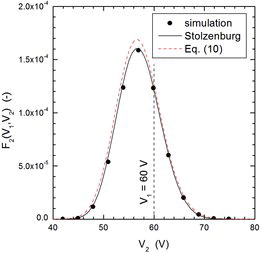
It is also important to point out that the lognormal approximation (8) to the transfer function is, more than an approximation, a rather accurate expression which leads to essentially correct results. This can be further observed in –, which show examples of particle classification by DMA-2 for three typical cases, one in which particles coming from DMA-1 were extracted from the high-mobility tail of the distribution (), the second one in which particles were extracted near the peak of the distribution (), and the third one in which particles were withdrawn from the low-mobility tail of the aerosol (). Although the agreement between simulation and Stolzenburg's model or its lognormal approximation is not as good as for DMA-1, the peak voltage calculated with the three methods agree very well among each other and, particularly, they depart considerably from the fixed voltage applied to DMA-1 (shown as dashed vertical lines in the three Figures) when particles coming from DMA-1 have been extracted from the tails of the mobility distribution. Voltage shifts between two DMAs operated in tandem configuration have been observed experimentally in the past (Alonso and Kousaka Citation1996; Zhang and Flagan Citation1996). Furthermore, in the first of these works it was shown that the ratio could be smaller or larger than 1 depending on whether particles were extracted, respectively, from the low- or high-mobility tail of the distribution, while the ratio was close to 1 when the particles were withdrawn from the central part of the distribution, in qualitative agreement with the results shown in these three plots.
shows a comparison between the true mobility of the DMA-1 classified particles calculated in two ways: (i) calculating the mean mobility directly from the mobility distribution of the classified particles, i.e., using EquationEquation (5)[5] (Z′1, true), and (ii) inferring the mobility from DMA-2 measurements, that is, using EquationEquation (2)
[2] (Z1, true). The second approach thus employs the Knutson–Whitby equation, not with the value of the voltage applied to DMA-1 (as an unwarned experimenter would do), but with the mean voltage obtained from DMA-2 measurements. The data points in are simulation results obtained for the Nano-DMA of Chen et al. (Citation1998) and the Vienna DMA of Reischl (Winklmayr et al. Citation1991), operated at flow rate ratios of 1/10 and 2/20, for values of Zg0 of 0.20 and 0.25 cm2/Vs (equivalent particle diameter of 2.9 and 3.3 nm) and several values of σg0 between 1.1 and 2.0. For a given set of conditions, the DMA-1 was operated at 10–15 different values of the voltage V1; for each value of V1 the voltage in DMA-2 was scanned so as to compute the mean DMA-2 voltage using EquationEquation (7)
[7] . The thus obtained mean voltage
was then used to calculate, with EquationEquation (2)
[2] , the corresponding mobility. As seen, both approaches lead to essentially the same results, and this means that the true mobility of the particles classified when a voltage V1 is applied to DMA-1 can be accurately obtained experimentally from measurements done with the second DMA, i.e., Z′1, true ≈ Z1, true. The corresponding results obtained from the analytical model of Stolzenburg were nearly identical to those shown in , but they have not been included in the plot in order to preserve clarity.
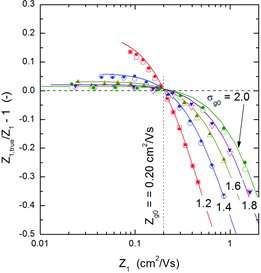
– show the magnitude of the measurement errors that can arise if particles are withdrawn from the tails of the distribution. and present results obtained for the Nano-DMA of Chen et al. (Citation1998), and those obtained for the Vienna type DMA (Winklmayr et al. Citation1991), using a slightly smaller mean mobility for the input distribution. The plotted results were obtained by three methods: MonteCarlo simulation, Stolzenburg's model, and the analytical expression (9). The agreement among the three methods is quite fair.
![FIG. 6. Comparison between the true mobility of particles classified by DMA-1 calculated from MonteCarlo simulations by two approaches, using (i) EquationEquation (5)[5] (y-axis), and (ii) EquationEquations (2)[2] and Equation(7)[7] (x-axis). Data obtained for the Nano-DMA (triangles: Qa/Qsh = 1/10; squares: 2/20) with Zg0 = 0.25 cm2/Vs and σg0 between 1.1 and 1.8; and the Vienna type DMA (circles) operated at Qa/Qsh = 2/20, with Zg0 = 0.20 cm2/Vs and σg0 between 1.2 and 2.0.](/cms/asset/fcd849bc-00d8-4cb1-b2db-ca0959475f27/uast_a_973931_f0006_oc.jpg)
![FIG. 7. Comparison between the mobility calculated with EquationEquation (1)[1] and the true mobility of particles classified with a DMA. Nano-DMA operated at a flow rate ratio of 1/10. The MonteCarlo simulation results are represented by open symbols; those obtained using the rigorous (i.e., not the lognormal approximation) transfer function of Stolzenburg are plotted with solid symbols. The solid curves were calculated using EquationEquation (9)[9] . The aerosol had a mean geometric mobility of 0.25 cm2/Vs (mobility-equivalent particle diameter of 2.9 nm) and the geometric standard deviations shown in the plot.](/cms/asset/0fcc0cd2-0d8a-4911-bef9-fb151bab1e2e/uast_a_973931_f0007_oc.jpg)
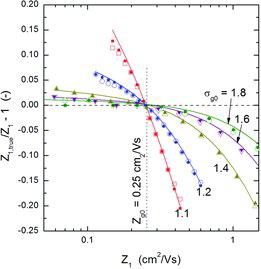
Several general trends are observable from –: (i) The true mean mobility Z1, true (≈ Z′1, true) of the classified particles can be larger or smaller than the mobility Z1 directly inferred from the voltage applied to DMA-1 depending on whether Z1 is smaller or larger than Zg0, the geometric mean mobility of the input aerosol. (ii) The absolute value of the deviations between Z1, true and Z1 is larger for the high-mobility tail of the aerosol mobility distribution. (iii) The deviation (error) decreases as the width of input distribution increases, i.e., as the ratio of the transfer function width to the input distribution width decreases. (iv) At a fixed flow rate ratio, the error decreases with increasing sheath flow rate (compare and , both obtained for a flow rate ratio of 0.1, and sheath flow rates of 10 and 20 lpm, respectively, the rest of the operating parameters being the same.) Also, although not shown in any figure, it can be deduced from EquationEquation (9)[9] that for a fixed sheath flow rate the error increases with increasing aerosol flow rate, i.e., increasing β. There is also another trend, not so clearly observable from these figures: (v) the error, Z1, true/Z1 − 1, decreases as the mean mobility of the input aerosol, Zg0, decreases.
All these trends are implicitly contained in the analytical expression (9) which thus provides a practical means to quantify, with high accuracy, the error that may be committed if sufficient care is not taken. It must be noticed, however, that in order to use EquationEquation (9)[9] previous knowledge of the input distribution is required. And although, following the assertion of Knutson and Whitby (Citation1975b) about the possibility of accurate measurement of all the moments (not only the first), in principle it should be possible to determine the values of Zg0 and σg0 with a single DMA, the results presented here have shown the need to be cautious about the exact shape of the distribution near its tails. In our opinion, this last point deserves a further and deeper examination, and will be left for a future work.
Nevertheless, the results shown in – justify the following general recommendation: if the DMA is used as a monodisperse particle generator (from a polydisperse aerosol) it is advisable to extract the monodisperse particles from a zone close to the peak of the mobility or size distribution; in this case, the mobility inferred directly from the applied voltage is sufficiently accurate and a second DMA is not required. If it is not possible to generate an aerosol with mean mobility close to the desired value, one is then forced to withdraw particles of the desired mobility from the tails of another distribution; in this case, a second DMA connected in series with the first one gives the correct mobility of the target particles. If, finally, it is not possible to use a second DMA, EquationEquation (9)[9] can be used to infer the true mobility (with the reservations noted in the preceding paragraph).
PRACTICAL IMPLICATIONS
In this section, reference is made to past experimental works in which DMAs in tandem configuration were used to accurately measure the particle size for mobility-equivalent diameters below about 5 nm. The starting point was the work of Ichitsubo et al. (Citation1996), in which the penetration of nanoparticles and ion clusters through wire screens were measured experimentally, with the ultimate objective to examine the thermal rebound phenomenon. Ion clusters were classified by a Vienna type DMA (single configuration, not tandem) at four or five different voltages. A different mobility, calculated by EquationEquation (1)[1] , was then assigned to each of the classified aerosols. It turned out that the measured penetrations through the wire screen were roughly the same for all these four or five aerosols. In a subsequent work (Alonso et al. Citation1998), in which a tandem DMA configuration was used, it was understood that the four or five “different” aerosols were actually the same, in spite that they had been withdrawn from the DMA operated at different voltages. The DMA employed did not posses enough resolution to handle ion clusters and, as a result, the distributions measured with DMA-2 peaked at the same voltage regardless the voltage applied to DMA-1!
In another work (Alonso et al. Citation1997a), also employing a tandem DMA system, it was shown that theoretical penetrations through wire screens and laminar flow tubes agreed very well with the experimental ones only when the particle size was inferred from DMA-2 measurements. Charging probability of nanoparticles has also been measured using a tandem DMA configuration for the proper determination of particle size (Alonso et al. Citation1997b).
The fact that one of us has co-authored the four works cited in this section is simply because, to our knowledge, it seems that no sufficient attention has been paid so far to the possible source of sizing error studied in the present work. It is true that nowadays there are DMAs in the market which allow classification of ions and nanoparticles with much higher resolution than that attainable 20 years ago. But even with high-resolution DMAs great care must be taken if one insists in (or is forced to) extracting particles from the high-mobility tail of the distribution.
CONCLUSIONS
The main results of this work can be summarized thus: (1) when using a DMA to generate monodisperse particles from a polydisperse aerosol, it is advisable to extract the particles from the region close to the distribution peak, in which case the mean mobility-size of the particles can be accurately determined directly from the value of the applied voltage; (2) in contrast, if the monodisperse particles are extracted from the tails of the distribution, the true mean mobility-size of the particles has to be determined from measurements done with a second DMA connected in series with the first one; (3) the lack of accuracy in the correct particle size determination with a single DMA (if particles are withdrawn from the tails) becomes more severe as: the standard deviation of the distribution decreases, its mean mobility increases, or the mean aerosol residence time in the DMA increases; (4) if the mobility distribution of the aerosol is known, a second DMA is not needed because in this case it is possible to estimate the true mean mobility of the particles classified at a given voltage by using EquationEquation (9)[9] .
ACKNOWLEDGMENTS
We greatly appreciate the useful comments of the reviewers, which have helped us to improve the article and the clarity of its presentation.
REFERENCES
- Alonso, M., Alguacil, F.J., and Gómez, V. (2013). Approximate Relationship between Voltage and Mobility for Brownian Particles in Cylindrical DMAs. J. Aerosol Sci., 58:62–70.
- Alonso, M., and Kousaka, Y. (1996). Mobility Shift in the Differential Mobility Analyzer due to Brownian Diffusion and Space-Charge Effects. J. Aerosol Sci., 27:1201–1225.
- Alonso, M., Kousaka, Y., Hashimoto, T., and Hashimoto, N. (1997a). Penetration of Nanometer-Sized Aerosol Particles Through Wire Screen and Laminar Flow Tube. Aerosol Sci. Technol., 27:471–480.
- Alonso, M., Kousaka, Y., Hashimoto, T., and Hashimoto, N. (1998). Simplified Analysis of the Effect of Brownian Diffusion on the Relationship Between Applied Voltage and Central Mobility in the DMA. J. Aerosol Sci., 29:985–994.
- Alonso, M., Kousaka, Y., Nomura, T., Hashimoto, N., and Hashimoto, T. (1997b). Bipolar Charging and Neutralization of Nanometer-Sized Aerosol Particles. J. Aerosol Sci., 28:1479–1490.
- Chen, D.R., Pui, D.Y. H., Hummes, H., Fissan, H., Quant, F.R., and Sem, G.J. (1998). Design and Evaluation of a Nanometer Aerosol Differential Mobility Analyzer (Nano-DMA). J. Aerosol Sci., 29:497–509.
- Hagwood, C., Sivathanu, Y., and Mulholland, G. (1999). The DMA Transfer Function with Brownian Motion: a Trajectory/Monte-Carlo Approach. Aerosol Sci. Technol., 30:40–61.
- Ichitsubo, H., Hashimoto, T., Alonso, M., and Kousaka, Y. (1996). Penetration of Ultrafine Particles and Ion Clusters Through Wire Screens. Aerosol Sci. Technol., 24:119–127.
- Knutson, E.O., and Whitby, K.T. (1975a). Aerosol Classification by Electric Mobility: Apparatus, Theory and Applications. J. Aerosol Sci., 6:443–451.
- Knutson, E.O., and Whitby, K.T. (1975b). Accurate Measurement of Aerosol Electric Mobility Moments. J. Aerosol Sci., 6:453–460.
- Rader, D.J., and McMurry, P.H. (1986). Application of the Tandem Differential Mobility Analyzer to Studies of Droplet Growth or Evaporation. J. Aerosol Sci., 5:771–787.
- Stolzenburg, M.R. (1988). An Ultrafine Aerosol Size Distribution Measuring System. Ph.D. Thesis, University of Minnesota, Minnesota, USA.
- Stolzenburg, M.R., and McMurry, P.H. (2008). Equations Governing Single and Tandem DMA Configurations and a New Lognormal Approximation to the Transfer Function. Aerosol Sci. Technol., 42:421–432.
- Winklmayr, W., Reischl, G.P., Lindner, A.O., and Berner, A. (1991). A New Electromobility Spectrometer for the Measurement of Aerosol Size Distributions in the Size Range from 1 to 1000 nm. J. Aerosol Sci., 22:289–296.
- Zhang, S.H., and Flagan, R.C. (1996). Resolution of the Radial Differential Mobility Analyzer for Ultrafine Particles. J. Aerosol Sci., 27:1179–1200.